57,000 Jobs. The Market Rallied Anyway.
Market Recap — July 5th 2026
2026-07-05 · 10 min read · Originally published on Substack ↗

Hello my friends,
Fifty-seven thousand jobs. That is what the economy managed last month, barely half of what the Street had penciled in, the weakest print in months, the kind of number that used to send everyone sprinting for the exits. This time the market read it and bought. Not sold. Bought. When a miss that ugly gets treated as good news, the tape is telling you something louder than any single data point, and it is worth starting there.
Here is the part the single green number on your screen hides. This was not the index roaring back on the backs of its usual giants. It was the reverse. The megacap leaders that dragged everyone down in June spent the week catching their breath, and the broad market carried the load without them.
The Dow, of all indexes, printed its first close above 52,000 in history, the very week it welcomed Alphabet into its ranks, while the Nasdaq-100 those same tech names dominate barely twitched. When the old-economy index sets records and the tech index stalls, the money has already told you where it is going.
One week ago the index fell while the average stock rose. This week the average stock kept climbing and the index followed it up, equal-weight and cap-weight locked together just over 2%, the Nasdaq-100 trailing with a fraction of that. You are not looking at a market that dodged a correction. You are looking at one that never needed it, because it corrected itself from the inside, one rotation at a time. The broad market is carrying this tape now, not its biggest names.
Which brings me back to those jobs. A number that soft, bought that calmly, is the whole regime in one reaction: weak hiring is no longer a warning about earnings, it is a down payment on a rate cut, and the tape will keep reading it that way until something forces it to stop. Unemployment even slipped to 4.2%, and there is the tell inside the tell, it slipped because participation fell to 61.5%, the lowest since 2021. People are leaving the workforce, not finding jobs. The market took the friendly half and left the rest on the table. It usually does, right up until it can’t.
The next two weeks are a holding pattern. No real catalyst until the banks open earnings season, thin holiday volume, and one question hanging over all of it: does the rest of the market climb up to meet the leaders, or do the leaders roll back down to the rest. Everything I track says up. But “says” is not “did,” and July has a way of testing conviction on light volume.
To get the most out of these market recaps and understand the framework behind my observations, I encourage you to read about my methodology here.
📊 Market Health
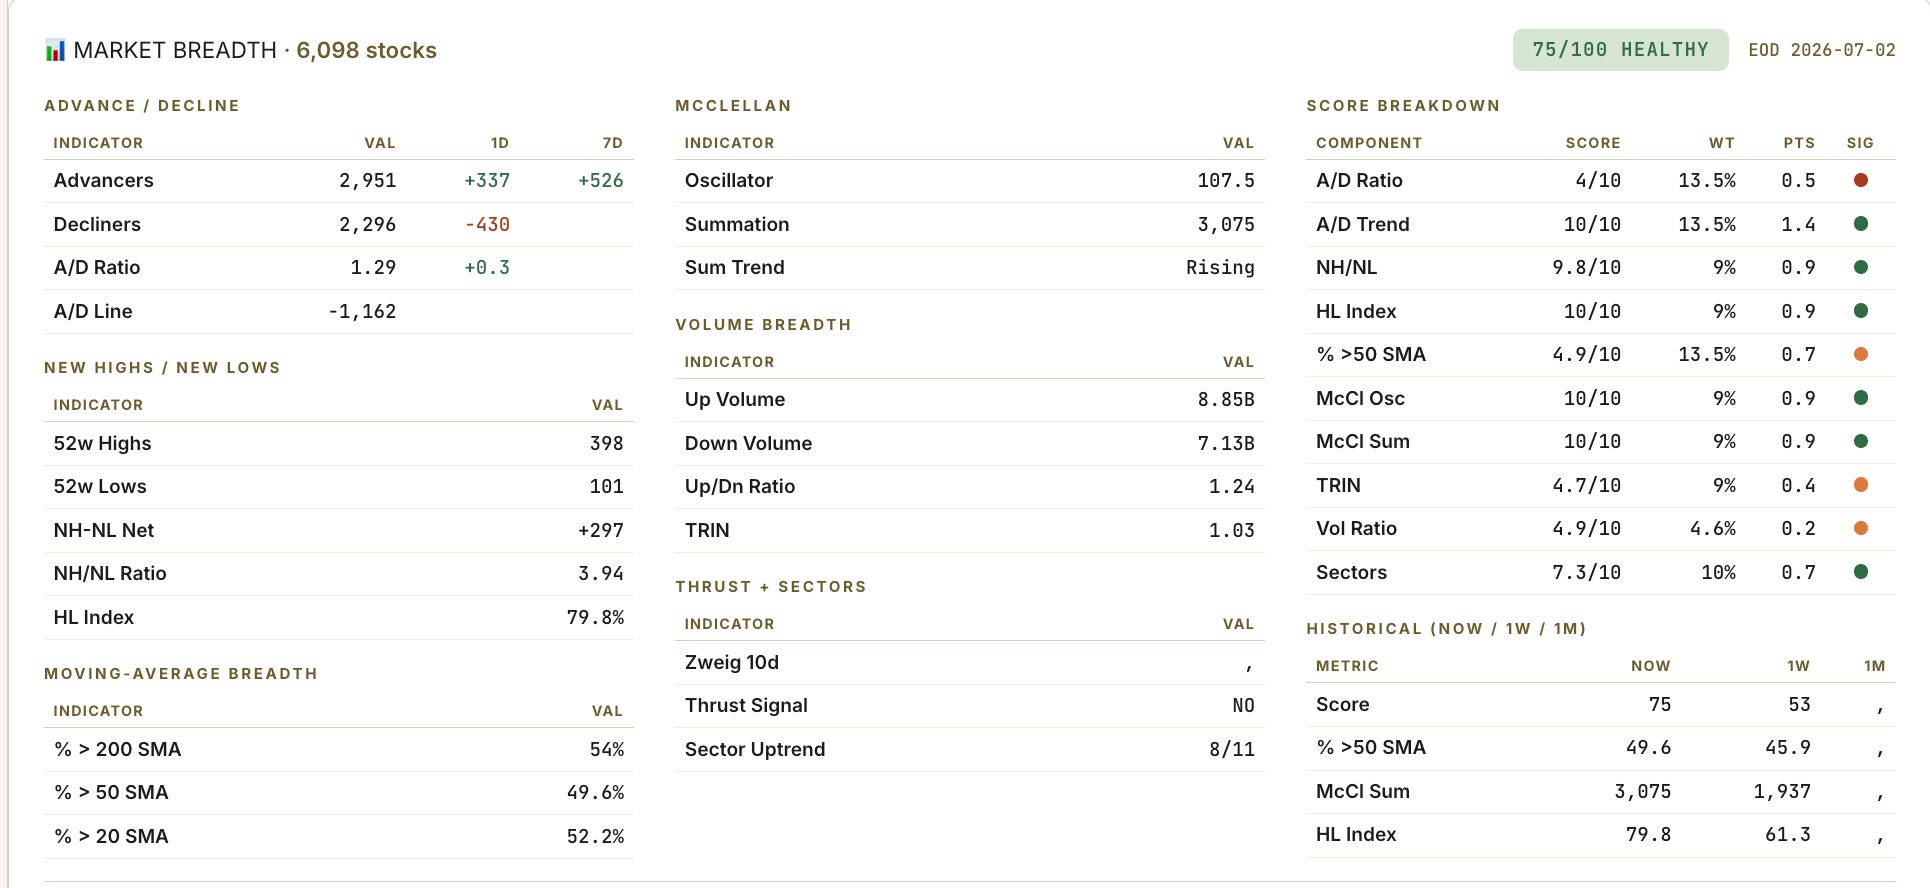
On the surface, Thursday was a shrug. Advancers barely edged decliners, five to four, nothing to write home about. One layer down, it is a different tape. The McClellan summation, the slow tide I keep pointing you to, kept accumulating at the same relentless pace it has held for weeks, roughly +900 on the week. New highs buried new lows almost four to one. The high-low index is pinned near the top of its range at 80. The strength this week was almost entirely below the waterline.
Last week I told you the day the summation turns is the day this healthy dip becomes something I respect more. It never turned. It kept climbing, and steady accumulation like that is worth more than any one-day spike.
Now the catch, and it cuts against my own caution. Participation is healing faster than I expected. Stocks above their 50-day line jumped seven and a half points, 42% to 49.6%. Above the 200-day, 47% to 54%. That is real ground in four sessions, and it still sits a hair under half. The tide turned hard. The water has not quite cleared the mark. The day more than half this market holds its 50-day, with small caps finally along for the ride, is the day I stop calling this an advance carried by its strongest half.
🚨 Sector Rotation
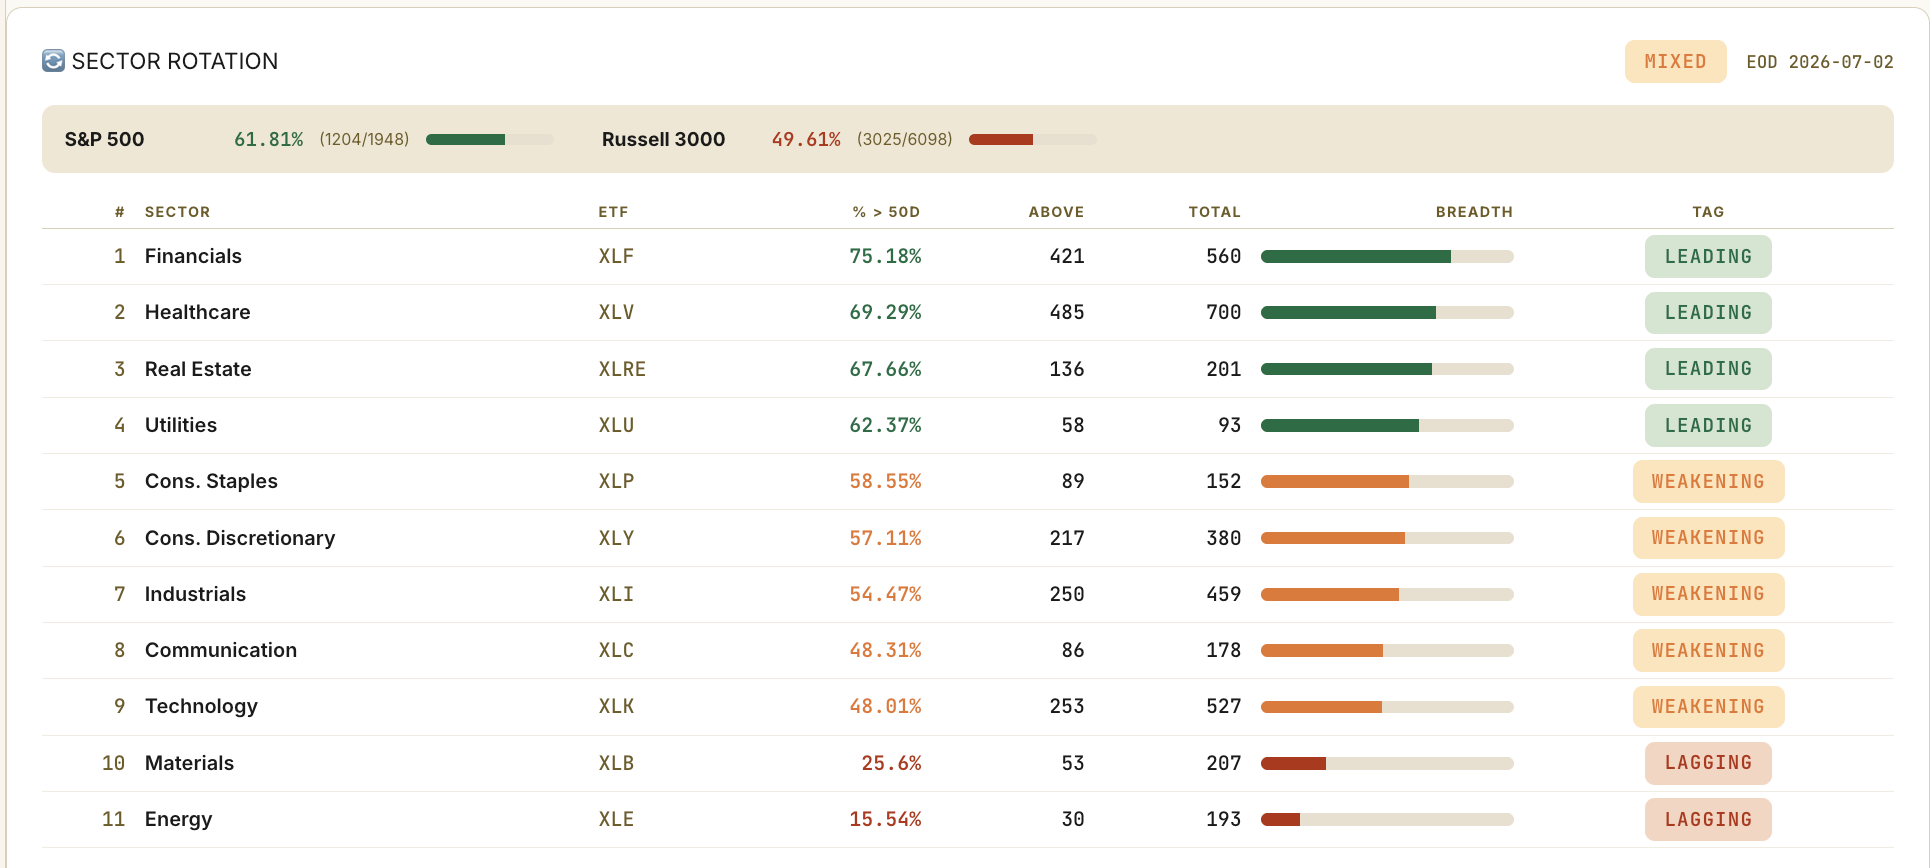
The trend board is unchanged in character from last week. Financials own it at 75% internal strength. Real estate and healthcare in the high sixties, utilities at 62%. At the bottom, the wasteland: materials, and energy at a brutal 16%, barely one stock in six holding trend. Seven of eleven sectors carry majorities above their 50-day.
The healthcare line is the one I care about. A week ago it read weakening, and I put a healthcare name up as trade of the week anyway, betting the leader would drag the group up behind it. This week the group showed up. Healthcare now sits with the leaders.
Then the price tape, which usually argues with the trend board and this week did not. The money went to financials, up 3.8%, communications, up 3.2%, discretionary, up 2.4%. Offense. And here is what got lost in all the green: tech did not get bought back. After Monday’s bounce it bled Wednesday and Thursday and closed the week red, down 0.3%. The defensive hideouts emptied too, utilities and real estate sold, only staples clinging to green. The bid chose offense, but it stepped around the megacaps that led the market up in the first place.
One name sits atop both boards, and it is the spine of this whole tape: financials. Best trend, best week. Whatever this market is building, it is building it through the banks.
🔍 Pairs Alignment
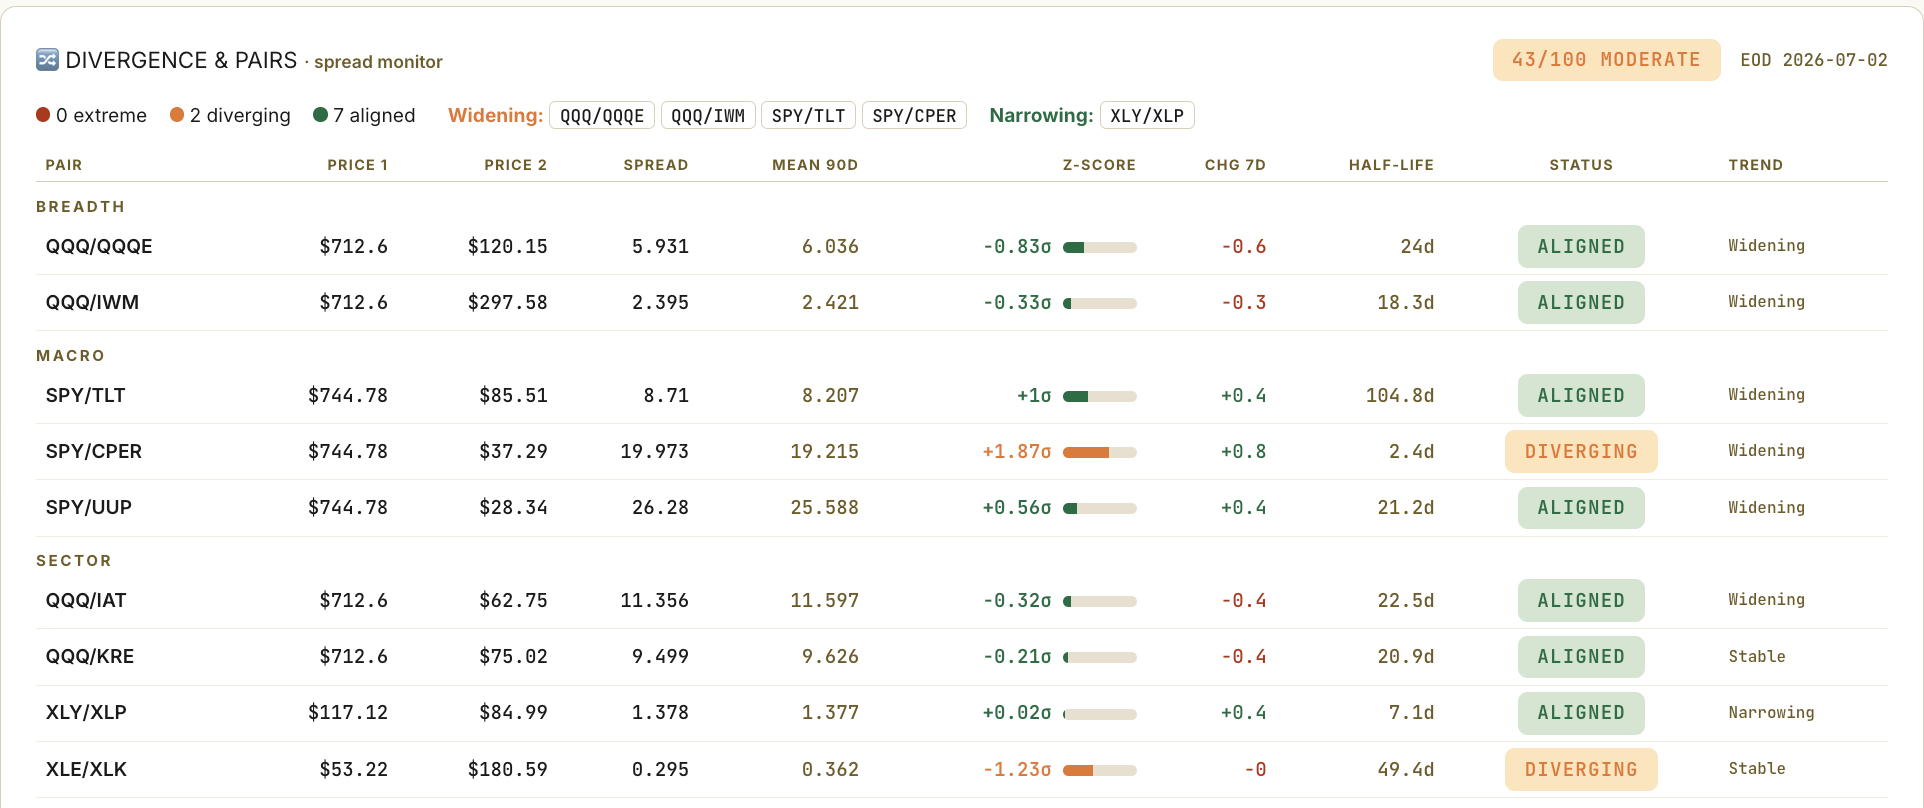
The cross-asset board barely moved, and under improving breadth that is exactly the confirmation you want. Nothing at an extreme, seven of nine pairs tracking their normal relationships.
Two spreads are pulling apart, and they say the same thing twice. The new one: the S&P against copper, stretched to nearly 2 standard deviations. Stocks are sprinting ahead of the metal that measures real demand. The old one: energy against tech, stretched for months and stretching further. Both tell you what kind of market this is. It is paying up for lower rates. It is not paying a dime for a faster economy.
The pair I watch is stocks against long bonds. Treasuries fell about 2% this week, and here is the part that should bother you: a jobs number that ugly should have sent bonds ripping higher, and instead they closed flat. A bond market that shrugs at data that weak is worried about something other than growth, and supply and deficits are the usual suspects.
It is not a threat to stocks yet. But look at who leads this tape, financials and real estate, the most rate-sensitive names on the board. A slow grind higher in yields, fine. A disorderly one is the single cleanest way this leadership breaks. That is the wire I am watching.
📉 Volatility
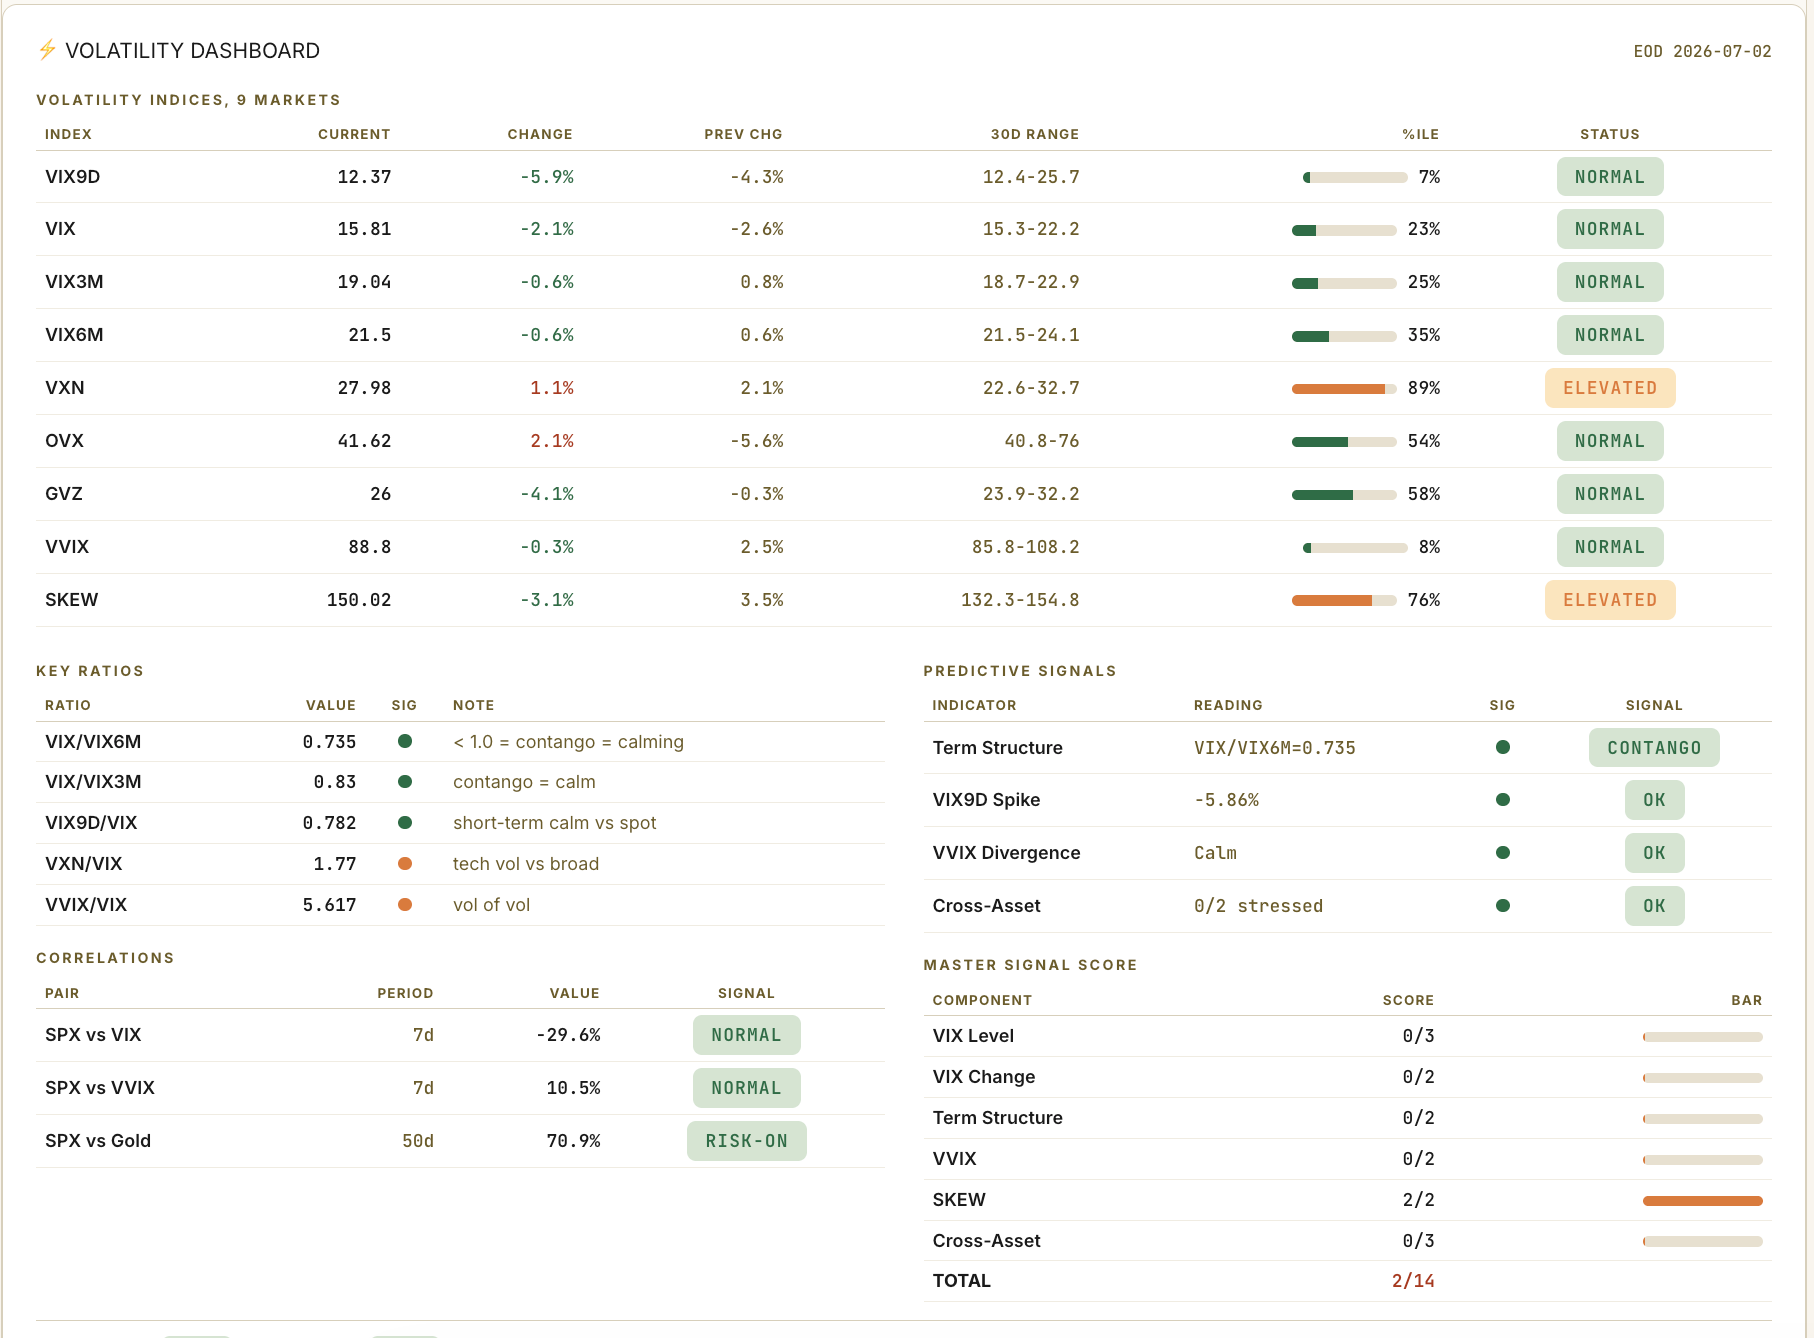
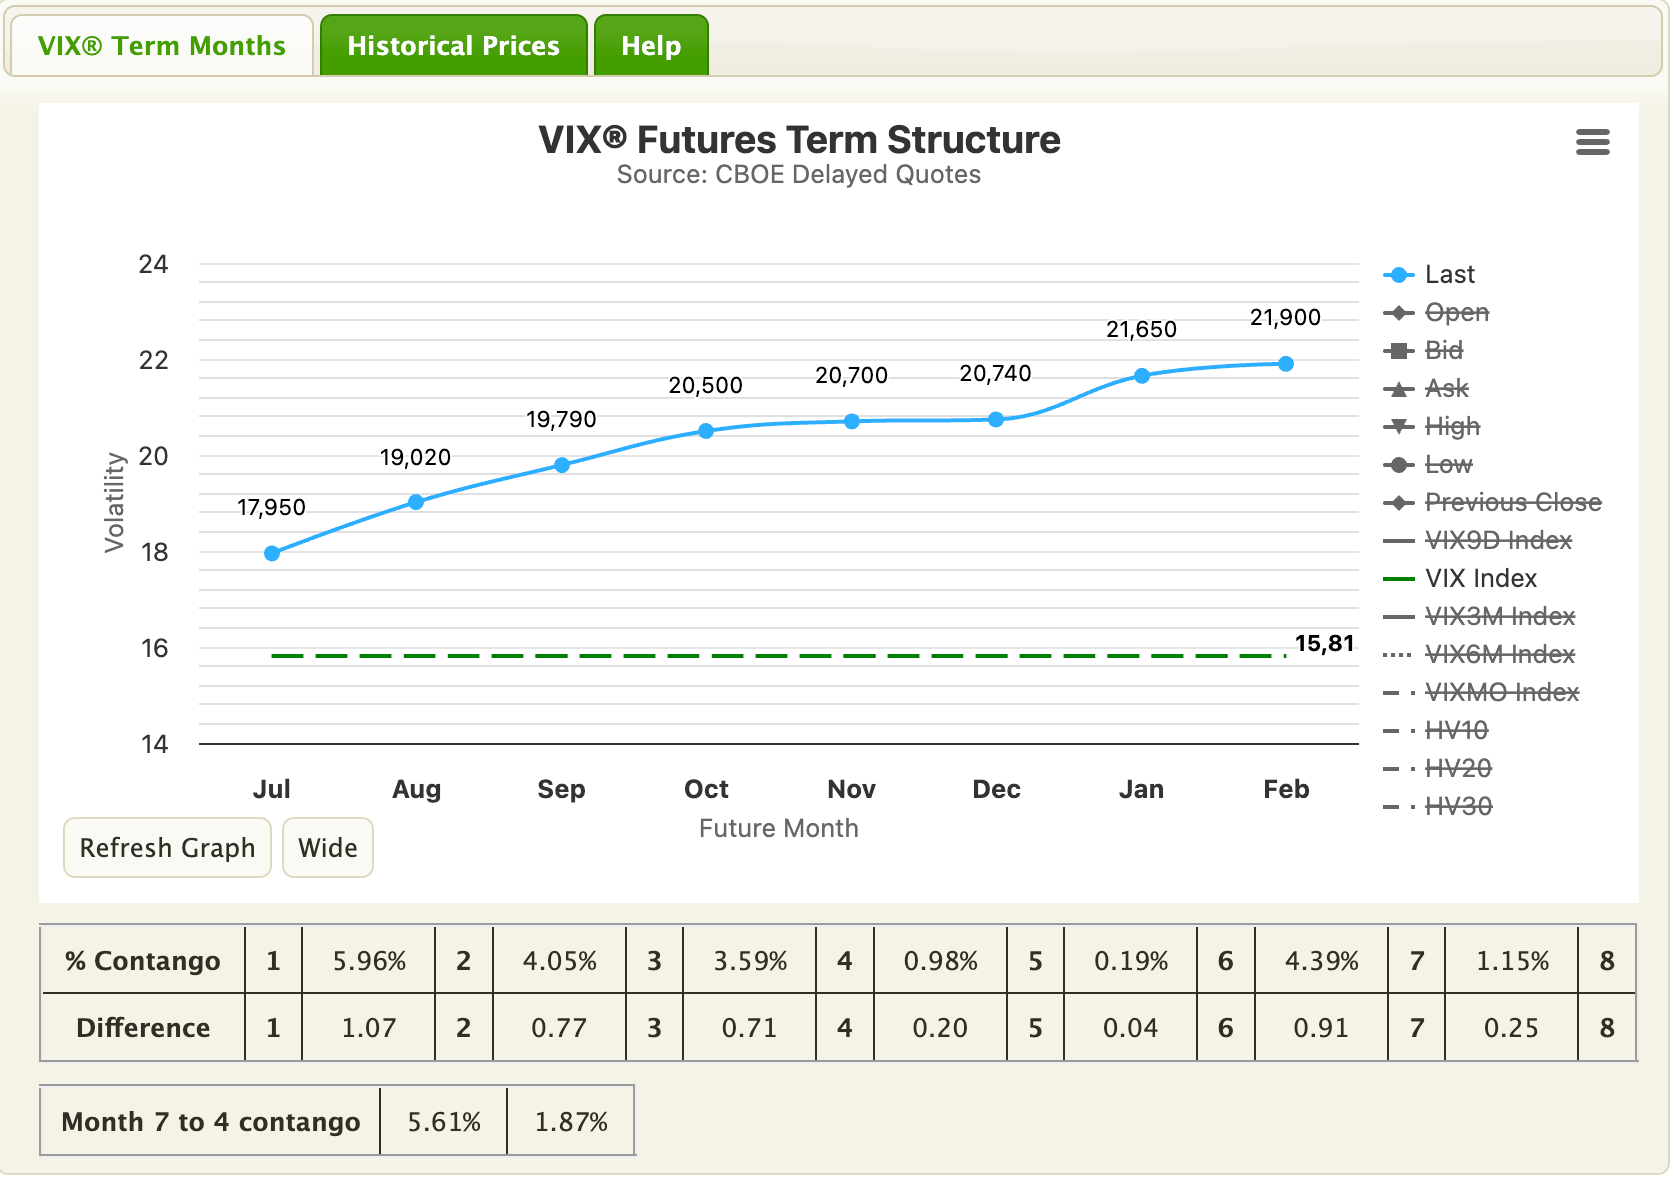
Broad volatility went from relaxed to asleep. The VIX fell 12% to 16.15, bottom third of its range, the curve in its usual calm upward slope, vol-of-vol on the floor. By every standard read, the options market sees nothing coming.
Except in one place, and it is the same place I have flagged for two weeks. Nasdaq volatility sits at the 89th percentile, the only vol index still lit up, and its premium to broad-market vol is pinned at the very top of its own range, its richest reading in a year. Two weeks ago the options market pointed at megacap tech. Last week tech fell. This week it kept pointing, and Wednesday semiconductors dropped 5.4% in a session. For three weeks the options market has aimed at tech, and for three weeks tech is where the damage showed up.
One more signal joined it: SKEW elevated at the 76th percentile, near 150. Someone sizable keeps paying for crash insurance while spot vol melts. I read that as healthy, not fearful. A market that hedges its tails while it climbs has not gone complacent, whatever a 16 VIX whispers.
So the posture holds for a third week. Do not waste money hedging the index, it is cheap because nothing on the broad board earns it. If you hedge, hedge the tech. Wednesday was the demonstration.
💱 FX
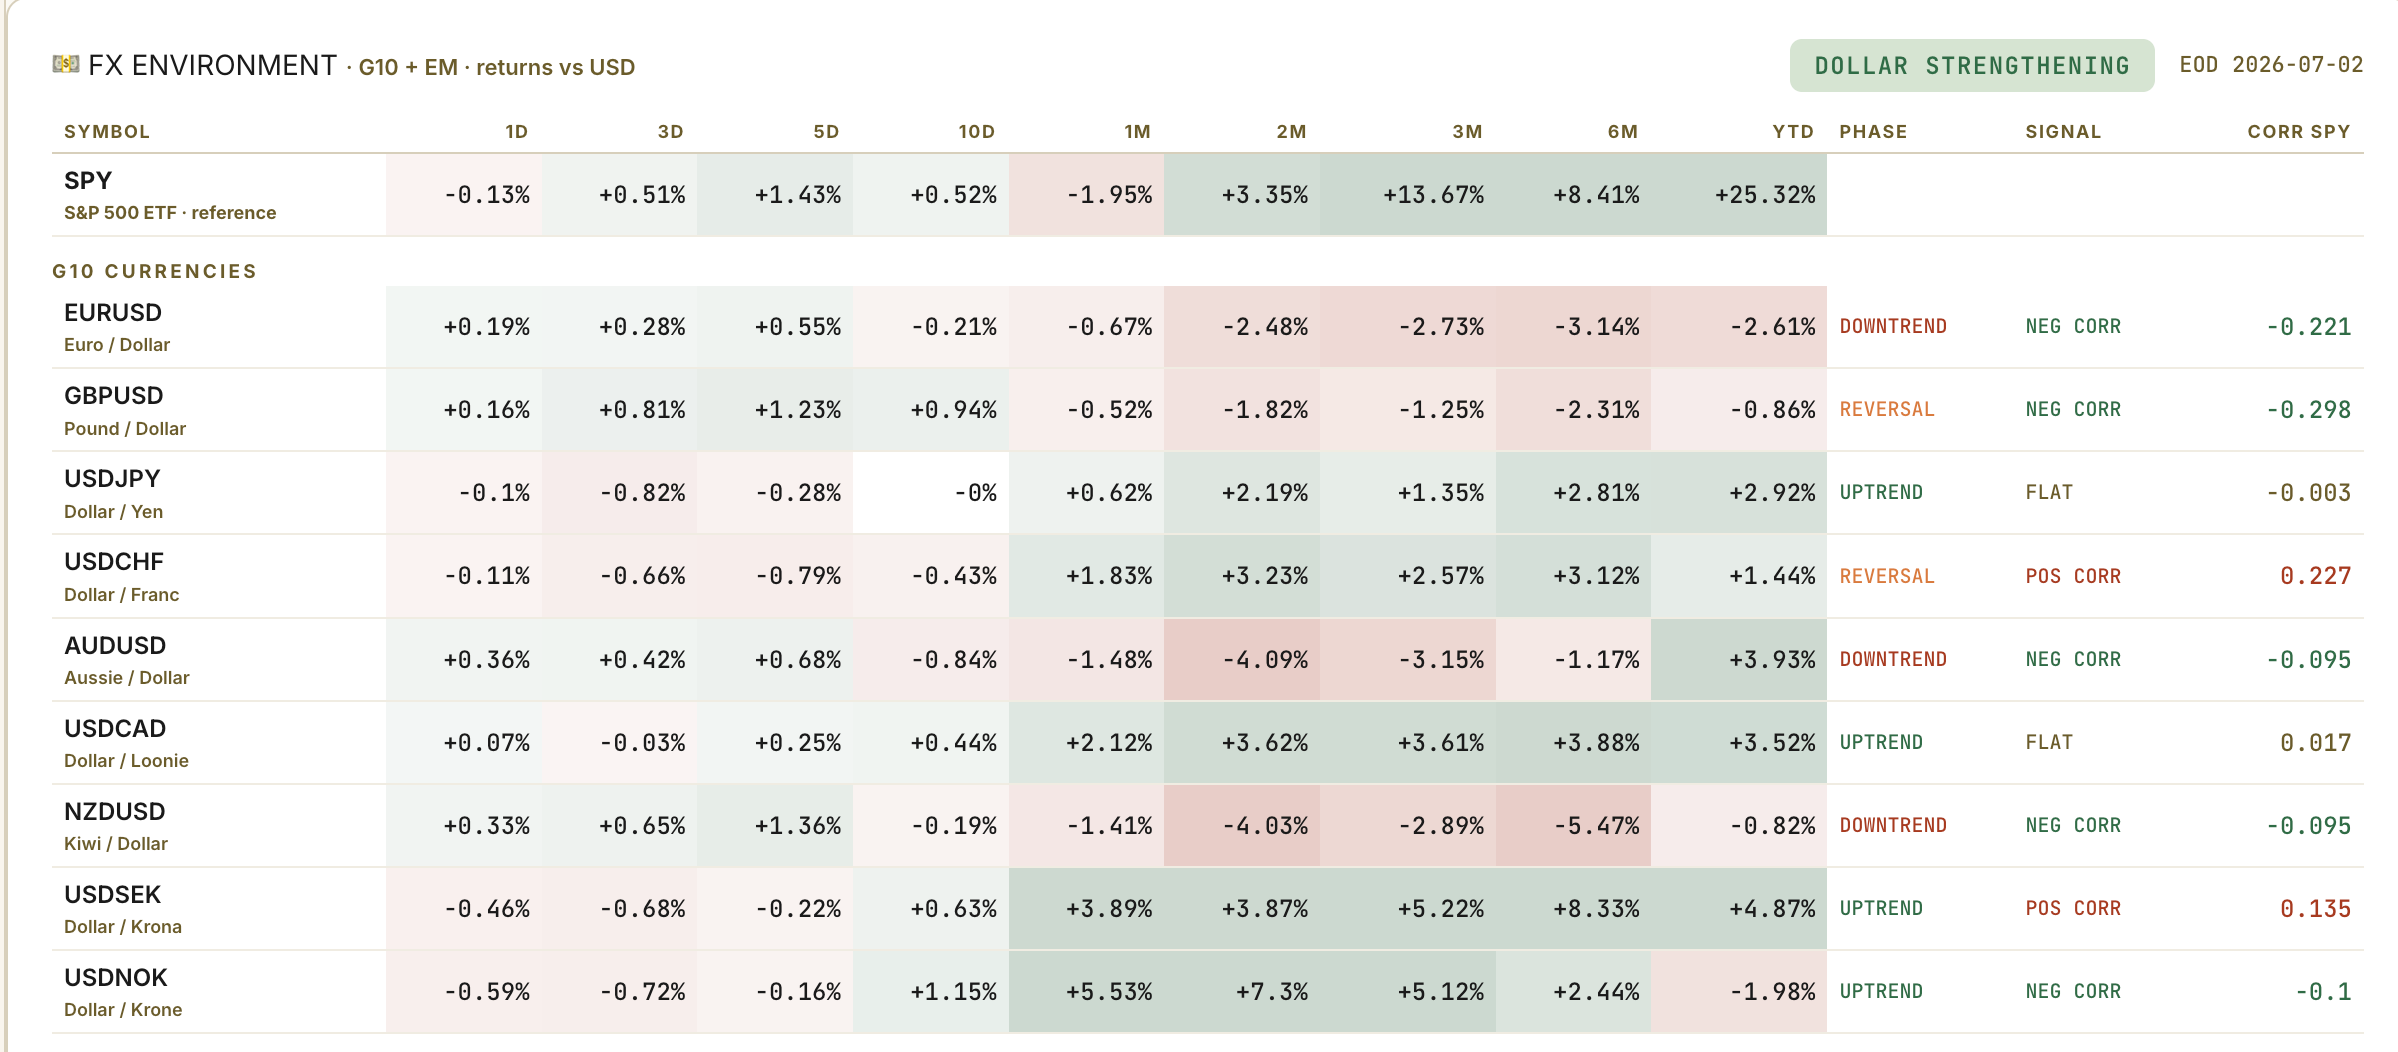
The dollar finally exhaled. After three weeks of grinding higher it gave back about half a percent, broadly: the pound up over 1%, the euro up 0.4%, the franc firmer, the yen flat. Gold added 1.2%. Nothing here that changes the regime.
The franc is the one line I promised to watch, because last week I told you the day it turns up is the day this rotation risks turning cold. It turned up this week. And it means nothing, for a specific reason.
Real haven demand looks like this: the franc rising while stocks fall, vol spikes and gold goes up. This week the franc firmed while stocks rallied, vol collapsed and breadth thrust. Read together, that is a dollar taking a breather and books squaring into a long weekend, showing up evenly across every major. A haven bid does not spread itself politely across the whole board.
🧠 My Take
The dull road paid, on schedule, and I am not going to pretend I outsmarted it. I told you I would not lean bearish into a rising summation, and four sessions made the case for me. I stay long.
What changes is the tilt. I am still anchored in the quality leadership, financials first, but I am done treating the defensive corners as the destination. The money that hid in utilities and staples is moving onto offense, and I want to be standing where it is going, not where it has been.
The worry list is shorter than last week, and the items on it are sharper. The soft surface I fretted about is healing fast, so it comes off. What stays: participation is still under half, so this thrust broadens or it tires, there is no third option. The bond market is selling off through weak data while the most rate-sensitive groups sit at the top of the leaderboard, comfortable until the day it very much is not. And the crowded corner reminded you Wednesday how fast it sheds 5%.
Here is how I weight the week ahead.
Broadening advance, base case, 55%. The summation keeps climbing, participation clears 50%, small caps join, and the tape walks into bank earnings on a wider base. The deep breadth backs this, and thrusts this strong tend to feed themselves.
The crowded corner cracks again, 25%. Wednesday was the trailer. Semis give back another leg, Nasdaq vol finally leaks into the broad tape, and if yields climb into it, the rate-sensitive leaders take the second blow. This is the scenario the tech hedge is paid to cover.
Summer stall, 20%. Thin holiday volume, no catalyst until the banks report, and the market chops sideways under its highs waiting for a reason.
🔥 Trade of the Week:
Cadence is one of two companies whose software nearly every chip designer on earth has to use. Nvidia, the memory makers, the startups still working out of a garage, all of them build on it.
It is the toll booth of the semiconductor boom. Paid in subscriptions, indifferent to which chipmaker wins, carrying none of the inventory risk that just took 10% off the equipment names in a single day. You do not need to pick the winner of the chip war to own it. Cadence gets paid either way.
The setup
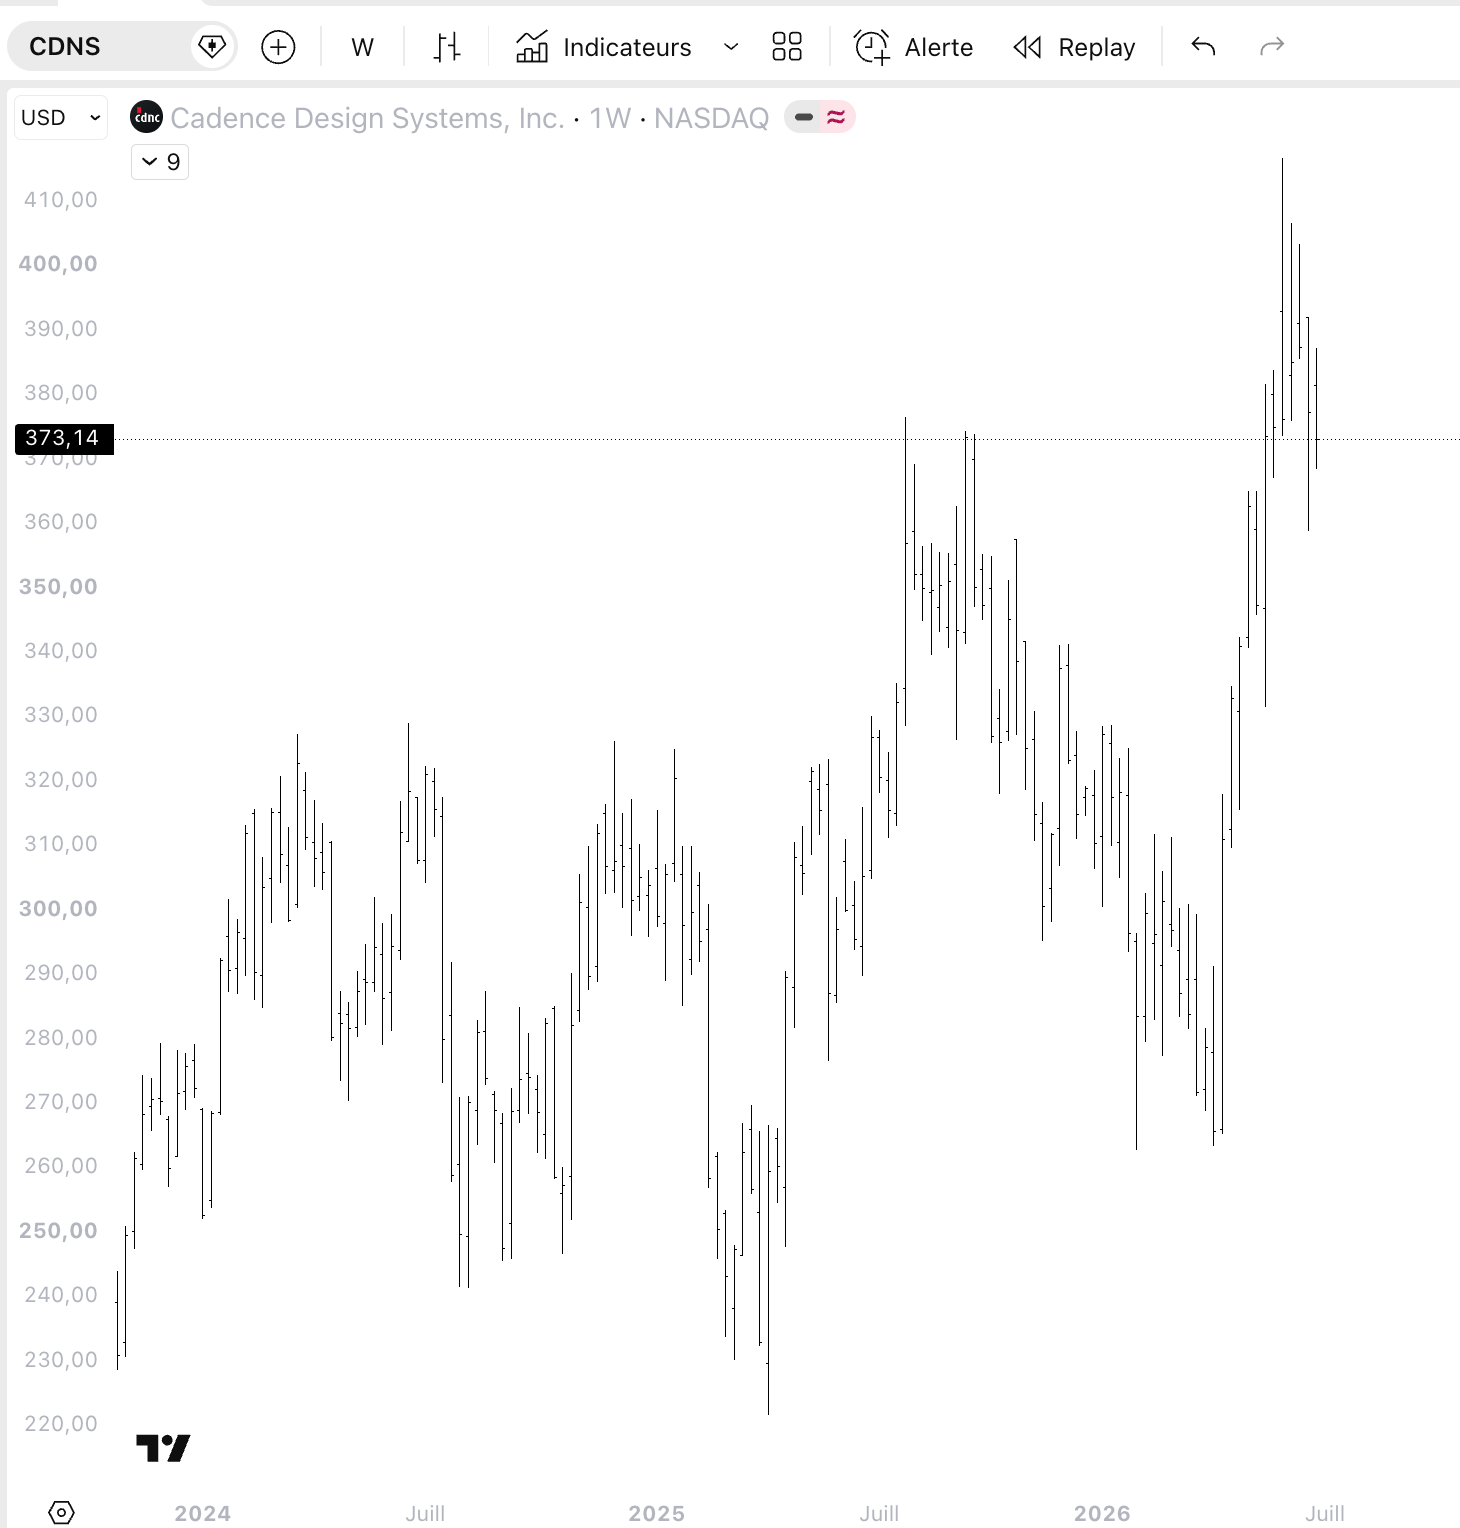
The stock ran about 34% last quarter, peaked near 417 in early June, and has spent the month since drifting lower.
It now sits at 373, roughly 10% off that high, holding just above its 50-day line near 368. The long-term uptrend is intact and momentum has reset to neutral. Nothing about the chart says the trend broke. It reads like a stock catching its breath.
The reason to want it now is simple. The market just put chips on sale, and this week’s single-name flow showed real money buying that sale. Cadence gives you the same exposure with a far steadier business underneath it.
The honest part
Earnings land in three weeks, on the 27th, inside the holding window. A soft print is the clean way this loses.
Tech still reads near the back of my sector board, ninth of eleven.
And read the insider tape before you size it. An SVP sold about $1.7M in late June on a scheduled plan, routine. But the CEO sold roughly $31M in early June, near the highs, and that is the number a bear will throw at you. Weigh it honestly.
The levels
Entry zone: $355 to $360, on a dip toward the floor of the past month’s range
Stop: a close below $331, which sits just above the 200-day line
Target 1: $416, the prior high
Target 2: $430, if the move has legs
Sizing: small, and scale in. Keep powder dry for the earnings print inside the window.
See you next week,
Daniel
P.S. I opened the APP yesterday. It's the daily version of what you just read, the same boards and screeners I run every morning before I trade. The founding price, 50% off the first year, holds until July 19, then it goes back to full.
Disclaimer
This newsletter is for educational and informational purposes only. It is not financial advice.
The content reflects personal opinions shared publicly as a journal. Trading stocks, options, futures, or any financial instrument involves significant risk. You can lose your entire investment. There is no guarantee of profit.
The author is not a registered investment advisor, broker, or financial professional with any regulatory authority including the SEC or CFTC. Always consult a licensed financial advisor before making any investment decisions.
By reading this newsletter, you accept full responsibility for your own trading and investment choices. Past performance does not guarantee future results. Markets are unpredictable.
Screenshots are courtesy of TradingView, VixCentral, and other platforms with which the author has no affiliation. Information shared may contain errors or become outdated quickly.
This content is the intellectual property of the author. Copying or redistributing without permission is prohibited.
By continuing to read, you acknowledge and accept these terms.
Read the desk every week
Market analysis in plain English, plus the app that scans the whole US market for you.
Become a member Read the original on Substack ↗