85% of stocks are in a downtrend. Only one sector survived.
Market Recap — March 22nd 2026
2026-03-22 · 13 min read · Originally published on Substack ↗

TL;DR
My market breadth score dropped to 14 out of 100. The worst reading since I started this newsletter. 85% of stocks are now in a short-term downtrend. Only Energy is still standing. Ten sectors out of eleven have rolled over. The dashboard says it clearly: correction confirmed.
The VIX (the market’s fear gauge) spiked +11% on Friday alone. Short-term fear is normalizing, but the 3-month and 6-month VIX are at the 98th and 100th percentiles. The market expects this to last months, not weeks.
Trade of the Week: AMD. Bottom fishing signal fired 9 times in 15 days. Sitting right on a major support level at $200 that held for over a year.

Hello my friends,
Week four of the Iran war. The week started calm. VIX dropped to 22 by Tuesday. Then Friday hit. VIX spiked +11% in a single session. 225 stocks made new 52-week lows. Only 14.8% of S&P 500 stocks are still above their short-term moving average. That means 85% of the market is in a short-term downtrend.
One sector is still standing out of eleven. One. Energy. Everything else has rolled over.
My breadth score fell from 28 to 14. Last week I said the cushion above 50% on the High-Low Index was thin. It broke. We are now at 27.7%. The regime label on my dashboard says it clearly: correction confirmed.
Let’s break it all down.
To get the most out of these market recaps and understand the framework behind my observations, I encourage you to read about my methodology here.
Market Breadth
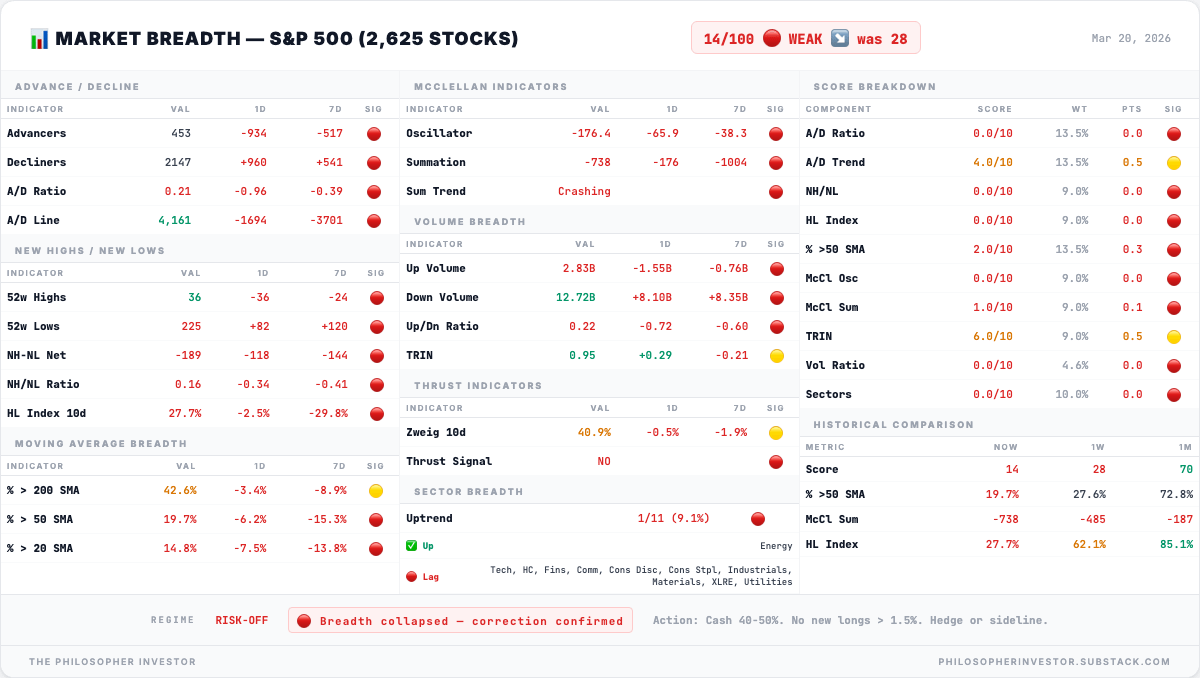
Breadth Score: 14/100 — 🔴 VERY WEAK
Down -14 points from last week’s 28. Down -56 points from one month ago (70). This is the lowest reading since the newsletter started.
Friday was brutal. The advance/decline ratio (how many stocks went up vs down) collapsed to 0.21. For every stock that rose, nearly five fell. Last week this was already weak at 0.48. Now it is capitulation-level selling.
The McClellan Oscillator plunged back to -176.4. Last week it was at -184.3 and I called it “the deepest negative reading we have recorded.” We are right back there. The McClellan Summation (the cumulative version that shows whether the damage is building or fading over weeks) dropped to -738 and the trend label says one word: Crashing. One week ago this was -485. One month ago it was -187. The damage is accelerating, not stabilizing.
The High-Low Index measures the ratio of stocks making new highs vs new lows over the past 10 days. Last week I warned that 50% was the danger zone and we were sitting at 62.1% with a “thin cushion.” This week: 27.7%. A -34 point collapse. We blew through the danger zone and kept going. There are now 225 new 52-week lows vs only 36 new highs. That is a 6-to-1 ratio of stocks breaking down vs breaking out.
Participation is collapsing. Only 19.7% of stocks are above their 50-day moving average. one month ago that was 72.8%. Only 14.8% above their 20-day. Less than half (42.6%) are above their 200-day. The average stock is not in a correction. The average stock is in a bear market.
Only 1 out of 11 sectors is still in uptrend: Energy. That is it. Last week we had 2 (Energy and Utilities). Now Utilities has joined everything else in rolling over. Technology, Health Care, Financials, Communication, Consumer Discretionary, Consumer Staples, Industrials, Materials, Real Estate, Utilities. all lagging.
The action recommendation: Cash 40-50%. No new longs above 1.5% position size. Hedge or sideline.
🚨 Sector Rotation: Oil and Defensives Still Running
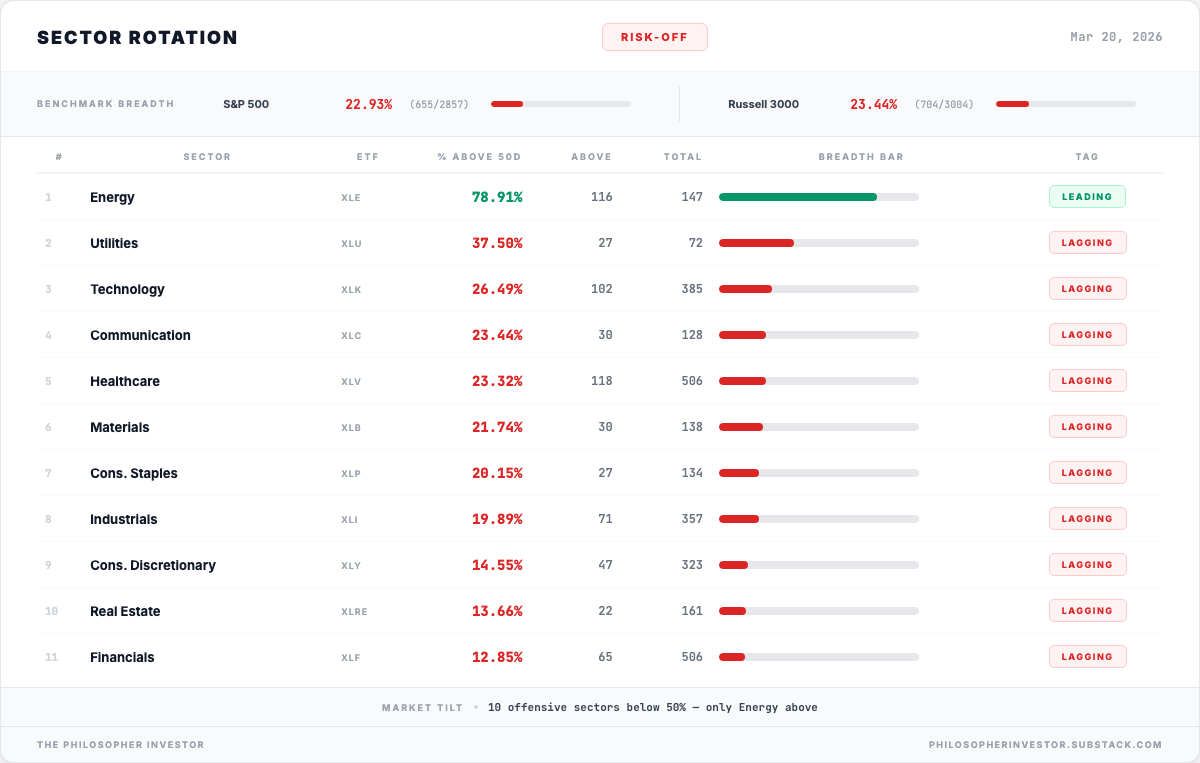
10 offensive sectors below 50%. only Energy above.
Energy (XLE) is the last one standing at 78.91%. Nearly 4 out of 5 energy stocks are still in an uptrend. Tagged LEADING. Nothing else comes close.
Utilities (XLU) was the second survivor last week. Not anymore. It rolled over to 37.50% and is now tagged LAGGING. When even the defensives start breaking, you know the damage is broad.
Below that, every sector is a shade of red. Technology (XLK) at 26.49%, meaning three out of four tech stocks have lost their trend. Industrials (XLI) at 19.89%. Consumer Discretionary (XLY) at 14.55%, only 47 out of 323 stocks holding up. And at the bottom: Financials (XLF) at 12.85%. Only 65 out of 506 financial stocks are above their 50-day. 87% of financials are broken.
S&P 500 benchmark: 22.93%. Russell 3000: 23.44%. Less than one in four stocks is still in an uptrend. The broader you look, the worse it gets.
🔍 Divergence Score: 25/100 — HIGH RISK
1 extreme. 3 diverging. 4 aligned. This is a big shift from last week.
This dashboard tracks whether different parts of the market are moving together or pulling apart. When everything sells in sync, divergence is low. When some assets start behaving differently, that is where both risk and opportunity show up.
The extreme signal: the dollar. The spread between US equities and the US dollar just hit its widest reading in over a year. The dollar is strengthening aggressively while stocks sell off. Money is leaving equities and piling into the dollar at a pace we almost never see. Flight to safety, accelerating.
Three relationships are diverging:
Stocks vs bonds. Both are falling, but at different speeds. In a normal selloff, bonds rally when stocks drop. That is not happening. Both are going down because the oil shock is forcing inflation expectations higher, trapping the Fed. Nowhere to hide.
Big tech vs average tech. The largest tech names are dragging the index down harder than the average tech stock. Concentrated selling in mega caps.
Discretionary vs staples. Consumers are rotating from things they want to things they need. Classic recession-fear signal. This was diverging last week too. It has not resolved.
The remaining 4 pairs are aligned, falling together. No signal there.
Last week the divergence score was 35 with 2 diverging pairs. This week it dropped to 25 but the quality of the signals is more concerning. An extreme dollar reading plus divergences in bonds and consumer behavior. The stress is structural.
📉 Volatility: VIX 26.78. Master Signal 5/10 ELEVATED
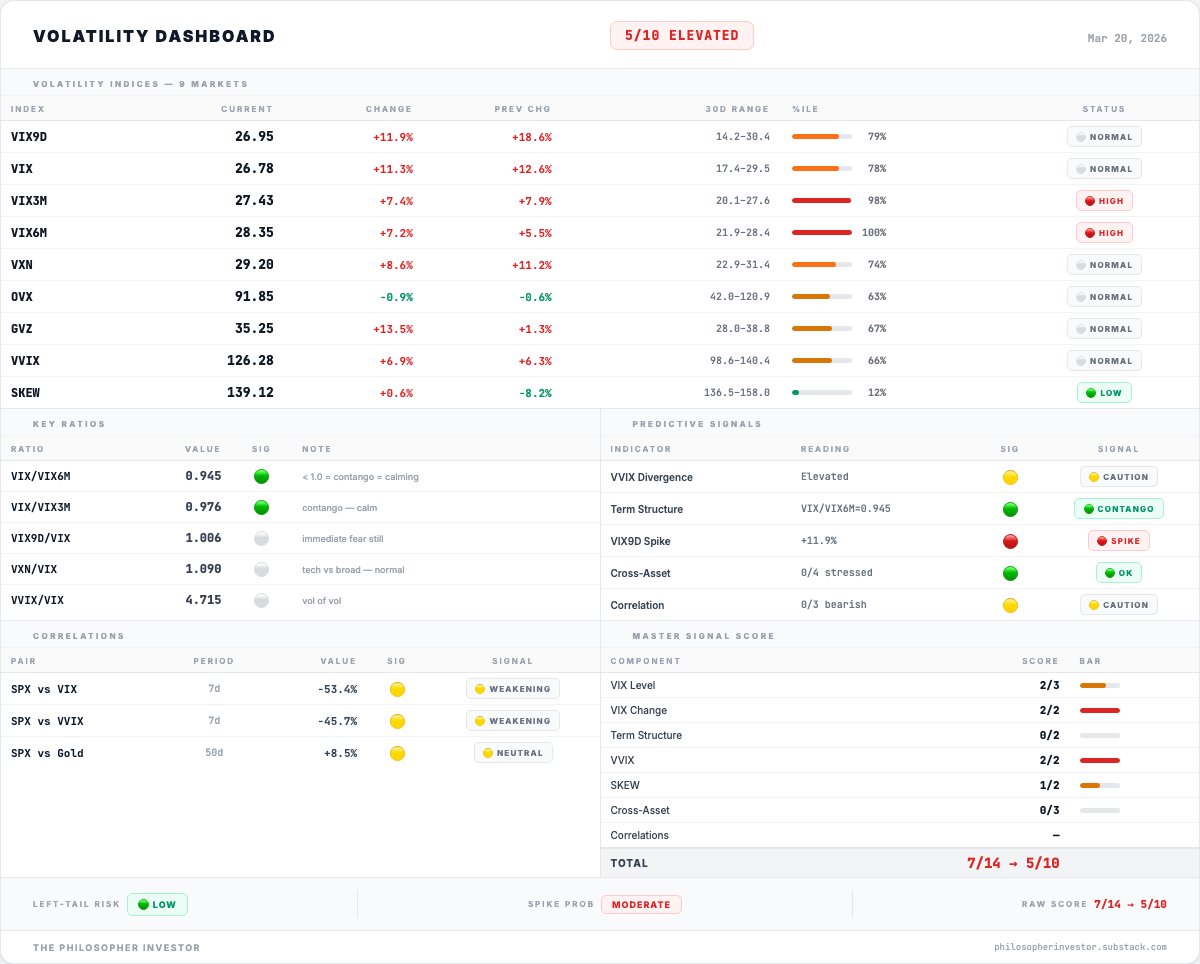
The VIX told the whole story of the week in five days. Monday and Tuesday the market exhaled. VIX dropped to 22. It felt like the worst was behind us. Then Friday happened. +11% spike in a single session back to 26.78. The calm was fake.
Here is what matters this week. The vol dashboard is showing a split personality. The short-term readings (next few days, next month) have all normalized. The panic from two weeks ago has been absorbed. If you only looked at those numbers, you would think the storm passed.
But zoom out to three months and six months. Both are at the highest levels we have recorded. The market is telling you something important: this is not going away fast. Traders are calm about next week. They are terrified about the summer.
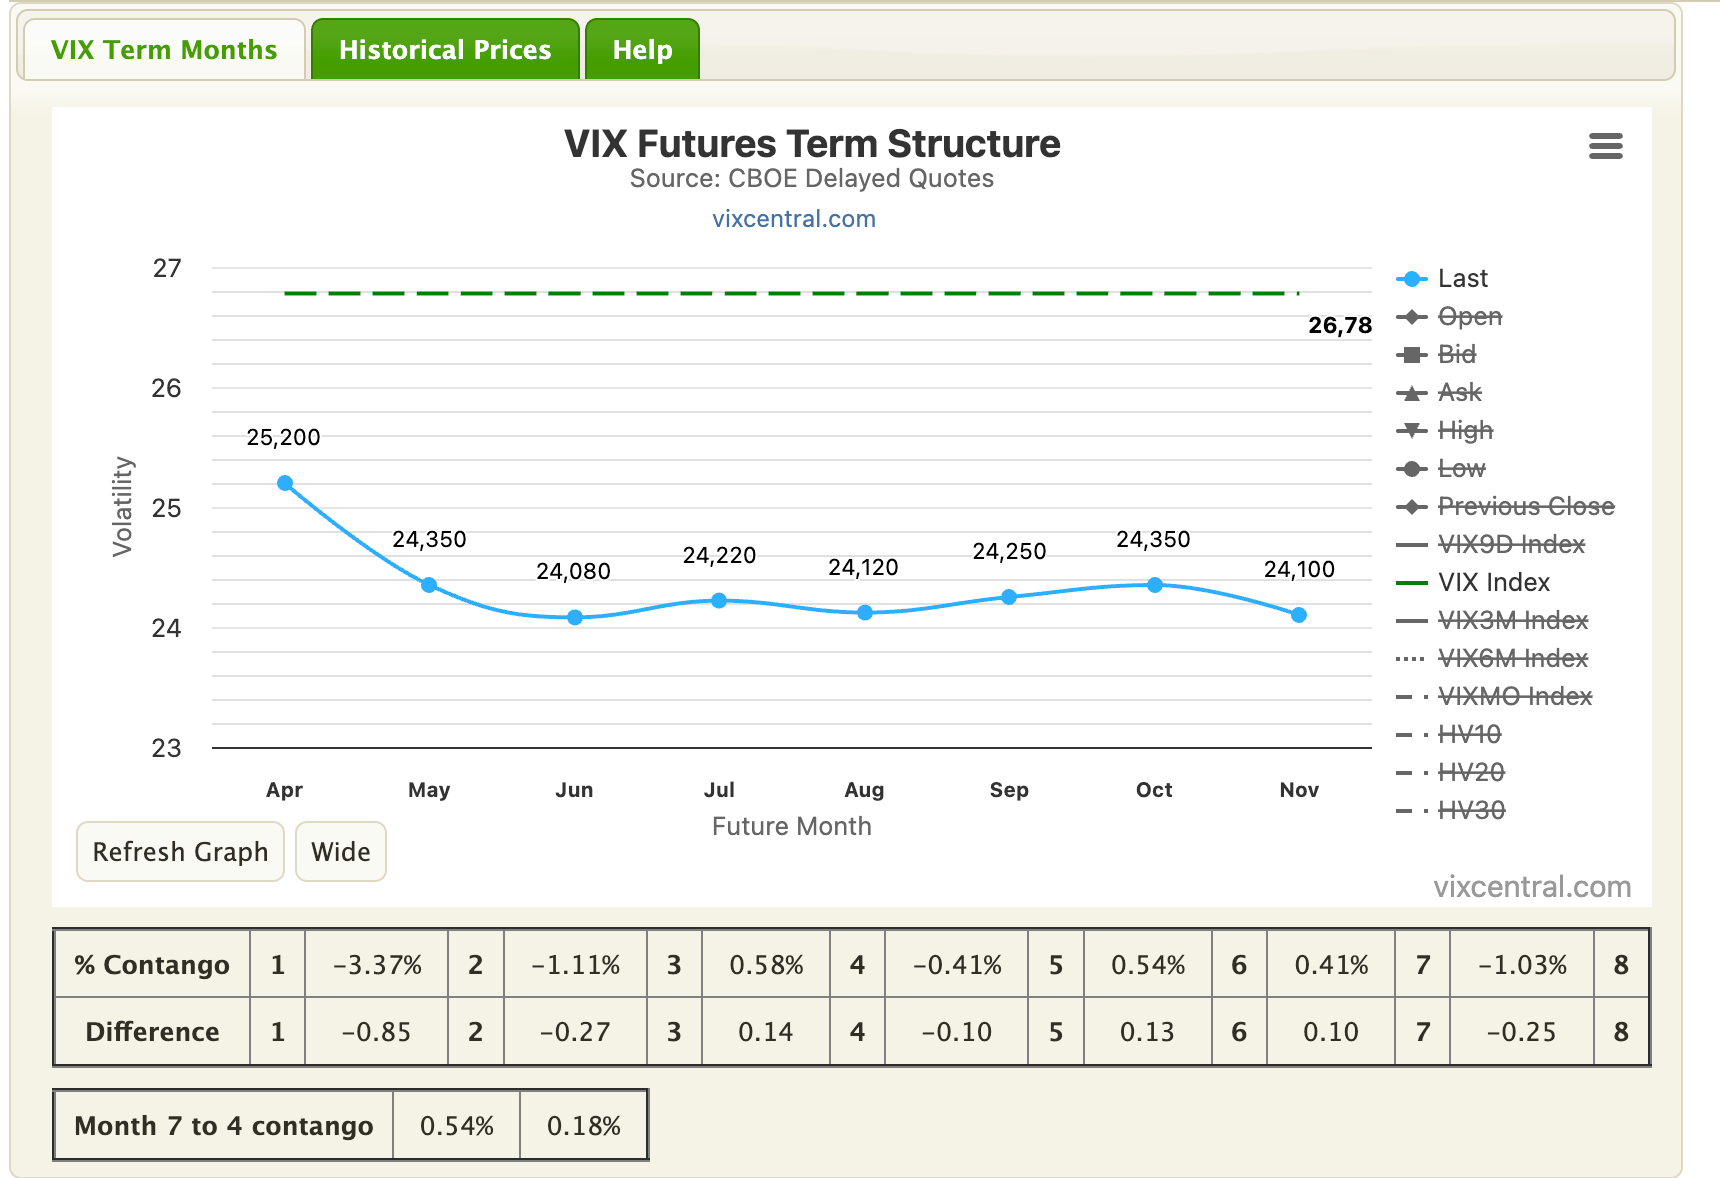
The VIX futures curve backs this up. Spot VIX at 26.78 is sitting above every single futures month out to November. That means the market is paying more for protection today than at any point in the future. The futures are pricing in a gradual cooldown, but they are settling around 24-25. Not 15. Not calm. Just less panicked. The new normal is elevated.
Gold volatility jumped +13.5% even as gold’s price fell -4%. When price drops and volatility rises at the same time, it means the market expects more turbulence ahead, not less. Oil vol went the other way, cooling from 119 to 91 as the initial Hormuz shock gets digested.
One last thing. Demand for crash protection has dried up. Not because nobody is scared. Because everyone who wanted insurance already bought it. The hedges are in place. They stopped buying because they are already covered.
💱 FX Signal: RISK-OFF CONFIRMED
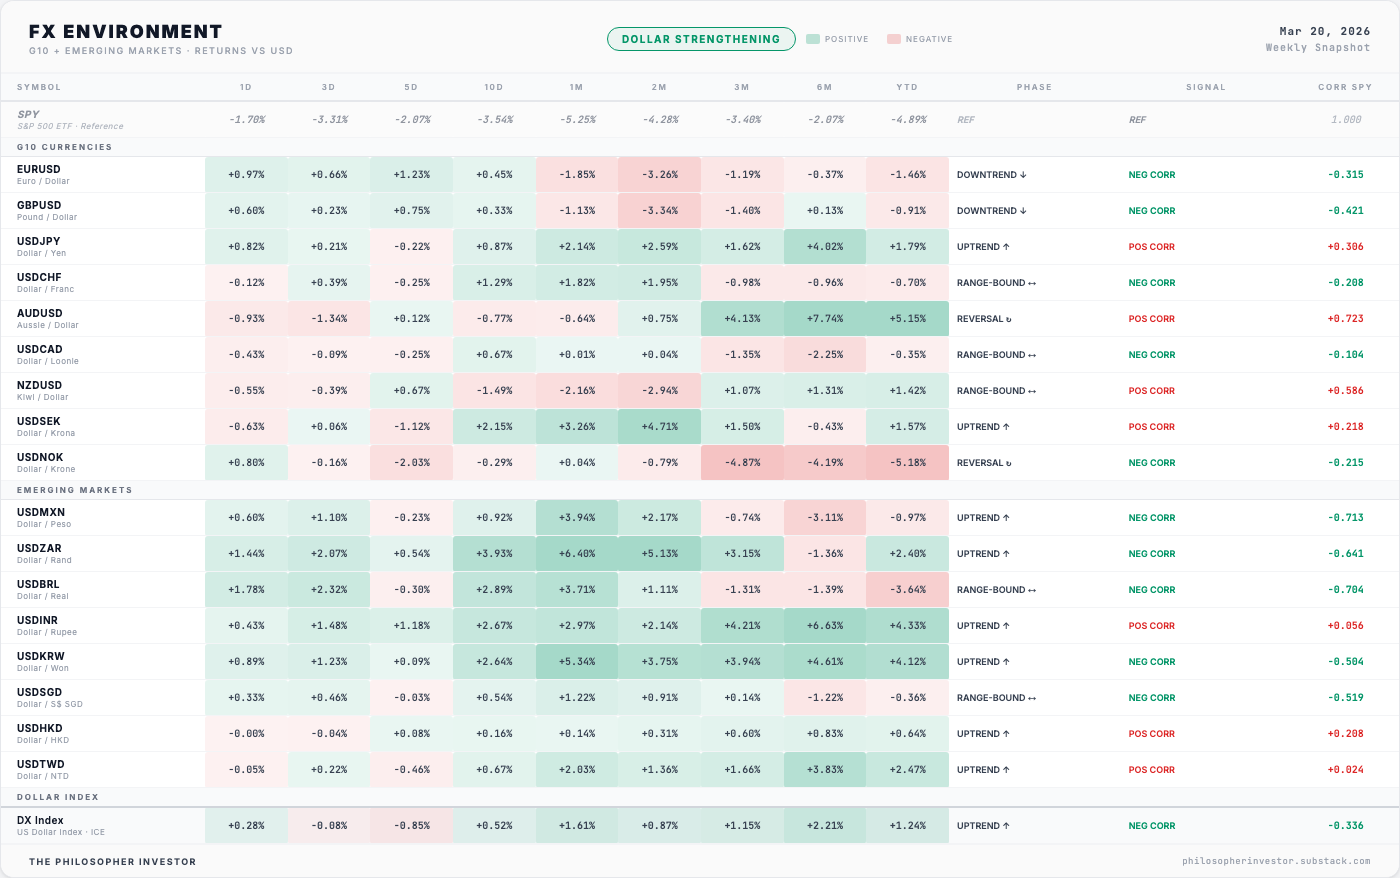
The dollar is strengthening. That is the headline from the FX dashboard, and it tells you everything about the current regime.
When stocks sell off globally, money needs somewhere to go. Right now it is going into the US dollar. The Dollar Index is in an uptrend, up +1.24% YTD while SPY is down -4.89%. Capital is leaving risk assets and parking in the world’s reserve currency.
The yen is not working as a safe haven. In past selloffs, the Japanese yen rallied as investors unwound risk positions. Not this time. USDJPY is in an uptrend, meaning the yen is weakening. If you were counting on yen exposure as a hedge, it is not doing the job.
Commodity currencies are diverging. The Australian dollar and the Norwegian krone are both flashing reversal signals. Australia exports commodities. Norway exports oil. Both currencies are benefiting from the same energy/commodity surge that is hurting everything else. When the rest of the FX market screams risk-off but commodity currencies are holding up, it confirms that the oil/commodity trade is real and not just a one-week spike.
Emerging markets are under pressure. The South African rand, Korean won, and Indian rupee are all weakening against the dollar. When the dollar strengthens this fast, it squeezes EM economies that borrow in dollars. This adds another layer of global stress on top of the oil shock.
🧠 My Take
Breadth went from 70 to 28 to 14 in three weeks. Every week I think the damage is done. Every week it gets worse. Tuesday the VIX dropped to 22 and for two days it felt like a turning point. Friday erased all of it.
What worries me is not one indicator. It is that every dashboard I run is saying the same thing at the same time. The dollar is diverging from equities at a pace I almost never see in my data. Stocks and bonds are falling together, which means there is nowhere to hide in traditional assets. Only 1 sector out of 11 is still in an uptrend. Retail is buying calls while institutions are loaded with puts. The vol curve is calm about next week but pricing in fear through the summer. When all your signals line up like this, the message is not subtle.
The sector data is what stands out to me personally. Financials at 12.85% breadth. Discretionary at 14.55%. These are the sectors that tell you what the real economy is doing. When banks and consumer spending stocks break this hard, the market is pricing in something worse than a correction. It is pricing in an economic slowdown.
Meanwhile energy is at 78.91% and completely disconnected from everything else. I have never seen this kind of gap in my data. Two different markets running side by side. If you are positioned in energy, you are having a great year. If you are in anything else, you are in a bear market. That divergence cannot last forever. Either energy comes down or the rest catches up. I think the answer depends entirely on how long Hormuz stays disrupted.
For now: positions small, stops tight, cash high. Cash 40-50%.
Scenario matrix for March 22-28:
Most likely (35%): Dead cat bounce. Quarter-end window dressing (March 31) creates a mechanical bid for a few days. SPY bounces to $650-655. VIX drops to 24-25. Do not mistake it for real demand. Fund managers are buying winners and selling losers to clean up their quarterly reports.
Second (30%): Continued grind. Breadth stabilizes 10-20. VIX stays 25-28. New lows continue above 200 daily. Energy leads, everything else bleeds. The market is waiting for a catalyst and not getting one.
Possible (25%): Capitulation flush. Breadth drops below 10. New lows explode above 400 in a single session. VIX spikes above 35. SPY tests the 200-day. Paradoxically, this is where the best buying opportunities emerge. But you need cash to take them.
Unlikely (10%): Diplomatic resolution. Some breakthrough on Iran. Oil crashes below $85. VIX drops below 20. Breadth snaps above 40 in a week. Least likely. Iran has no incentive to deal right now.
🔎 Options Flow — Smart Money Positioning
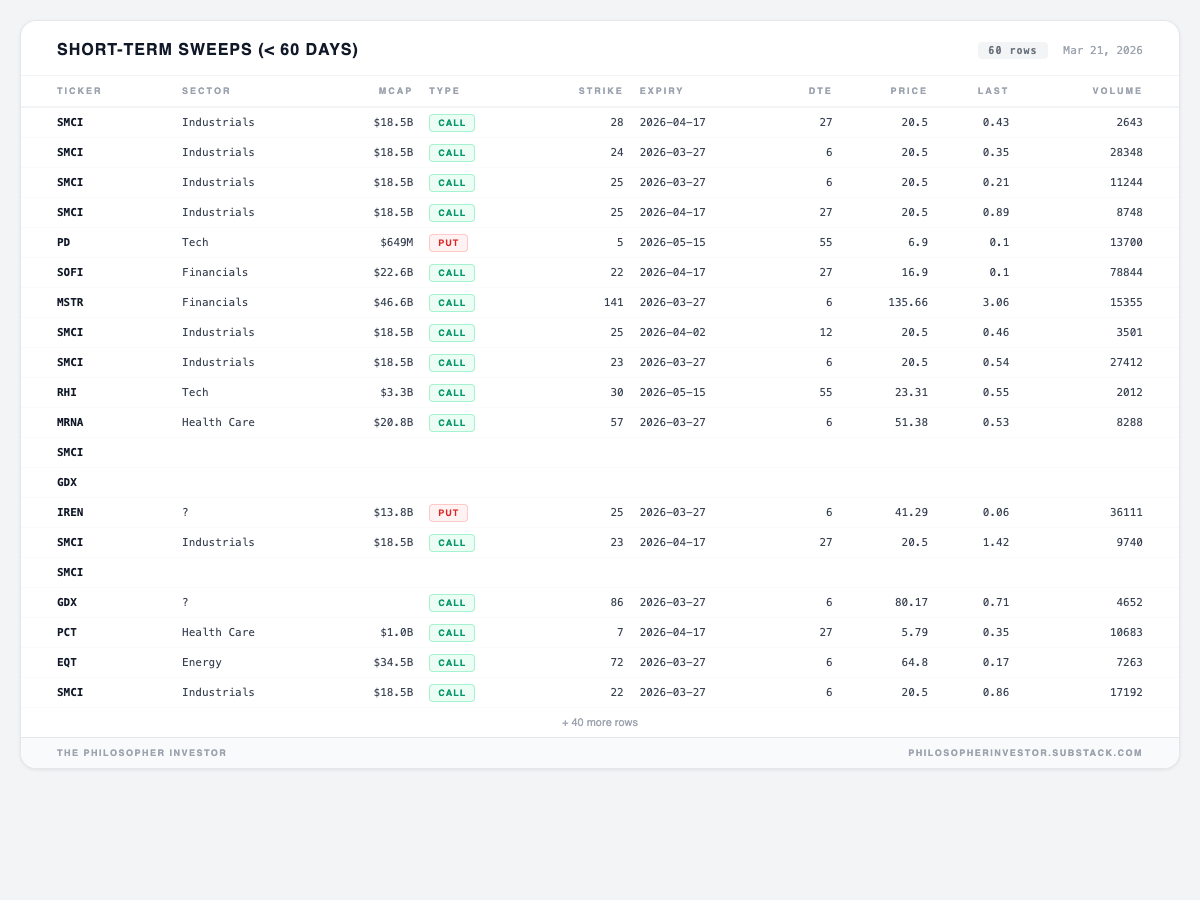
I track large, aggressive options trades called “sweeps.” These are orders that hit multiple exchanges at once to get filled fast. When someone sweeps, they are in a hurry. They know something, or they think they do. 60 sweeps this week.
One name dominates everything: SMCI. Super Micro Computer shows up over and over in the data. Multiple large call sweeps at strikes $22-28, expiring in the next month. The stock is at $20.50. These are out-of-the-money bets that SMCI bounces hard and fast. The volume is massive, up to 28,348 contracts on a single sweep. Someone is very convicted on this name.
The other bullish bets tell a story. SOFI calls with 78,844 contracts at the $22 strike while the stock sits at $16.90. That is a 30% out-of-the-money bet. MSTR calls at $141 on a stock trading at $135. EQT calls at $72 on a stock at $64.80, which is the energy/Hormuz trade showing up in options flow. GDX calls at $86 on gold miners, even after gold dropped -4% this week. MRNA calls. The sweep buyers are betting on a bounce across multiple sectors.
Almost no bearish bets. Only two put sweeps in the entire list: PD (PagerDuty) and IREN. That is it. Out of 60 sweeps, almost all are calls. When the market is at breadth 14 and everyone in options is buying calls, it means one of two things. Either the smart money sees a snap-back coming, or the dip-buyers are going to get run over. Given the PCR data showing retail long calls and institutions long puts, I lean toward caution.
🔥 Trade of the Week: AMD
The AI chip giant just hit a level it has defended for over a year. My screener is screaming.
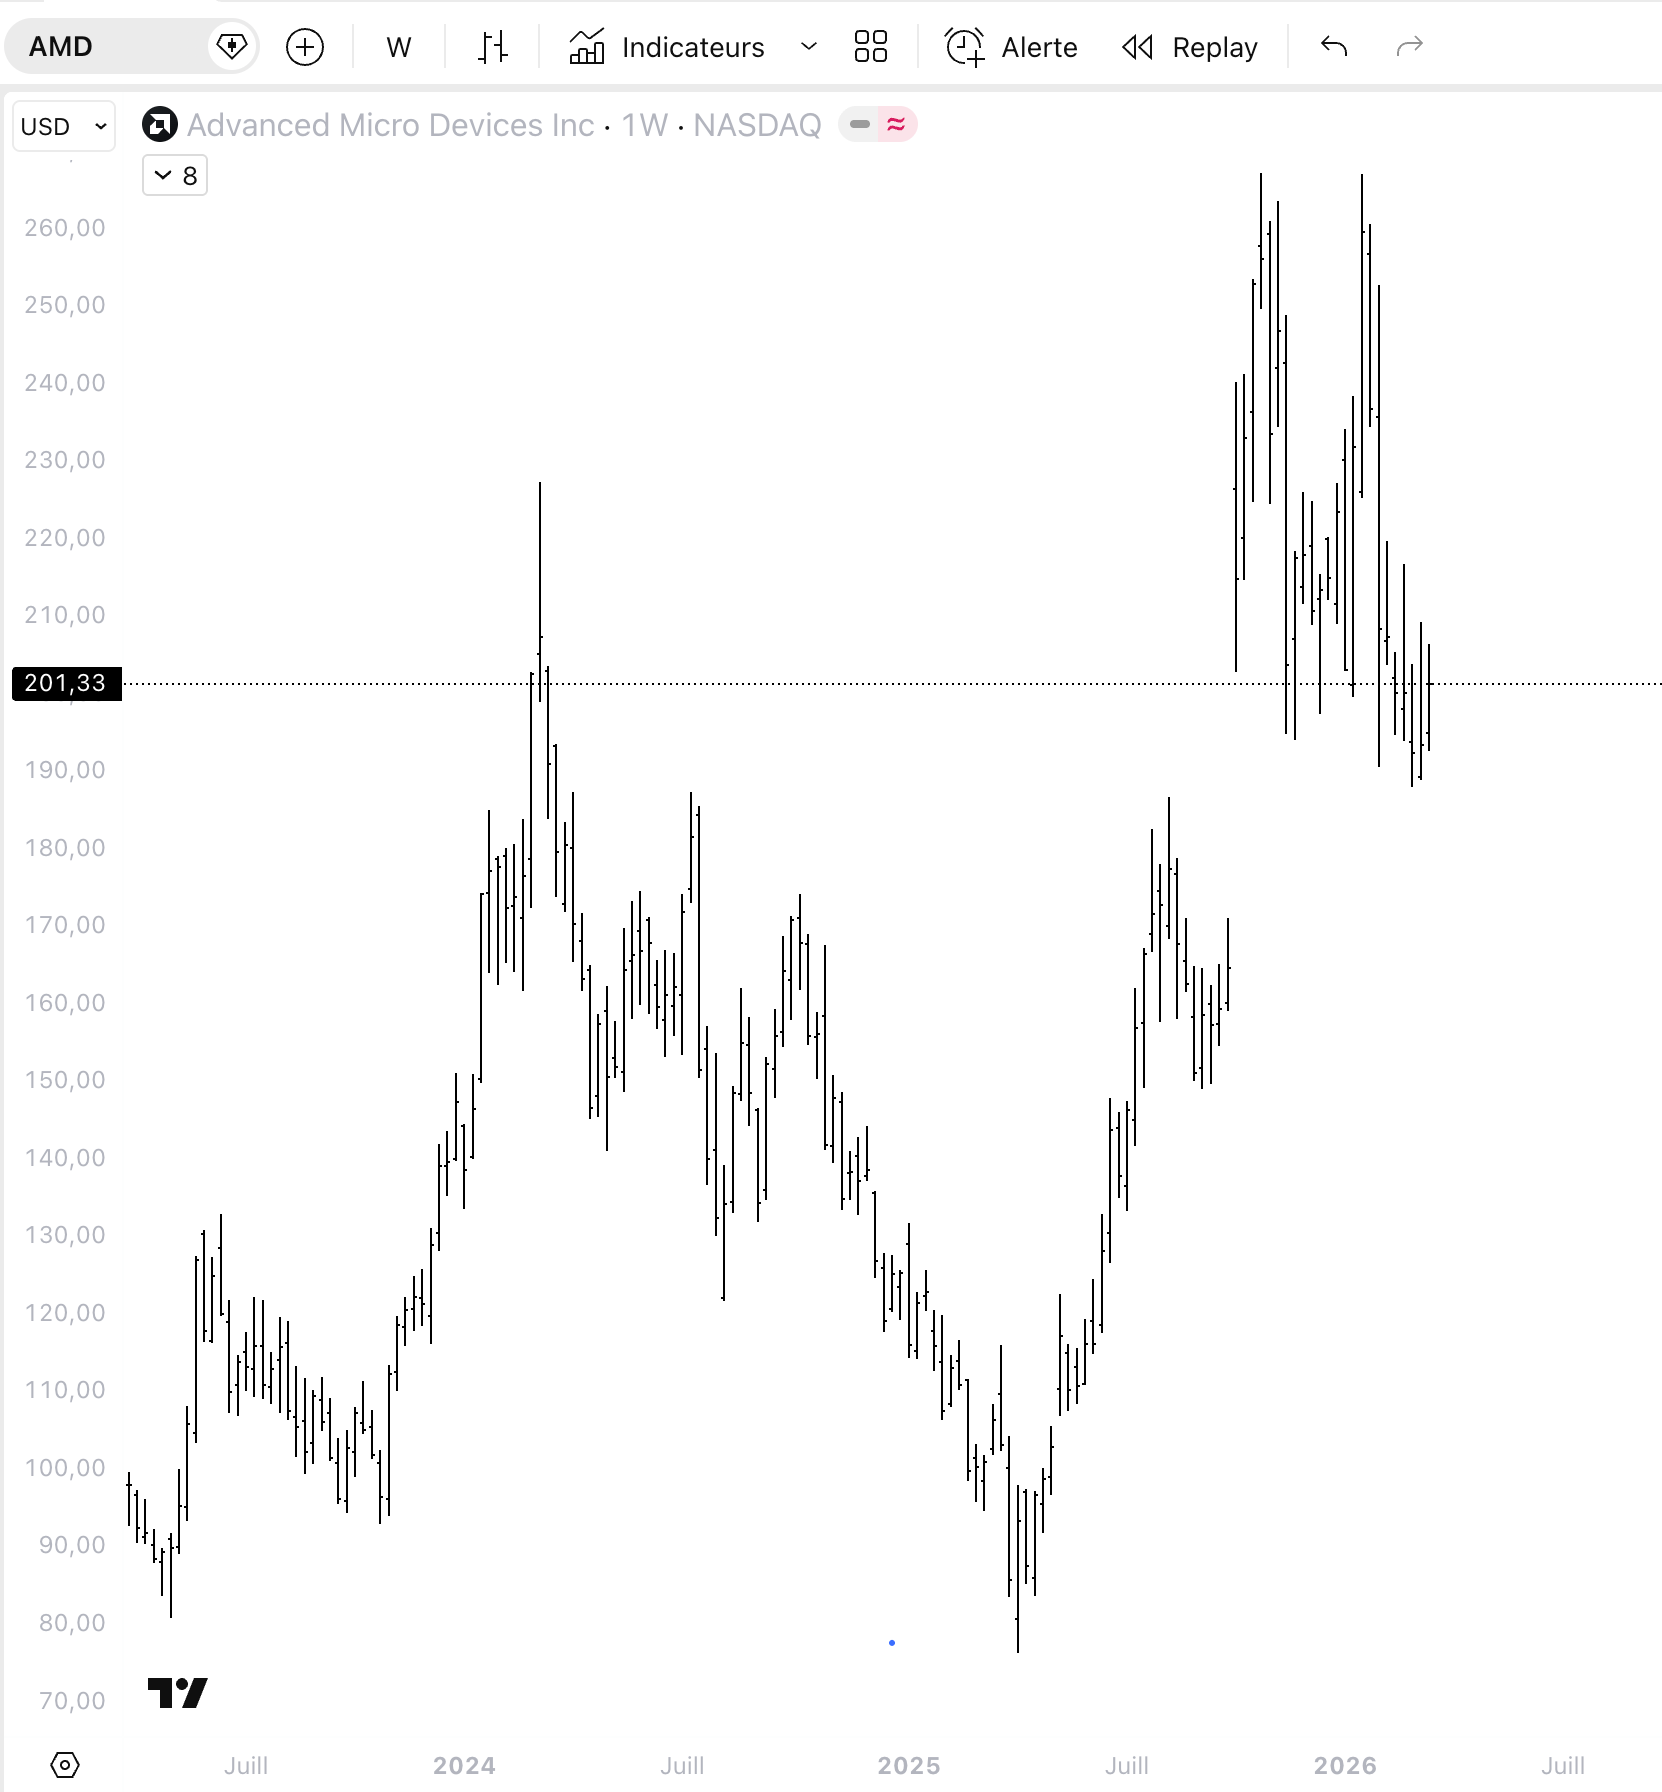
Advanced Micro Devices. You know the name. GPUs, data center chips, the number two player behind Nvidia in the AI infrastructure race. Revenue growing, market share expanding, and the stock has been punished for it. After running from $80 in early 2025 to $260 by late 2025, AMD has given back nearly half that move. Now trading around $201, right on top of a horizontal level at $201 that has acted as both support and resistance going back to 2024.
Why AMD, why now. My bottom fishing screener has flagged AMD 9 times in the last 15 days. That kind of persistence. the same stock triggering the same signal over and over. is the strongest version of the setup. It means the stock keeps getting hit, keeps getting oversold, and keeps bouncing off the same zone. The market is testing this level repeatedly and it is holding.
The chart. Look at the weekly. That dotted horizontal at $201 is the level that matters. It was resistance in 2024. AMD broke above it, ran to $260, and now it is pulling back to retest it as support. This is one of the cleanest support retests I have seen in months. The weekly candles show the stock finding buyers every time it touches this zone.
My screener data shows that the BOTTOM signal performs best when VIX is elevated and breadth is weak. exactly the conditions we have right now.
Entry: $195 to $205 (current zone, on or near the $201 horizontal support)
Stop Loss: Below $185. If the stock closes below this level on a weekly basis, the $201 support has failed and the next floor is much lower
Target 1: $230 (+15%). The zone where selling accelerated on the way down, first resistance
Target 2: $250-260 (+25-30%). Return to the highs if the AI narrative re-engages
Position sizing: breadth at 14 and VIX at 27 means this is not the environment for large positions. 2-3% of portfolio max. The setup is high conviction but the market backdrop is hostile. Size accordingly.
🎯 Portfolio Performance
I share entry levels, stops, and targets. Position sizes are yours to decide based on your own risk tolerance.
What happened this week:
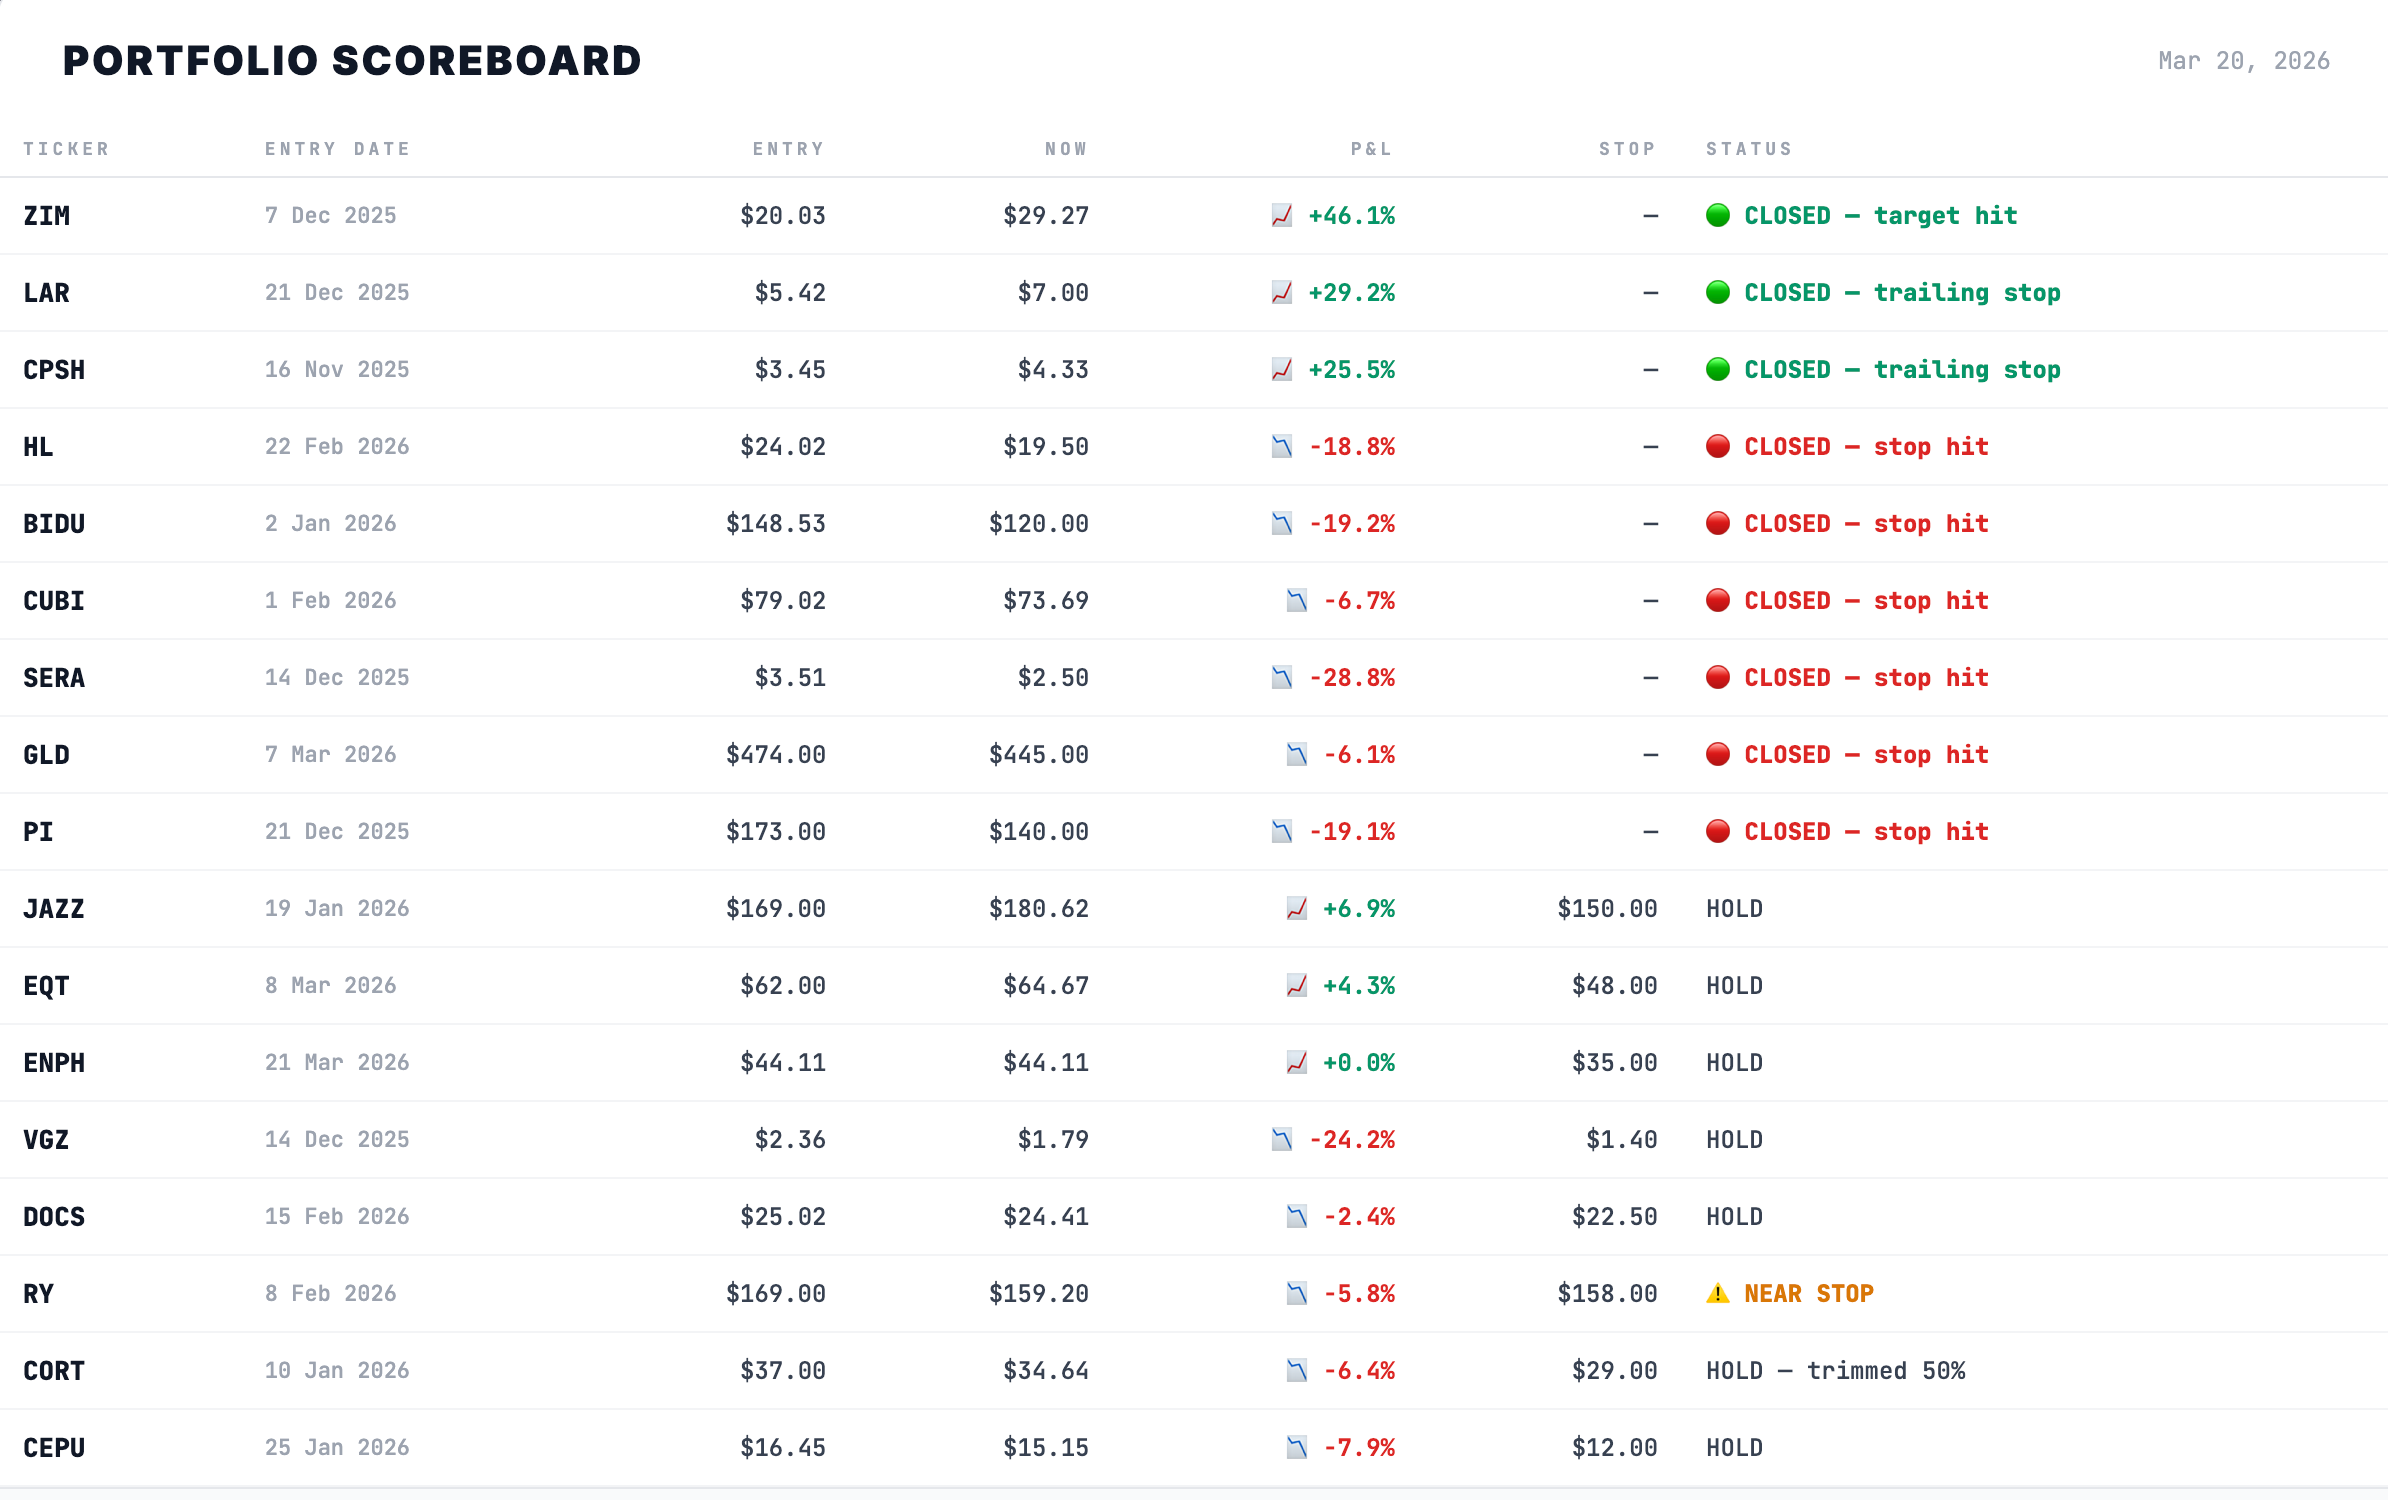
HL hit its stop. Entry at $24.02, stopped out at $19.50 for a -18.8% loss. The original write-up flagged $19-20 as the zone where the thesis breaks. It broke. We took the loss and moved on. That is the discipline.
GLD is stopped out. Entry at $474, stop at $445, closed Friday at $413.38. That is $32 below the stop. No ambiguity. The gold selloff this week was brutal and the stop did its job. Loss of -12.8%. The thesis on gold is not dead, but this trade is. If gold stabilizes and sets up again, we will re-enter with fresh levels.
RY (Royal Bank of Canada) sitting $1.20 above its stop at $158. Financials are the worst sector on the board at 12.85% breadth. If it closes below $158 next week, we are out.
The bright side: JAZZ at +6.9% and EQT at +4.3% are green in a market where almost nothing is green. EQT is the Hormuz play. Largest US natural gas producer. If the energy trade continues, this one has room to run.
Positions are updated weekly in this scoreboard. I manage my own portfolio more actively than once a week, but the newsletter format limits how fast I can communicate changes. A real-time alert system for paid subscribers is something I am actively working on for the near future.
What are you watching this week? Reply to this email. I read every one.
See you next week.
Disclaimer
This newsletter is for educational and informational purposes only. It is not financial advice.
The content reflects personal opinions shared publicly as a journal. Trading stocks, options, futures, or any financial instrument involves significant risk. You can lose your entire investment. There is no guarantee of profit.
The author is not a registered investment advisor, broker, or financial professional with any regulatory authority including the SEC or CFTC. Always consult a licensed financial advisor before making any investment decisions.
By reading this newsletter, you accept full responsibility for your own trading and investment choices. Past performance does not guarantee future results. Markets are unpredictable.
Screenshots are courtesy of TradingView, VixCentral, and other platforms with which the author has no affiliation. Information shared may contain errors or become outdated quickly.
This content is the intellectual property of the author. Copying or redistributing without permission is prohibited.
By continuing to read, you acknowledge and accept these terms.
Read the desk every week
Market analysis in plain English, plus the app that scans the whole US market for you.
Become a member Read the original on Substack ↗