A Flush, a Rotation, and One Currency Pair to Watch.
Market Recap — June 7th 2026
2026-06-07 · 17 min read · Originally published on Substack ↗


Hello my friends,
By the time you read this, your feed is a wall of the same word, and that word is “top.”
Friday gave everyone the headline they have been waiting all year to write. The Nasdaq fell 4.2%, its worst single day in over a year, and roughly $1 trillion evaporated off the semiconductor and AI complex in a few hours. The S&P 500 dropped 2.6% and booked its first down week in ten, after a run that had carried it to fresh records earlier in the week.
So the story writes itself. The melt-up cracked, the leaders broke, the bell rang at the top, and the smart move is to sell everything and hide. Half the Substacks you follow published some version of that thesis before the closing bell.
My conclusion is simpler, and it cuts the other way. Friday was not a market-wide rejection of risk. It was a forced repricing of the most crowded, longest-duration equity trade on the board. If breadth breaks next week, I will change my mind. But as of Friday’s close, the market did not confirm the panic.
I owe you some context, because I have spent the better part of two months telling you the top was near. I was the most defensive I had been all year. I still think the risks I flagged were real. But the top I described, breadth collapsing while the index holds, leadership stumbling, bonds catching a safety bid, is a specific configuration, and what happened Friday was the opposite of that configuration. The concentration I warned about for weeks started unwinding on its own. That changes the calculus, and the discipline is to follow the data even when it leads away from where I have been parked.
The index is one number. It is a cap-weighted average dominated by a handful of enormous names, and when those specific names get hit, the index drops hard even if the broader field holds up far better. Friday, the damage was concentrated in the crowded mega-cap and AI names that every fast-money desk and every retail account already owned to the gills.
This was a flush, not a top. A top takes weeks to build. Breadth decays while the headline holds up, and by the time the index gives way the damage underneath is already done. What we got Friday was the inverse: the price led and the breadth refused to follow.
To get the most out of these market recaps and understand the framework behind my observations, I encourage you to read about my methodology here.
📊 Market Health
The bull-versus-bear argument for this weekend lives in the difference between two numbers almost nobody is putting side by side: the index return and the median stock’s return.
The index vs. the market
The S&P 500 fell 2.6% on Friday and the Nasdaq fell 4.2%. Big, scary, attention-grabbing prints, and they are real. But an index is a weighted average, and the S&P in 2026 is more top-heavy than it has been in modern history.
When a handful of trillion-dollar names get sold, the index drops hard regardless of what the other 480-odd companies are doing. So the index return tells you what happened to the giants. For what happened to the market, you look underneath.
Three readings that tell you what the average stock did
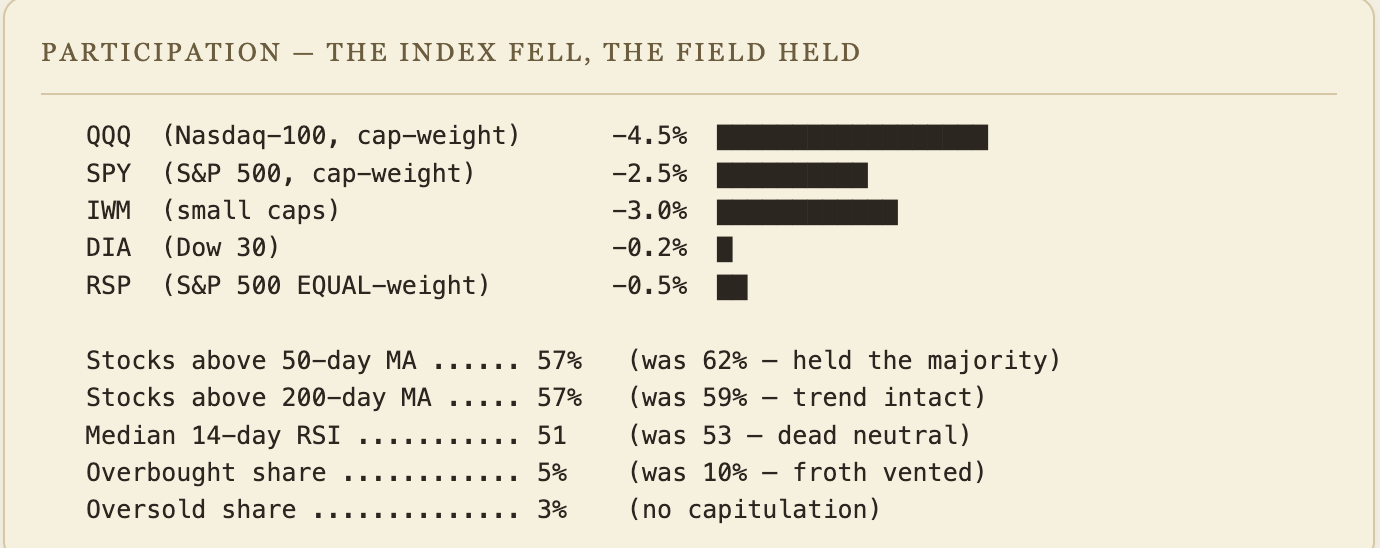
My screener tracks the broad market rather than the index. Three numbers, and all three say the same thing: the average stock barely participated in Friday’s selloff.
Median RSI: 51, down from 53. RSI measures momentum on a scale of 0 to 100. Above 70 is overbought, below 30 is oversold, 50 is neutral. The median stock slipped from 53 to 51 on the week. The index fell 2.6%. The typical stock barely budged.
Stocks above the 50-day moving average: 57%, down from 62%. The 50-day line separates stocks in an uptrend from stocks in a downtrend. The share slipped from 62% to 57%, a modest decline but still a clear majority holding its intermediate uptrend.
Overbought share: cut from 10% to 5%. Going into the week, about 10% of stocks were overheated (RSI above 70). By Friday, that number had dropped to 5%. The stretched, over-loved names got pulled back toward neutral. The rest of the market did not get dragged down with them.
The excess came off the top. The broad market underneath stayed intact.
Why this is a flush
A real top builds over weeks of quiet internal decay. Breadth diverges from price for a month or two before the index gives way. What we got Friday is the inverse. The index cracked in a single session and the broad market held up far better than the headline.
Top vs. flush: how to tell them apart
This is the whole distinction in one frame. Print it and keep it.
REAL TOP                          POSITIONING FLUSH
-----------------------------------------------------------------
 Breadth deteriorates BEFORE price | Price falls BEFORE breadth
 Bonds RALLY on growth fear        | Bonds FALL on rate shock
 Weakness spreads sector by sector | Weakness stays concentrated
 Median stock breaks down          | Median stock holds
 Vol grinds higher for weeks       | Front-end vol spikes first
-----------------------------------------------------------------
 So far, most of the boxes on the right are what we got this week.
=================================================================
The honest caveat
The broad market holding this week does not guarantee it holds next week. Breadth is a snapshot, not a promise.
If Monday and Tuesday bring a second leg where that 57% above the 50-day drops toward 45% and the median RSI finally caves, then I am wrong and this was the first crack of a real top. I will be watching the breadth every session. The breadth gets the final vote.
📉 Volatility
If Market Health tells you what the market did, volatility tells you how it felt while doing it. Friday’s move fits the flush read: fear spiked hard and fast, in the pattern of a positioning shock that burns hot and fades, rather than the slow grinding fear that compounds.
The VIX spike
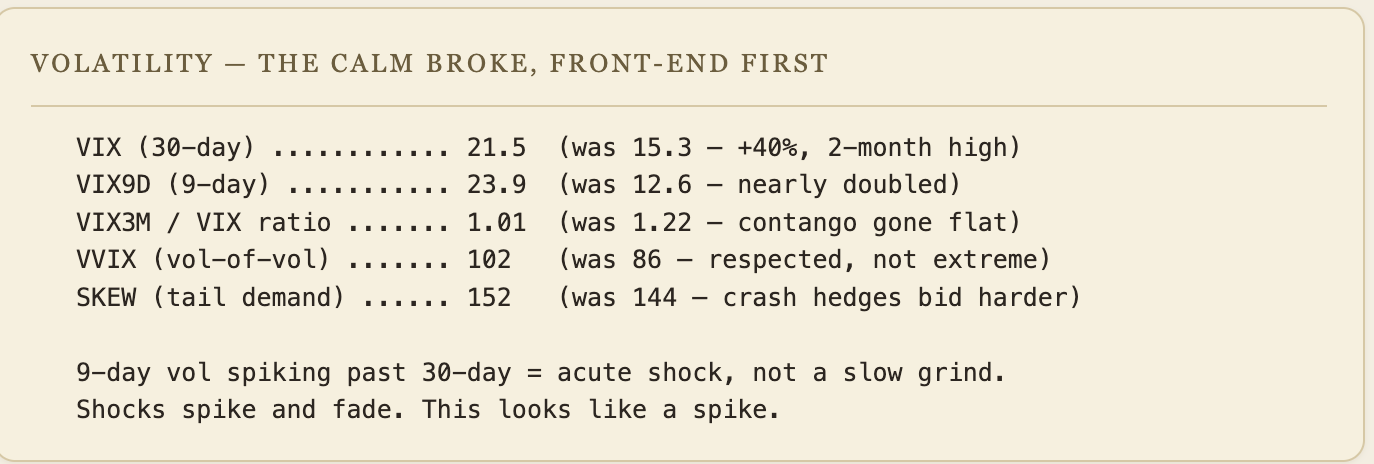
VIX: 15.3 → 21.5, up 40%. The VIX measures how much fear the market is pricing over the next 30 days. A 40% jump in one week is a two-month high. On its own, that sounds alarming.
VIX9D: 12.6 → 23.9, nearly doubled. VIX9D measures the same thing but over the next 9 days only. It nearly doubled in a single session. When the 9-day fear gauge spikes past the 30-day gauge, it means the panic is concentrated in the very short term: traders scrambling to buy protection for the next few days, not for the next few months.
That is the fingerprint of a one-off shock, not the start of a sustained decline. A sustained decline builds fear slowly across all timeframes. A shock spikes the nearest timeframe and fades. Friday looked like a shock: one jobs report, one scramble for short-term protection.
The complacency ratio
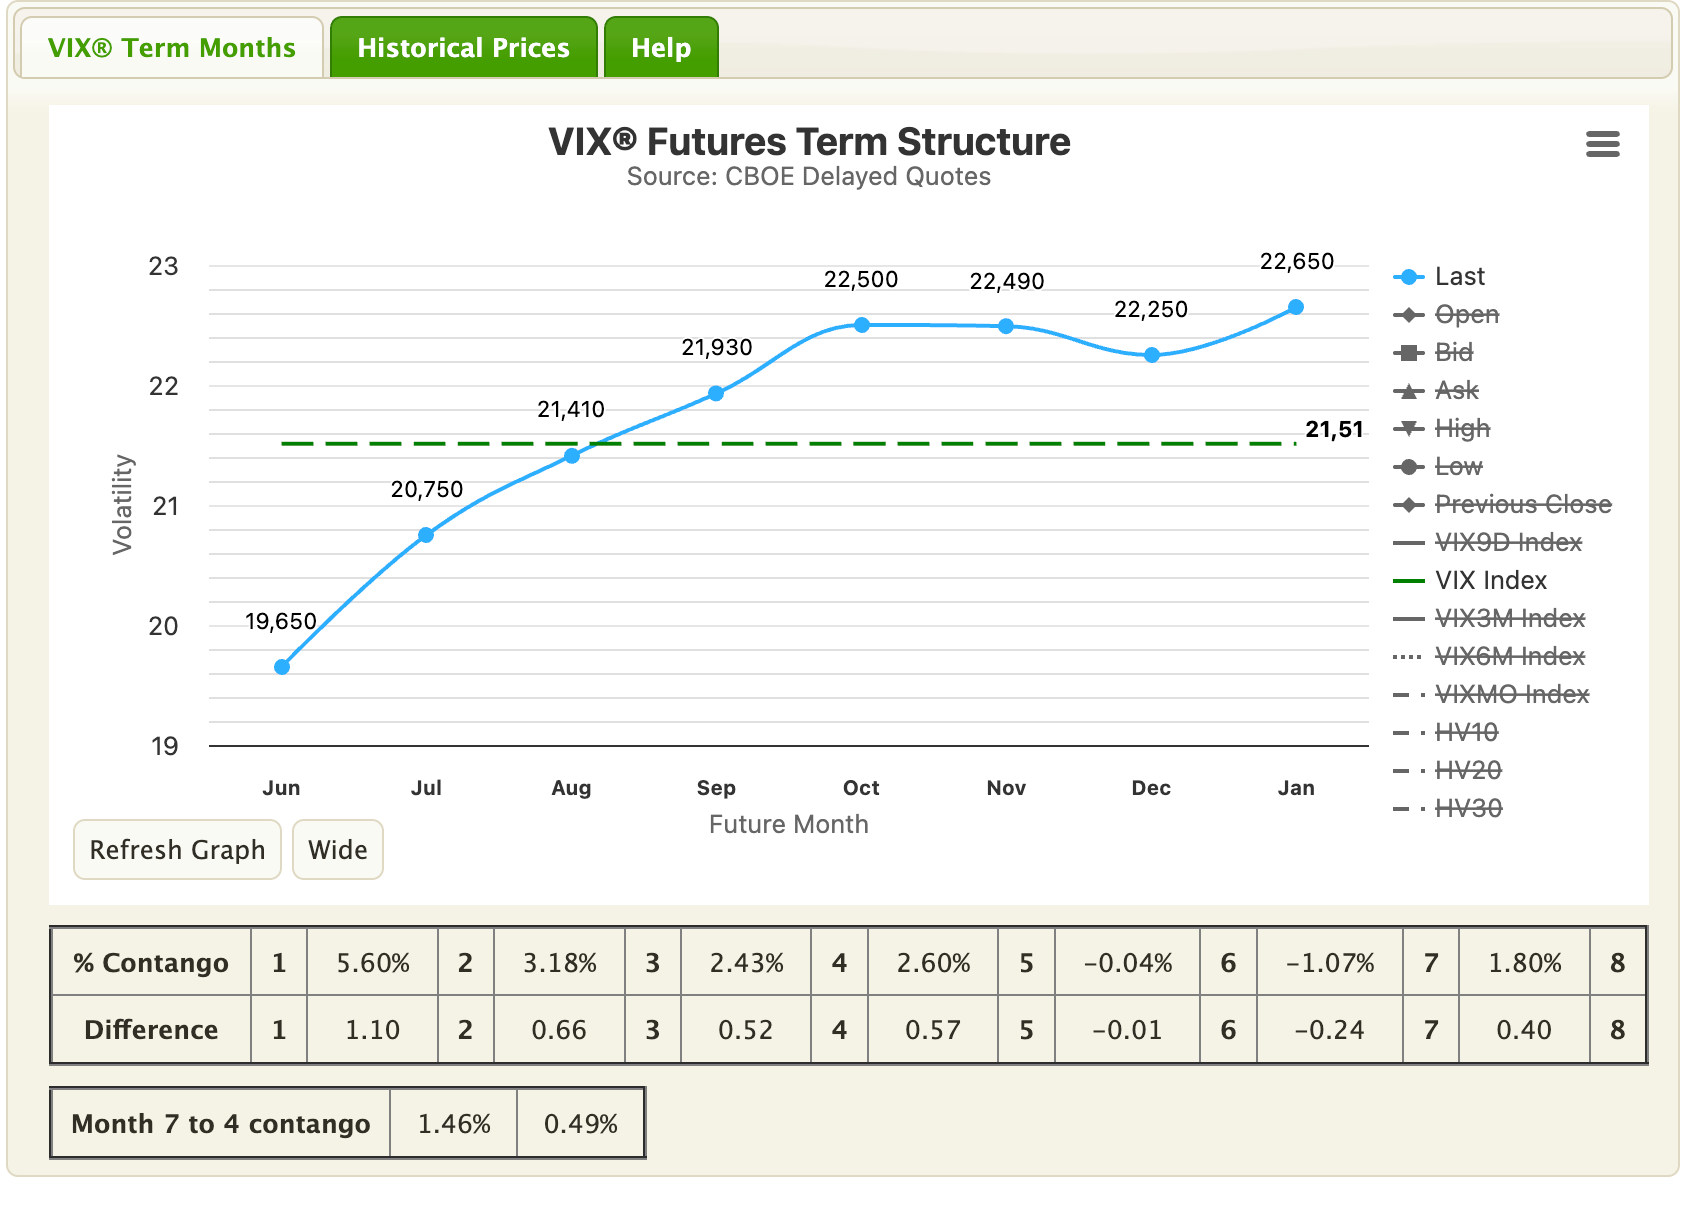
I track VIX3M divided by VIX. It compares how much fear the market prices 3 months out versus 1 month out. When the ratio is high, the market feels safe today but expects trouble later. When it collapses toward 1 or below, fear has arrived in the present.
Two levels matter. Above 1.30, the market is at peak complacency: calm today, no urgency, tops tend to form here. Below 0.85, the market is in outright panic: near-term fear has overtaken everything, and bottoms tend to form here.
Going into the week the ratio sat at 1.22, grinding toward the 1.30 complacency ceiling I have been tracking for weeks. By Friday it had collapsed to 1.01. The calm evaporated in one session.
That collapse from 1.22 to 1.01 is the signature of a sudden shock. It tends to reverse as the scare passes and the ratio climbs back up. If it rebuilds above 1.10 next week, the market is digesting the shock. If it stays flat near 1.0 or drops below, the damage is wider than one session.
The rebound is the base case, as long as the broad market keeps holding.
VVIX: the yellow flag
VVIX, the volatility of volatility, went from the mid-80s to about 102. This one cuts against my read.
VVIX measures the price of convexity, what the market pays for options on volatility itself. A jump into the low 100s says the move was not dismissed, that real money reached for tail protection. I would have preferred to see it stay floored. It did not, and I give that its weight. That said, low 100s is elevated but short of extreme: a market that got a scare and bought some insurance.
SKEW: the bid that grew
SKEW measures the price of out-of-the-money put protection, the cost of crash insurance. It rose from 144 to 152 through the week. Crash-insurance demand did not fade into the selloff. It grew.
SKEW has been bid for weeks, high before Friday while the surface was dead calm and the VIX slept at 15.3. Last week, in “The Top Got Postponed,” I told you the surface was calm while the tail was quietly bid. That fragility got expressed Friday, and the tail bid climbed rather than cooled.
This is the one piece that leans cautious. The surface calmed nowhere, and the demand for downside protection rose into the weekend. I am not dismissing it.
🔍 Pairs Alignment
The cleanest way to read whether the damage was concentrated or broad is to line up pairs and watch which one cracked. Three reads, and all three point the same way: a rates shock that hit long-duration rather than a growth scare that hit the economy.
Dow vs. Nasdaq: the value-growth split
On the week, the Dow fell 0.2%. The Nasdaq fell 4.7%.
The Dow is full of profitable, lower-multiple, old-economy names. It barely moved. The Nasdaq is the long-duration growth and AI complex, and it took nearly all the damage.
The same week the headline declared a collapse, the value end of the market sat almost perfectly still.
That is the signature of a rotation out of expensive duration rather than a market-wide flight from stocks.
Cap-weight vs. equal-weight: the concentration read
The cap-weighted S&P fell 2.5% on the week. The equal-weight version fell 0.5%. On Friday alone it was 1.4% for equal-weight against 2.6% for the cap-weighted index.
Strip out the giants, weight every company the same, and the damage nearly disappears. The mega-cap names that dominate the cap-weighted index led the decline, and the broad field behind them barely participated.
For months I have written about the extreme concentration in this market, the whole index leaning on a handful of names. This week the leaders came back toward the pack rather than the pack falling to the leaders. The healthiest version of a pullback.
Small caps: the rate-sensitivity tell
This pair moved against me. The Russell 2000 fell 3.5% on Friday and 3.0% on the week. Small caps did not hold.
But look at why they fell. Small caps are the most rate-sensitive corner of the equity market, the most dependent on cheap financing. A jobs report that kills the rate-cut story and pushes yields higher hits them first and hardest. Their weakness does not automatically make this a growth scare. With yields rising at the same time, the cleaner read is that small caps were hit by the same higher-rate impulse that hit long bonds and mega-cap growth.
Duration got repriced, not the economy.
Stocks vs. bonds: the confirmation
When stocks fall on a growth scare, money flees into Treasuries. Bonds rally, yields fall, the classic risk-off rotation. That is what a real top produces.
This week the opposite happened. Stocks fell and bonds fell with them. The 10-year yield rose 9 basis points to 4.54%. Bonds did not catch a safety bid. They sold off alongside equities.
Stocks and bonds falling together is the sign of a rates-and-positioning shock rather than a recession. And a rates shock that leaves the broad economy intact is the kind of dip I want to buy.
🚨 Sector Rotation
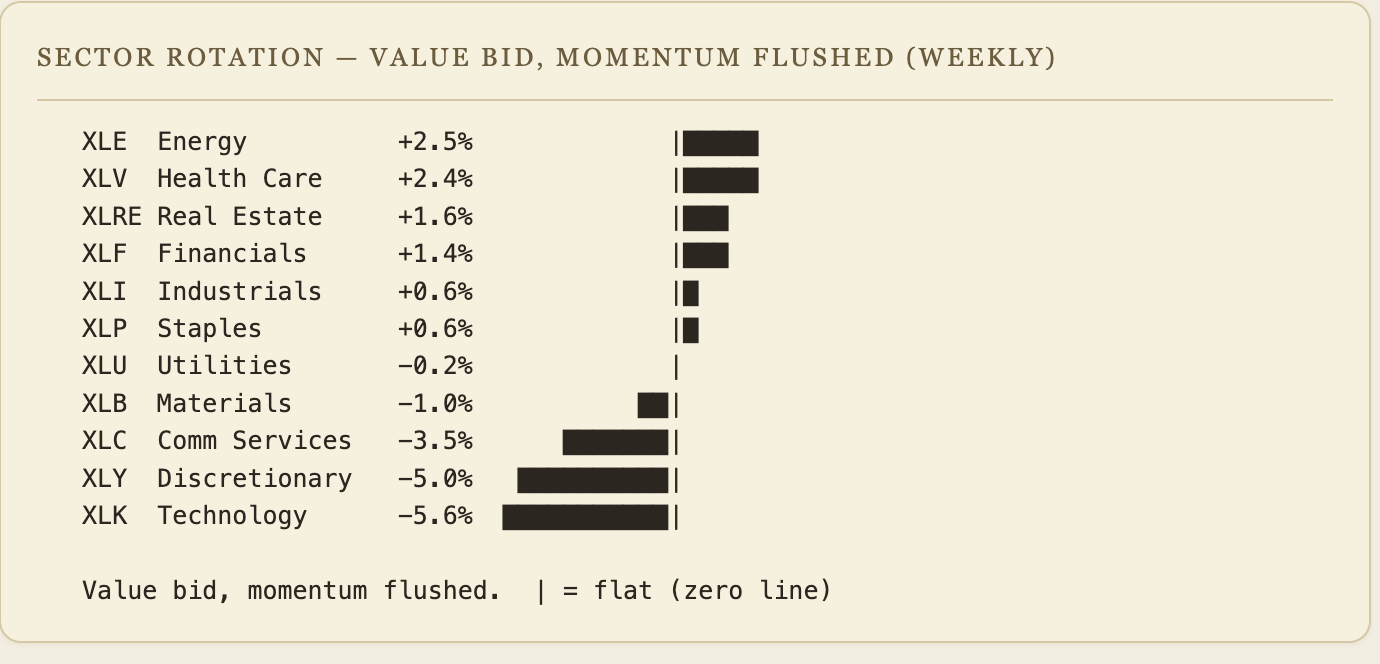
To know whether investors were fleeing the market or shopping within it, watch where the money went rather than where it left. This week it rotated with a clear, deliberate logic.
Where money went
On my weekly sector-ETF dashboard, Energy rose 2.5%. Health Care rose 2.4%. Financials rose 1.4%. Industrials rose 0.6%, and even Staples added 0.6%.
Those are not defensive bunkers where terrified money hides. Energy, Financials, and Industrials are economically sensitive, real-economy sectors. They are also, with Health Care, the cheap, profitable, rate-insensitive corners that get left behind in a melt-up and rediscovered when the froth comes off the leaders.
Money flowed in. Investors shopping the unloved aisles rather than fleeing the store.
A true market-wide liquidation usually leaves fewer places to hide. You would not see six sectors finish green while the index fell. The green was as broad as the red was concentrated.
Where money left
The tech sector fell 5.6% on the week, with XLK down 6.7% on Friday alone and semiconductors hit even harder, the single biggest weight behind the Nasdaq's -4.7%. Communication Services fell 3.5%. Consumer Discretionary fell 5.0%. Biotech (XBI) fell 5.9%.
The losers are the high-multiple, high-momentum, crowded growth complex. The stuff that runs hottest in a melt-up and carries the most hot money. They got flushed, and not gently.
Rotation out of expensive momentum and into reasonable value. The most normal thing a market can do after a long one-directional run.
The Discretionary-Staples flip
One more read. Consumer Discretionary underperformed Consumer Staples this week, a flip from last week’s risk-on configuration. On its own, a caution flag. But set against the Dow holding flat, energy and financials and industrials rallying, and the value end refusing to break, it reads as careful money rotating into steadier ground rather than panic flight.
💱 FX
Now the part where I stop making the bull case and tell you where I could be dead wrong.
There is one real risk to everything above, and it is not in the breadth, the vol surface, or the sectors.
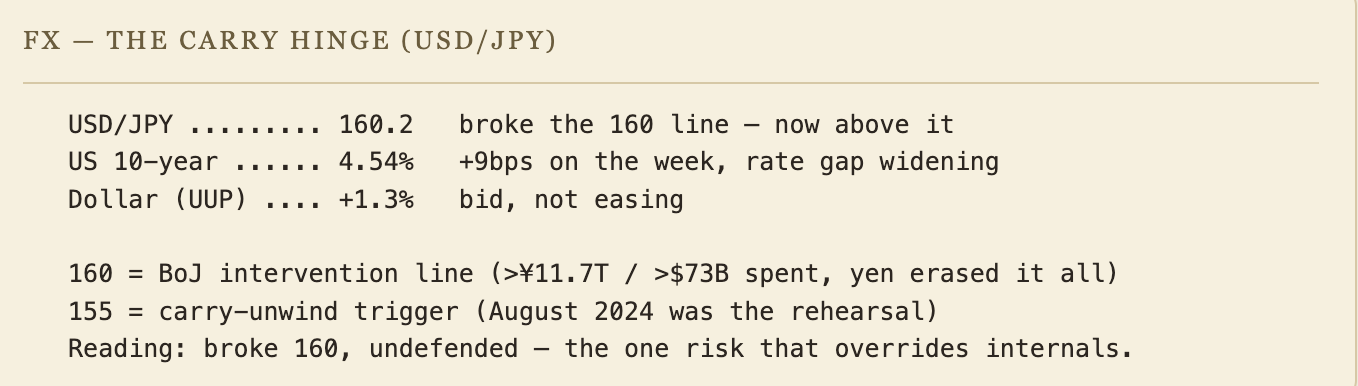
It is the yen. USDJPY closed Friday at 160.2. It broke 160.
Why 160 matters
The 160 level on dollar-yen is not arbitrary. It is the line where the Bank of Japan and the Ministry of Finance have historically stepped in to defend the yen, because a yen that falls too far too fast destabilizes Japan and ripples through global funding markets.
And they defended it. Between late April and late May, Japan spent over ¥11.7 trillion, more than $73 billion, its first intervention since 2024. The yen has erased all of it. The same hot jobs print that hammered stocks widened the US-Japan rate gap and pulled the yen weaker, straight through the line that $73 billion was spent defending.
The market ran the dollar back through 160 in the face of the largest intervention in two years.
The carry mechanism
The yen carry trade is one of the largest funding engines in global markets. Money borrows yen at near-zero cost and buys higher-yielding assets worldwide, including US tech. As long as the yen drifts weaker or holds steady, the trade prints and the borrowed yen keeps flowing into risk.
But the carry trade is short the yen, and a short blows up when the thing you are short rallies. The danger is not a weaker yen. It is a violent snap-back the other way. If USDJPY breaks back under 155, the carry unwind turns live: borrowed positioning gets forced to cover all at once, selling global assets to buy back yen in a self-reinforcing cascade.
We have seen the rehearsal. August 2024, when a modest BoJ hike triggered a violent global unwind in a matter of days. That was off a far smaller spark than the pressure building now.
How I hold both ideas at once
The constructive read on the flush and the fear of the carry hinge. I hold them by sizing.
If the yen sat calmly at 150 with no intervention drama, I would be far more aggressive, because the internal evidence is that good. But it is at 160.2, on a broken line that $73 billion could not hold, with a live path to a carry unwind if it snaps back. That single fact caps my conviction and my position size.
I am adding in the rate-insensitive, real-earnings parts of the market, in measured pieces, with cash held in reserve.
🧠 My Take
Let me clear up what looks like a contradiction. My read of the tape is flush, not top. But my portfolio is still positioned cautiously. Those two things are not in conflict, because they answer different questions. What happened Friday? A flush. How should I be positioned right now? Carefully, because USDJPY broke 160, and that is the one variable that can override healthy internals.
The consensus turned bearish in about four hours on Friday afternoon. That speed is the tell. When a narrative is that unanimous and that easy, my job is to check whether the evidence supports it or whether everyone is reading the same scary headline off the same index print.
This week the evidence does not support the panic. The Dow held flat and equal-weight beat cap-weight. Cheap real-earnings sectors rallied while bonds fell with stocks instead of catching a safety bid. Every one of those cuts against “this is the top.”
So I am buying the rotation, with eyes open and size controlled.
Constructive on the rotation (~45%)
The flush-not-top case, and the internal evidence supports it most directly. The rates shock gets digested over a week or two. The VIX9D spike fades, the complacency ratio re-steepens, and the rotation into cheap profitable sectors broadens the market. The concentration that has worried me all year unwinds in an orderly way, and the index grinds back toward its highs on better internals than before.
The reason this is not my majority case is the yen rather than the internals. If 160 were not broken, I would put it well above 50%.
Cautious (~55%)
Not the consensus top call. The carry-and-rates case, and it gets the larger share for one reason: USDJPY at 160.2 on a broken intervention line.
In this path the rates shock is the front edge of a sustained repricing higher. The 10-year keeps climbing, pressure on the yen builds, and something forces the snap-back under 155 that turns the carry unwind live. The borrowed money that funded years of global risk-taking gets pulled at once, and a narrow flush in the AI names broadens into the cross-asset deleveraging we saw in August 2024.
The crowd is right to be cautious and right for the wrong reason. The reason to be careful is the carry hinge.
What 45/55 means in practice: a call to participate carefully, buy the dip in the safe corners with controlled size and cash in reserve, and be ready to flip defensive fast if the yen forces the issue.
🔥 Trade of the Week: $CI (Cigna)
The business
Cigna is one of the large diversified health-insurance and pharmacy-benefit operators, a real-earnings, cash-generating machine in a sector that caught a strong defensive bid this week. It beat in April, printing $7.79 against a $7.60 estimate, and guides to better than $30 of earnings this year.
At a recent price in the high-280s that puts it under 10x forward adjusted earnings, cheap for a profitable, durable, market-leading franchise. Rate-insensitive, profitable, sane multiple, in a sector money is rotating into.
A quality business on sale.
The setup
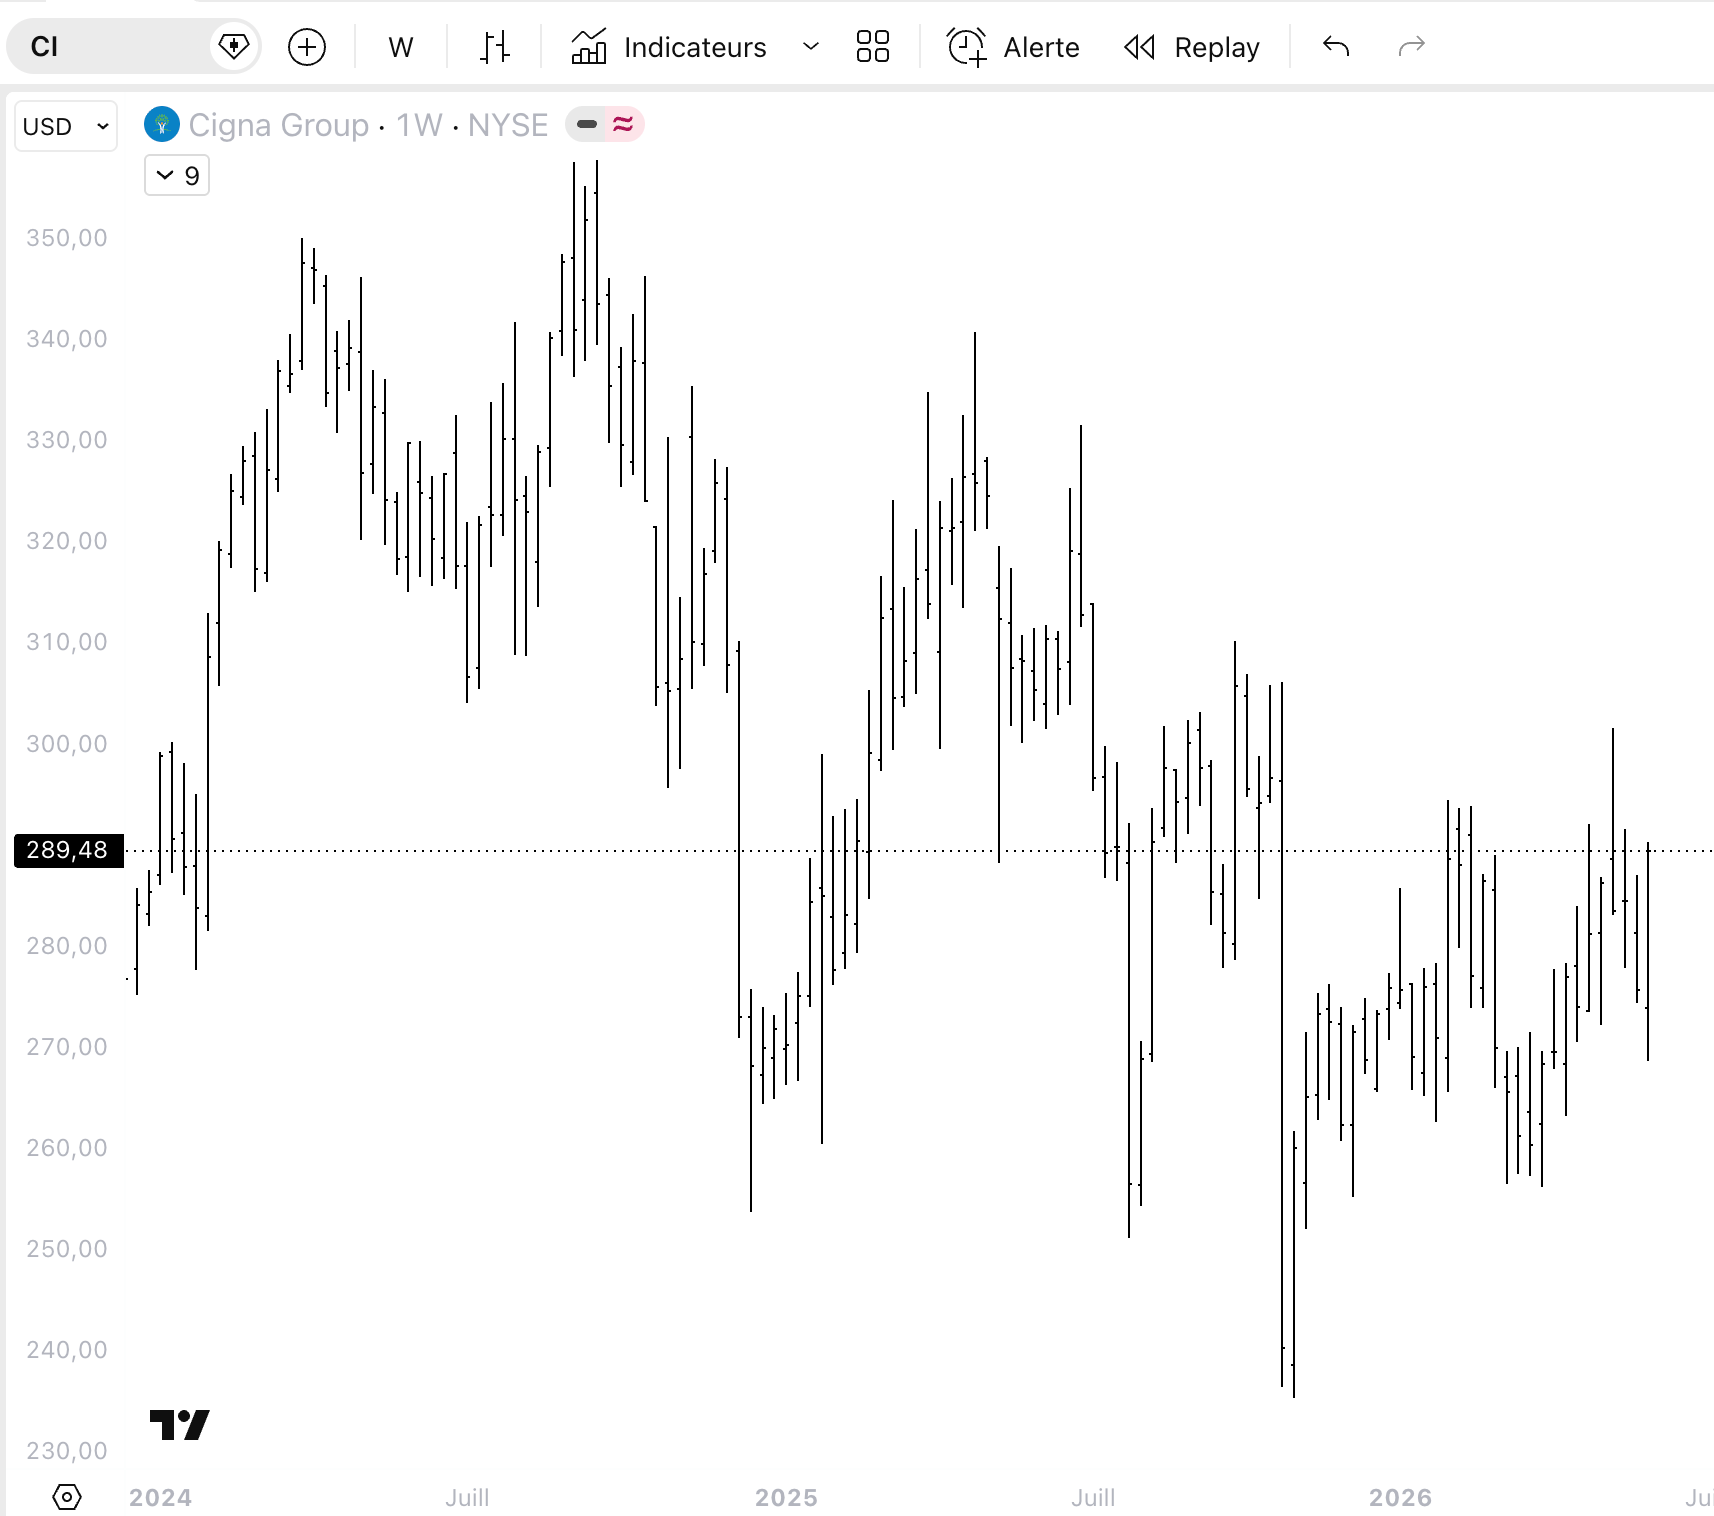
The managed-care sector had a brutal 2024-2025. The sector is now recovering hard: UNH back to $399, ELV to $415, CNC doubled off its low to $62. The recovery trade in managed care has been violent, and most of it has already happened.
CI is the one that never crashed and never bounced. It held a range for the past year while the rest of the group went through free fall and recovery. That stability is why it is now the laggard: the peers have 30-100% bounces behind them, CI has been flat.
If the sector recovery continues, CI is the name with the most room to catch up. If the recovery stalls, CI's tight range means the least downside.
The levels
Current price: $289. Stop under $268, below the base that has held on every test, about 7% of risk. First target around $310, the top of the range where sellers have appeared repeatedly. The real prize is a breakout above that range toward the $334-340 area where the stock traded in 2024, and the average analyst target sits around $345.
Risking 7% against a first move to $310 and a real objective near $334 to $345. Reward-to-risk roughly 2.5 to 1, worth taking because CI has spent a year going nowhere while its sector caught a bid. The peers have made their move. CI has all of its move ahead of it and a tight floor underneath.
Next earnings are July 30, outside the swing window, so no binary print to hold through.
The honest risk
The real risk is the regulatory overhang on pharmacy-benefit managers. The PBM business is a recurring political target, and reform headlines can hit the whole group regardless of fundamentals. That overhang is part of why the stock is cheap and part of why it lags. Barclays cut it to neutral on May 26, so the Street is not uniformly bulled up here either.
The stop under $268 is my answer. If the base breaks, I am out around 7% and I move on. I size it so being wrong costs a defined, survivable amount and being right pays multiples of that.
CELH update
Last week’s pick, CELH (Celsius). I flagged it at $33 with a base at $27 to $28. It fell back into the high-$28s this week, closing near $28, testing the lower part of that floor.
The base has not broken, but it is close to the line. $27 is the line. As long as it holds $27, the setup is intact and I am holding. If it loses $27 on a closing basis, the thesis is wrong and I step aside.
See you next week,
Daniel
Disclaimer
This newsletter is for educational and informational purposes only. It is not financial advice.
The content reflects personal opinions shared publicly as a journal. Trading stocks, options, futures, or any financial instrument involves significant risk. You can lose your entire investment. There is no guarantee of profit.
The author is not a registered investment advisor, broker, or financial professional with any regulatory authority including the SEC or CFTC. Always consult a licensed financial advisor before making any investment decisions.
By reading this newsletter, you accept full responsibility for your own trading and investment choices. Past performance does not guarantee future results. Markets are unpredictable.
Screenshots are courtesy of TradingView, VixCentral, and other platforms with which the author has no affiliation. Information shared may contain errors or become outdated quickly.
This content is the intellectual property of the author. Copying or redistributing without permission is prohibited.
By continuing to read, you acknowledge and accept these terms.
Read the desk every week
Market analysis in plain English, plus the app that scans the whole US market for you.
Become a member Read the original on Substack ↗