Breadth collapsed to 28. Only 2 sectors left standing.
Market Recap — March 15th 2026
2026-03-15 · 13 min read · Originally published on Substack ↗

TL;DR
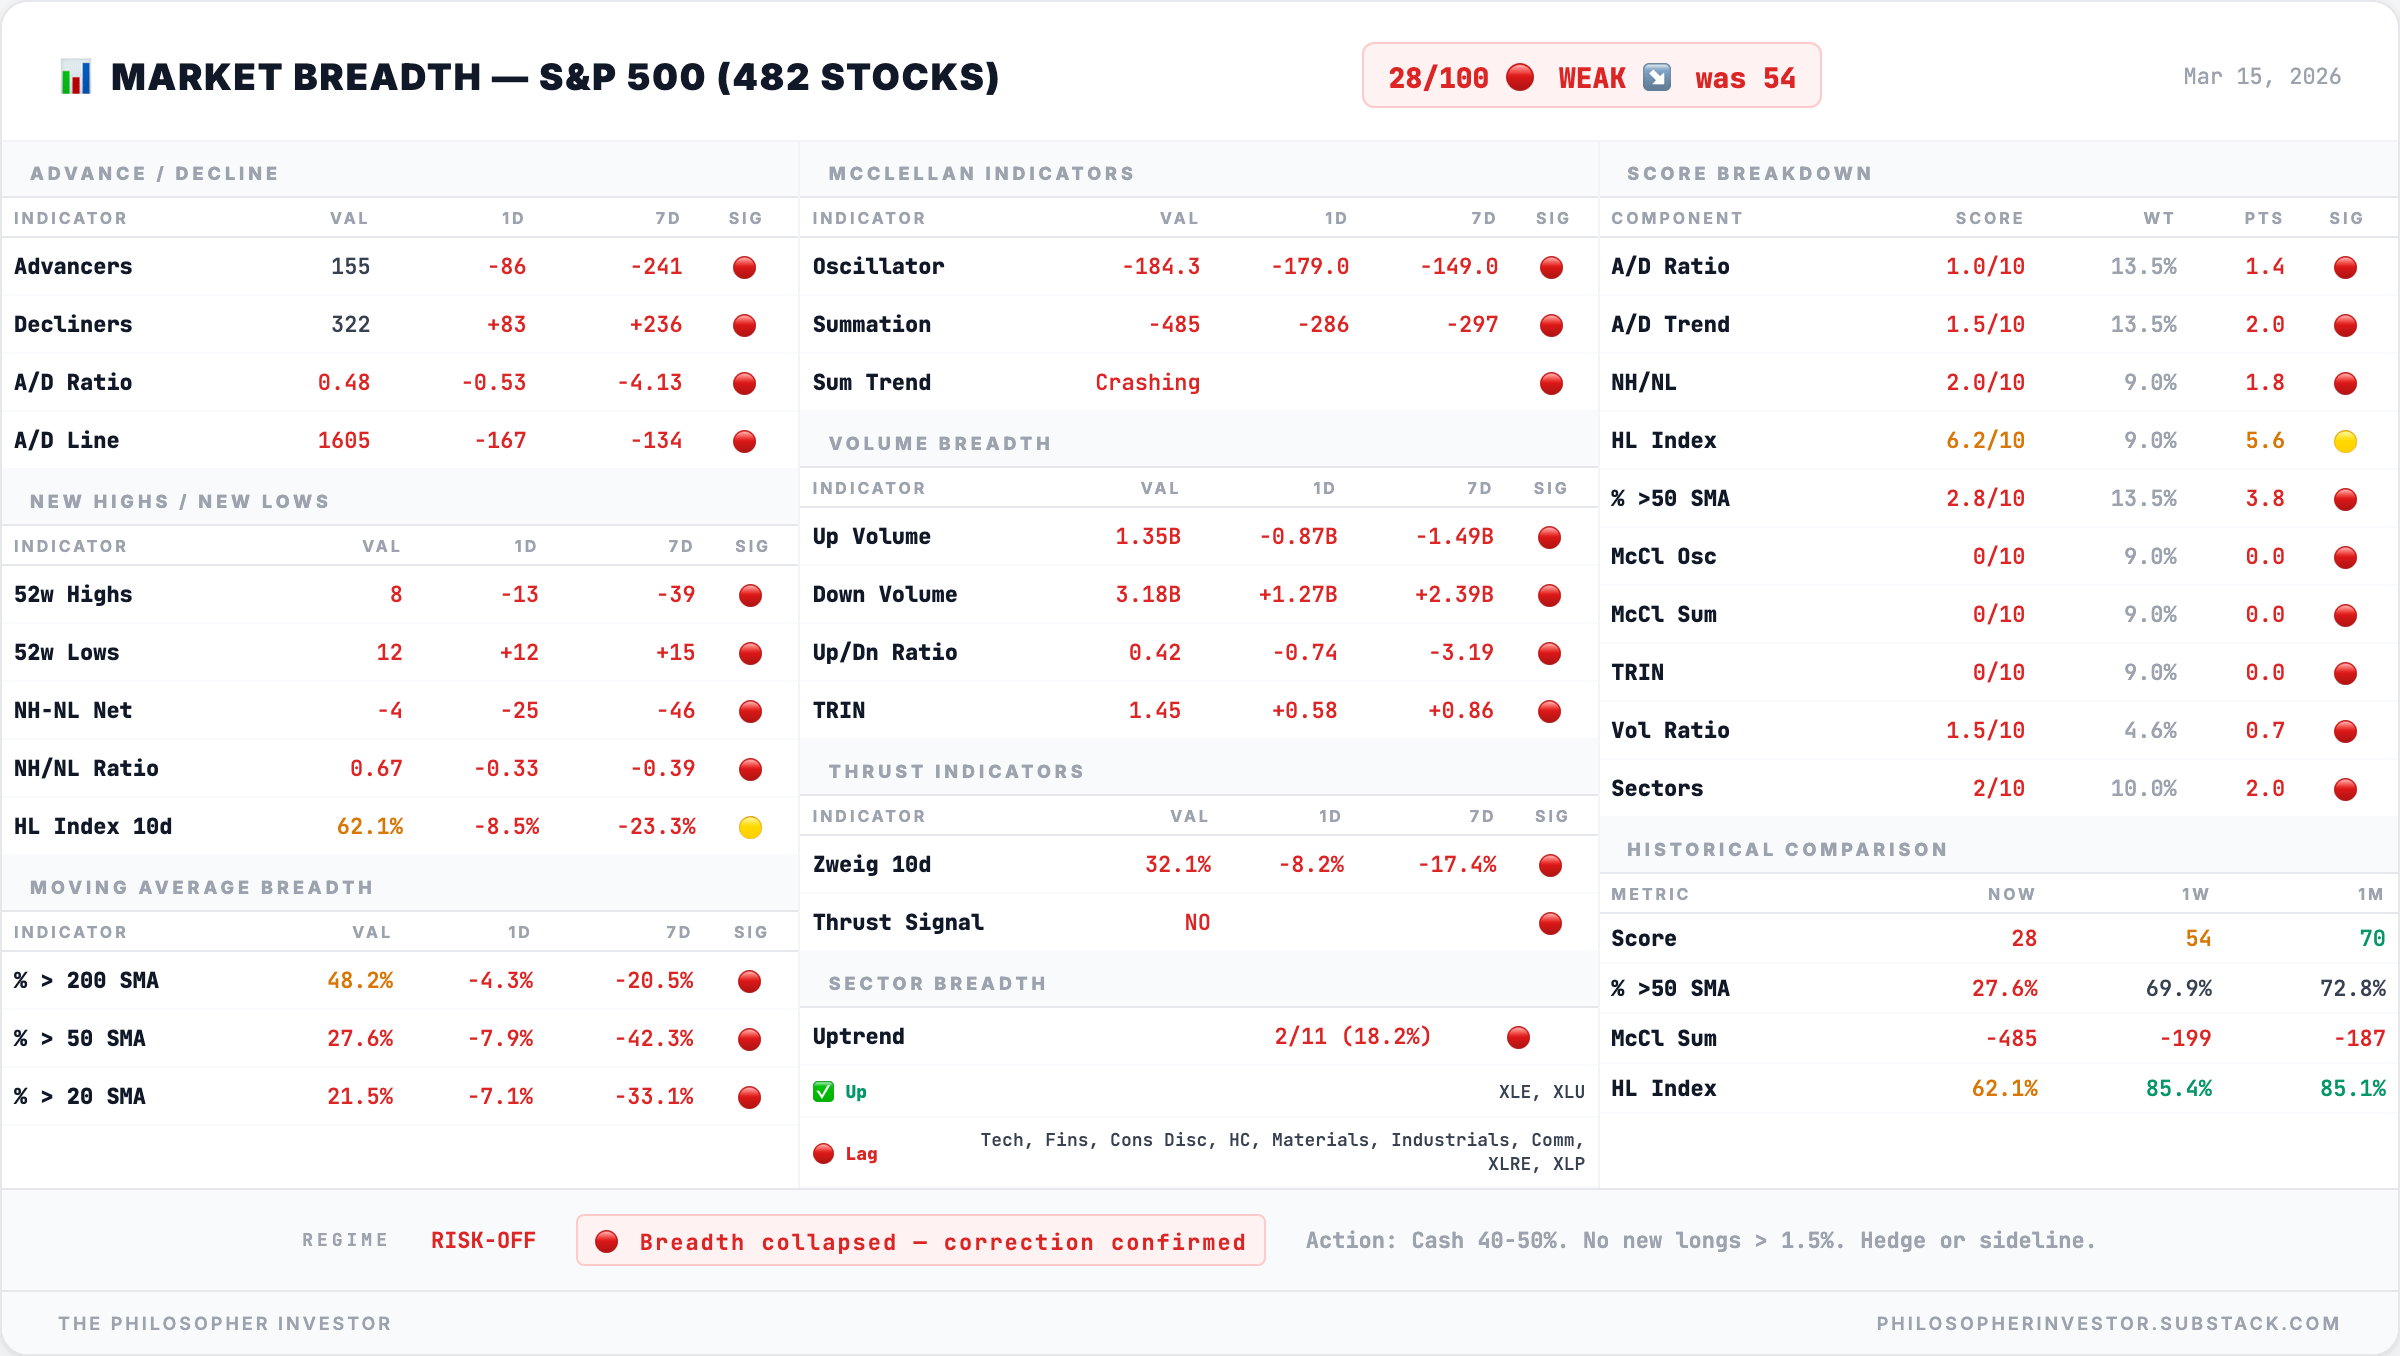
Breadth collapsed -26pts to 28/100. Only 21.5% of stocks above their 20-day SMA.
VIX 27.19, cooling from 29.49, but vol score jumped to 8/10
Trade of the Week: ENPH (Enphase Energy). Pullback score 95/100 at the 38.2% Fib. Oil at $103 makes solar more competitive with every dollar higher. Whale fund +300% position increase.

Hello my friends,
Week three of the Iran war. Israel is running critically low on ballistic missile interceptors. Oil crossed $100. And the SPR, the emergency reserve everyone is hoping for, covers 7.5% of the supply gap. Seven and a half percent. The math does not work.
Meanwhile underneath the surface, the damage is accelerating. My bottom fishing screener flagged 1,007 stocks in a single session on Wednesday. Last week that number was 15. The S&P 500 is down a few percent. The average stock is in a bear market. And my breadth score just recorded its sharpest weekly decline since the newsletter started.
Let’s break it all down.
To get the most out of these market recaps and understand the framework behind my observations, I encourage you to read about my methodology here.
Market Breadth
Breadth Score: 28/100 — 🔴 WEAK
Down -26 points from last week’s 54. This is the sharpest single-week decline since the newsletter started.
The advance/decline ratio (how many stocks went up vs down) collapsed to 0.48. For every stock that rose, two fell. Last week this was at 1.01, perfect equilibrium. That equilibrium broke hard.
The McClellan Oscillator plunged to -184.3, the deepest negative reading we have recorded. The McClellan Summation (the cumulative version, which shows whether selling pressure is building or fading over weeks) crashed to -485 with the trend labeled “Crashing.” This is forced selling.
The safety net I relied on last week is gone. Last week: zero new lows. This week: 12 new 52-week lows appeared. The HL Index (percentage of stocks making new highs vs new lows over the past 10 days) dropped from 85.4% to 62.1%, a -23 point collapse in seven days. Still above the 50% danger zone, but the cushion is thin.
The moving average picture is ugly. Only 27.6% of S&P 500 stocks are above their 50-day SMA (was 69.9% one week ago). Only 21.5% above their 20-day. Less than half (48.2%) are above their 200-day. The average stock is already in correction territory. Some are already in a bear market.
The Zweig breadth thrust indicator (a measure of whether buying pressure is strong enough to signal a new rally) sits at 32.1%, no thrust signal. The volume picture is even worse: down volume at 3.18B vs up volume at 1.35B.
Sellers are moving more capital than buyers by a ratio of 2.4 to 1. TRIN (the Arms Index, which compares advancing vs declining volume) at 1.45 confirms heavy selling pressure.
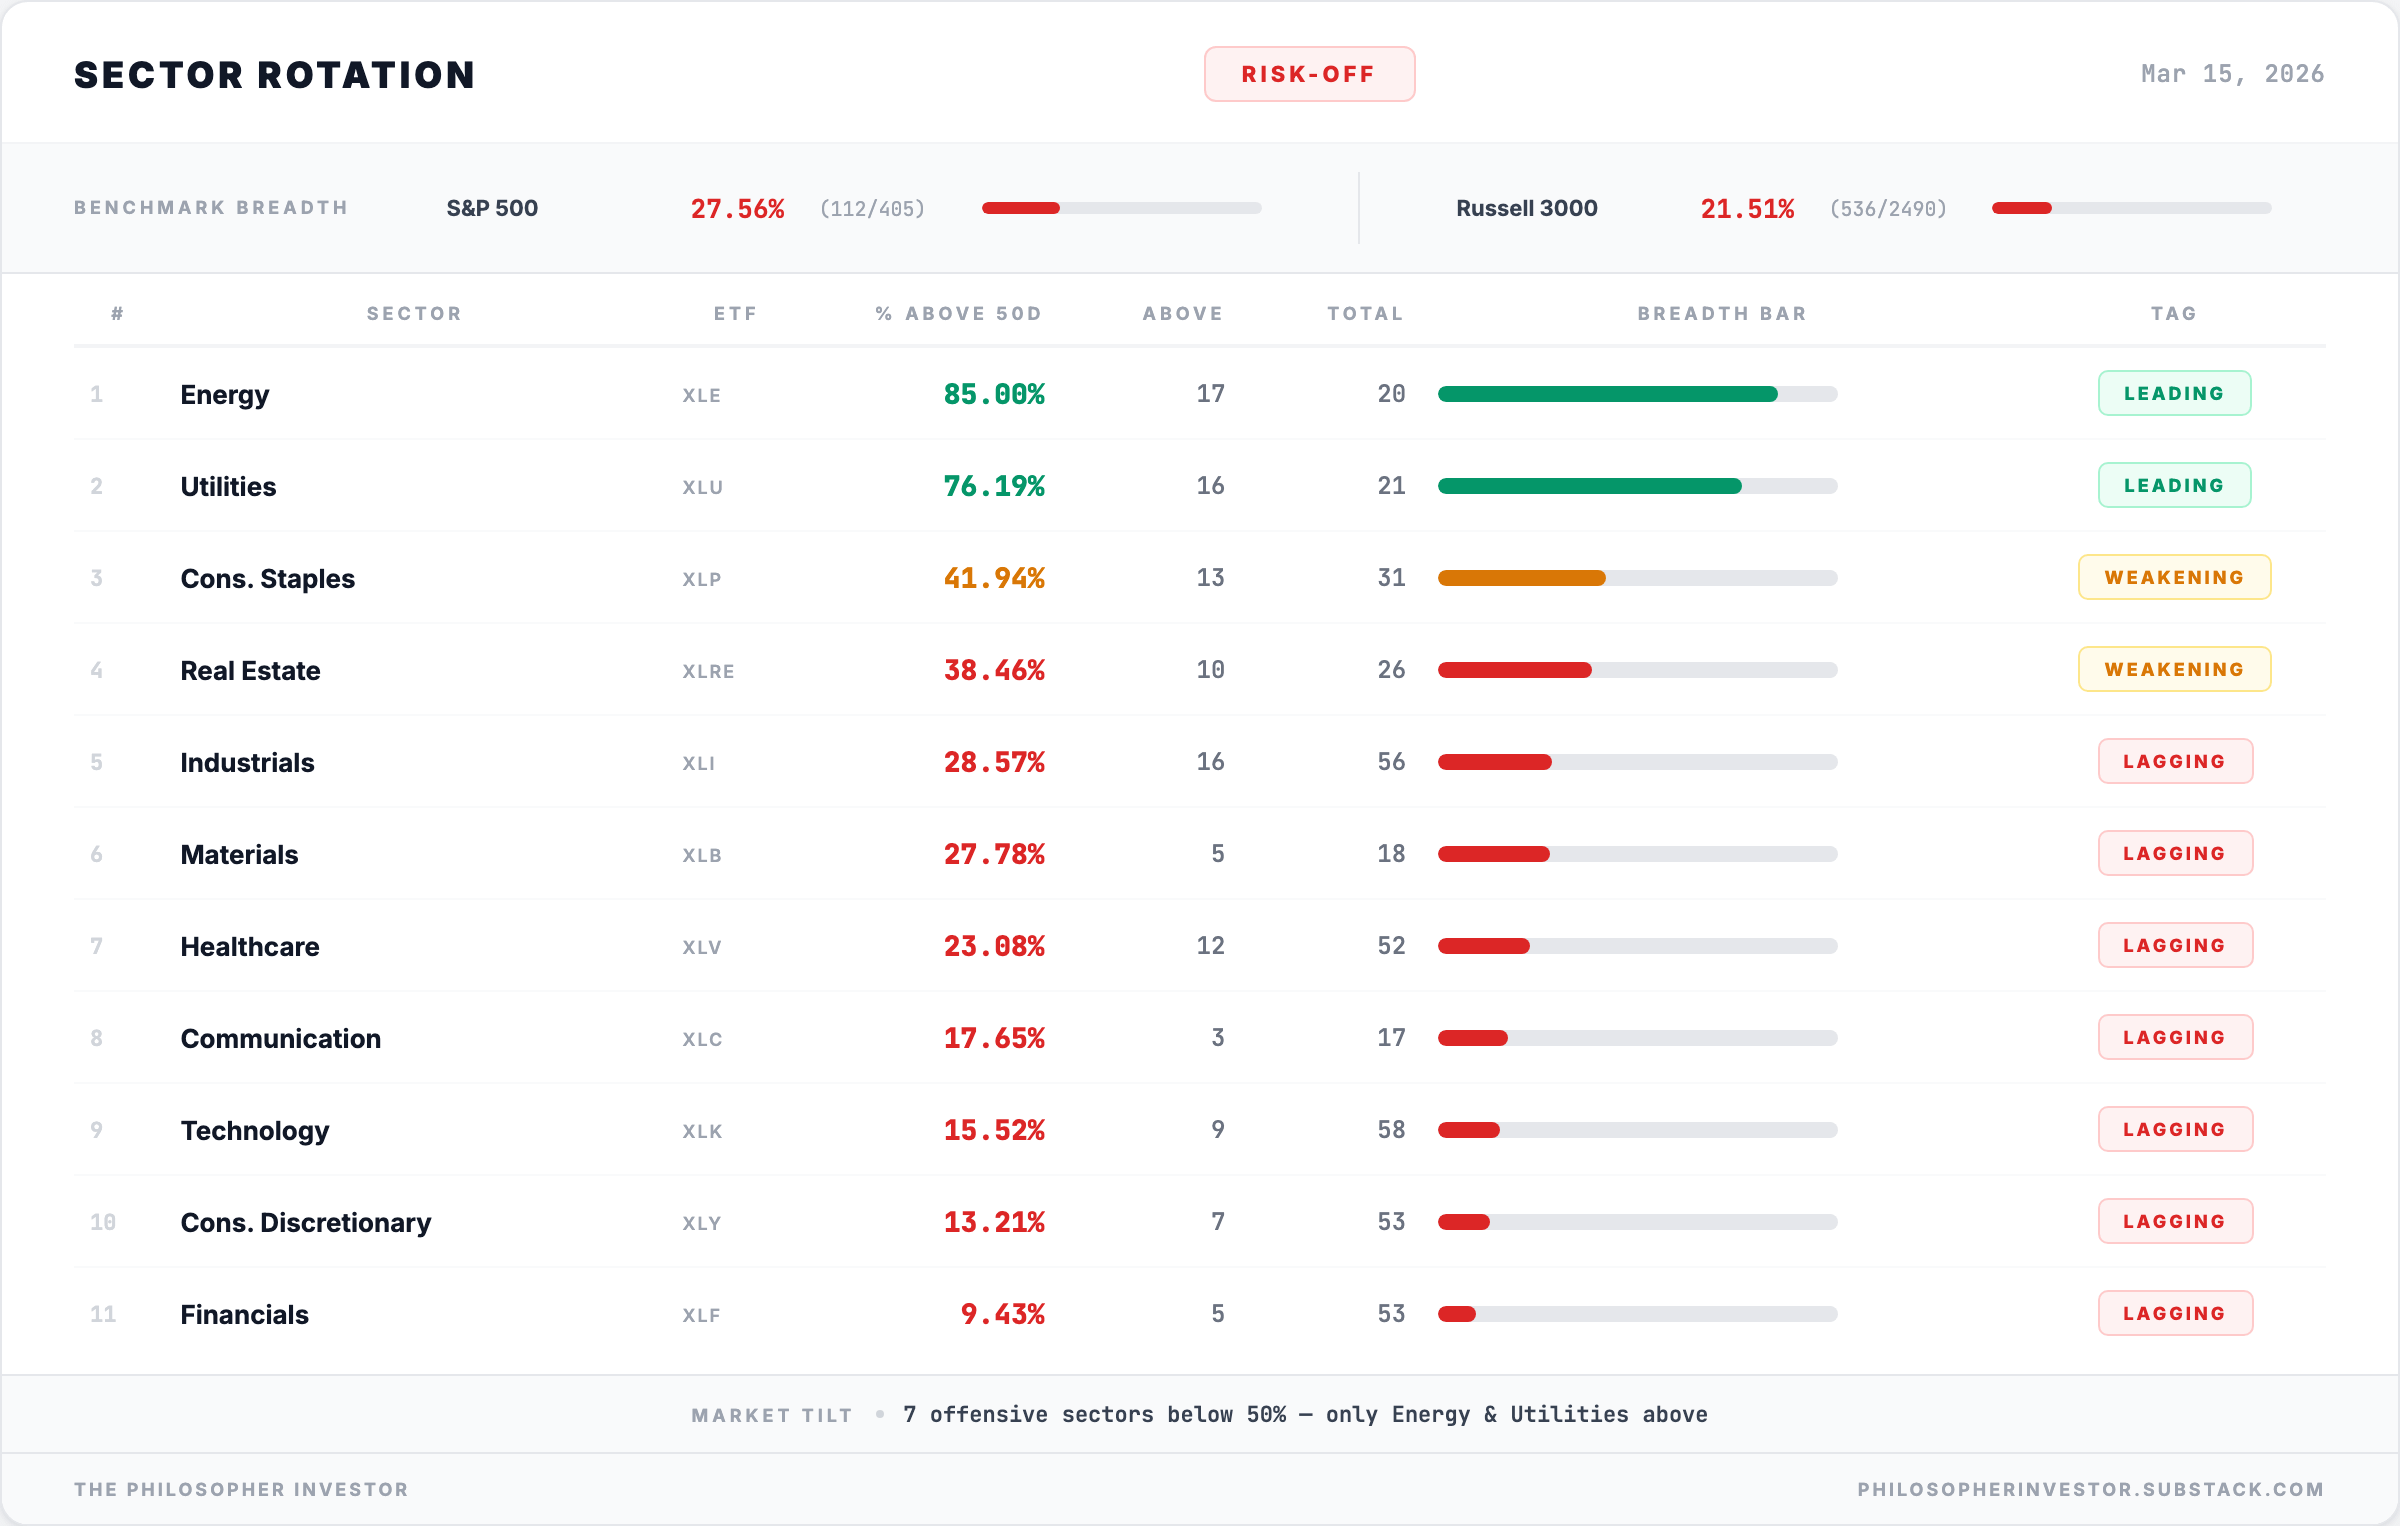
🚨 Sector Rotation: Two Sectors Standing. Nine Down.
The regime label says it all: RISK-OFF.
Only 2 out of 11 sectors have more than half their stocks in uptrends. Energy (XLE) at 85% and Utilities (XLU) at 76.19% are the only survivors. Everything else is underwater.
The carnage by sector:
Read that bottom line again. 9.43% of financial stocks are above their 50-day moving average. That means 48 out of 53 bank and financial stocks have broken their intermediate-term trend. Last week XLF was already the weakest sector. This week it fell further into the abyss. When financials break this hard while rates stay elevated, it signals credit stress and balance sheet concern.
Technology at 15.52%. Communication at 17.65%. Consumer Discretionary at 13.21%. These three sectors plus Financials represent the majority of S&P 500 market cap. The index is being held up by two sectors that together weigh less than 8% of the index.
The S&P 500 benchmark breadth: 27.56% (112 out of 405 stocks above the 50-day). The Russell 3000 is even worse: 21.51% (536 out of 2,490). Small caps are getting destroyed. The broader you look, the uglier it gets.
This is the logical extension of last week’s all-red tape. The rotation into energy and utilities that began weeks ago is the only trade that survived. Everything else failed.
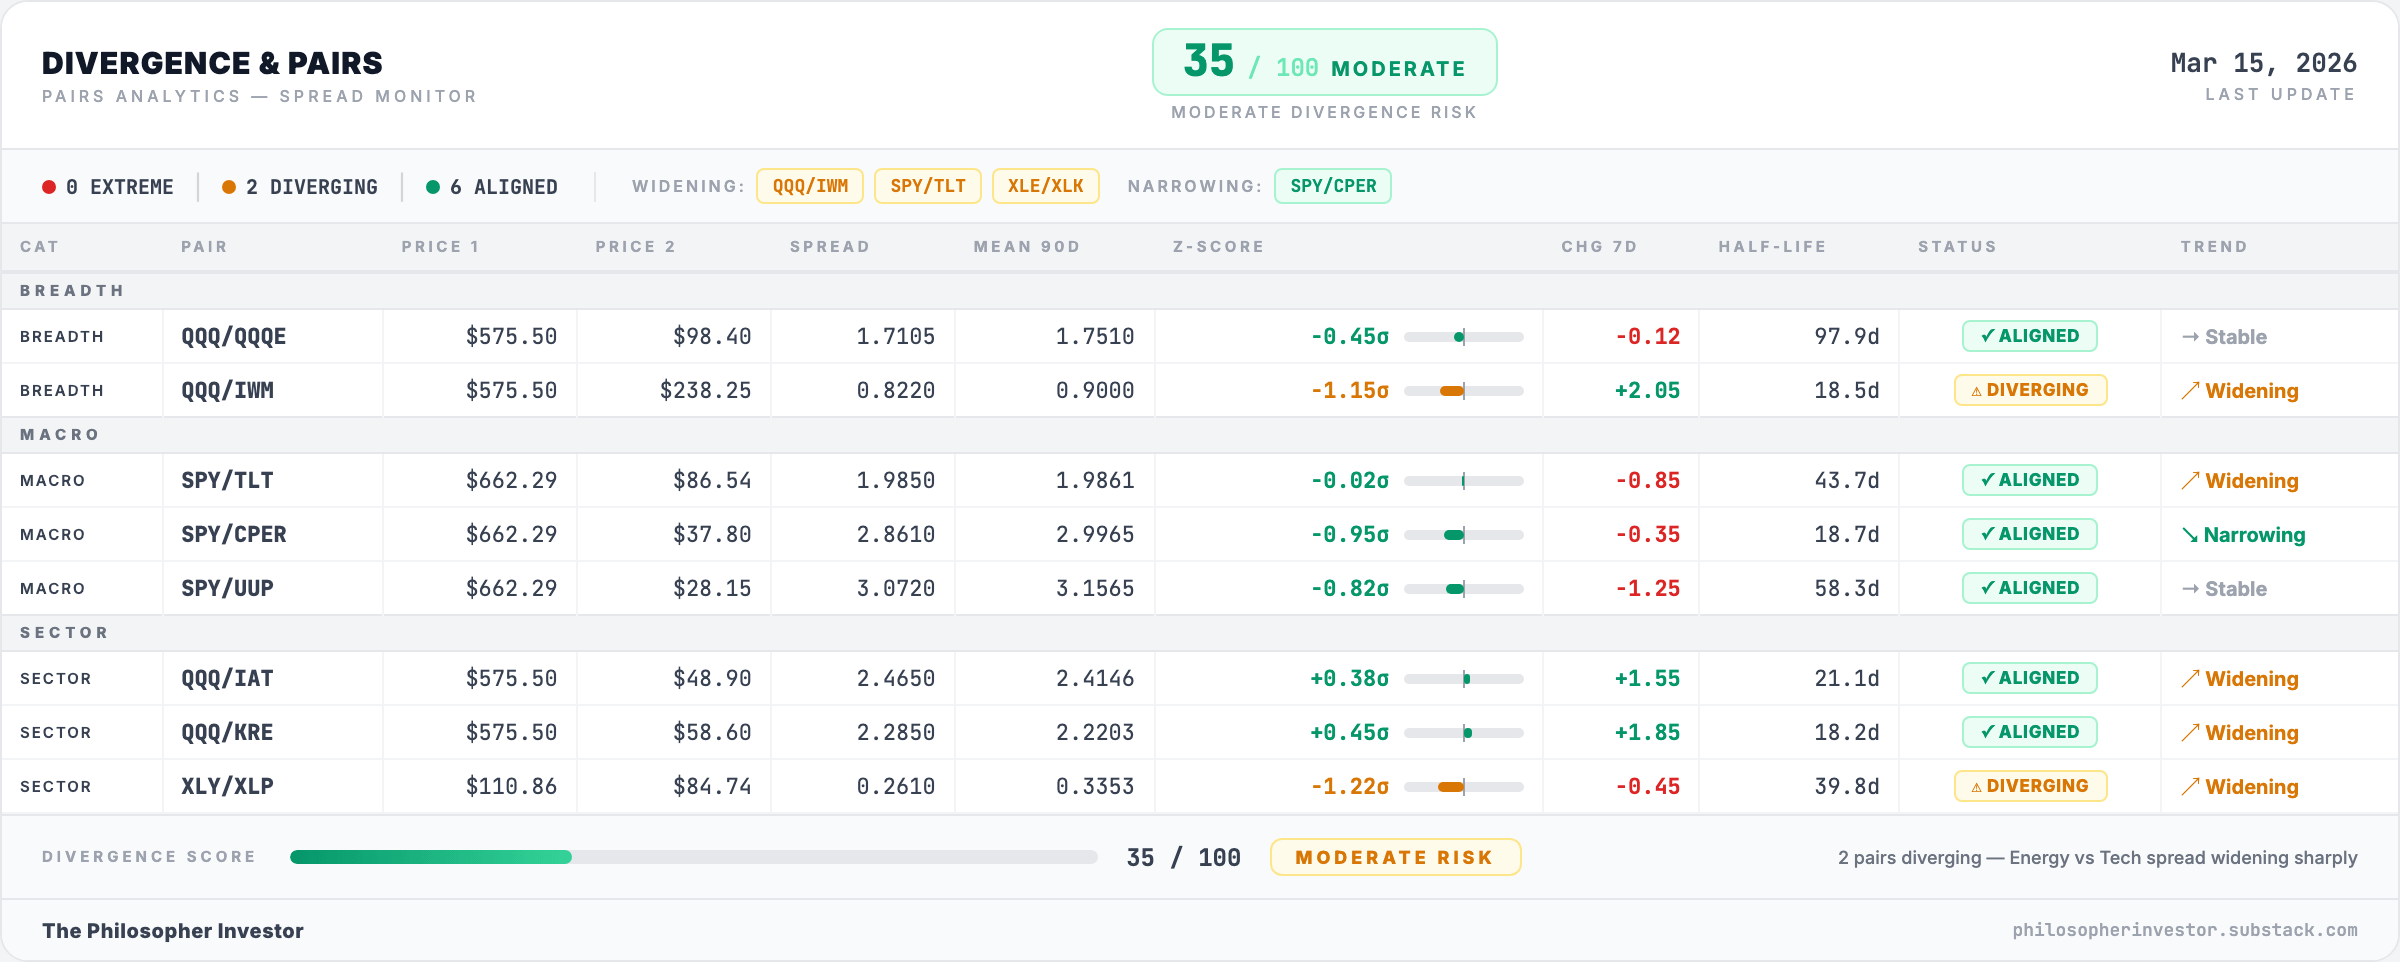
🔍 Divergence Score: 35/100 — MODERATE
Up from 27 last week. Two pairs are now diverging, up from zero.
The divergence score measures whether different asset classes and sectors are moving in sync or pulling apart. When divergence is low during a decline, it means everything is selling together (broad liquidation). When divergence rises during a decline, it means some parts of the market are fighting the trend, creating potential opportunities and instability.
The two diverging pairs:
QQQ/IWM (tech vs small caps): z-score -1.15σ, widening with a +2.05 change over 7 days. Large cap tech is outperforming small caps by a widening margin. Small caps are being hit disproportionately hard.
XLY/XLP (consumer discretionary vs consumer staples): z-score -1.22σ, widening. Consumers are rotating from discretionary spending to staples. This is a classic recession-fear signal.
Meanwhile, QQQ/IAT (tech vs regional banks) and QQQ/KRE (tech vs regional banking) are aligned but widening rapidly (+1.55 and +1.85 over 7 days). Banks are underperforming tech at an accelerating rate.
SPY/CPER (equities vs copper) is narrowing. The only pair that is compressing. Copper and equities converging during a selloff usually means the growth scare is real, not just a positioning event. Copper does not lie about economic demand.
The shift from 27 to 35 is notable. The market is no longer falling in unison. Cracks and divergences are appearing. This creates both risk and opportunity. When divergences widen further, they eventually snap back. The question is which side corrects.
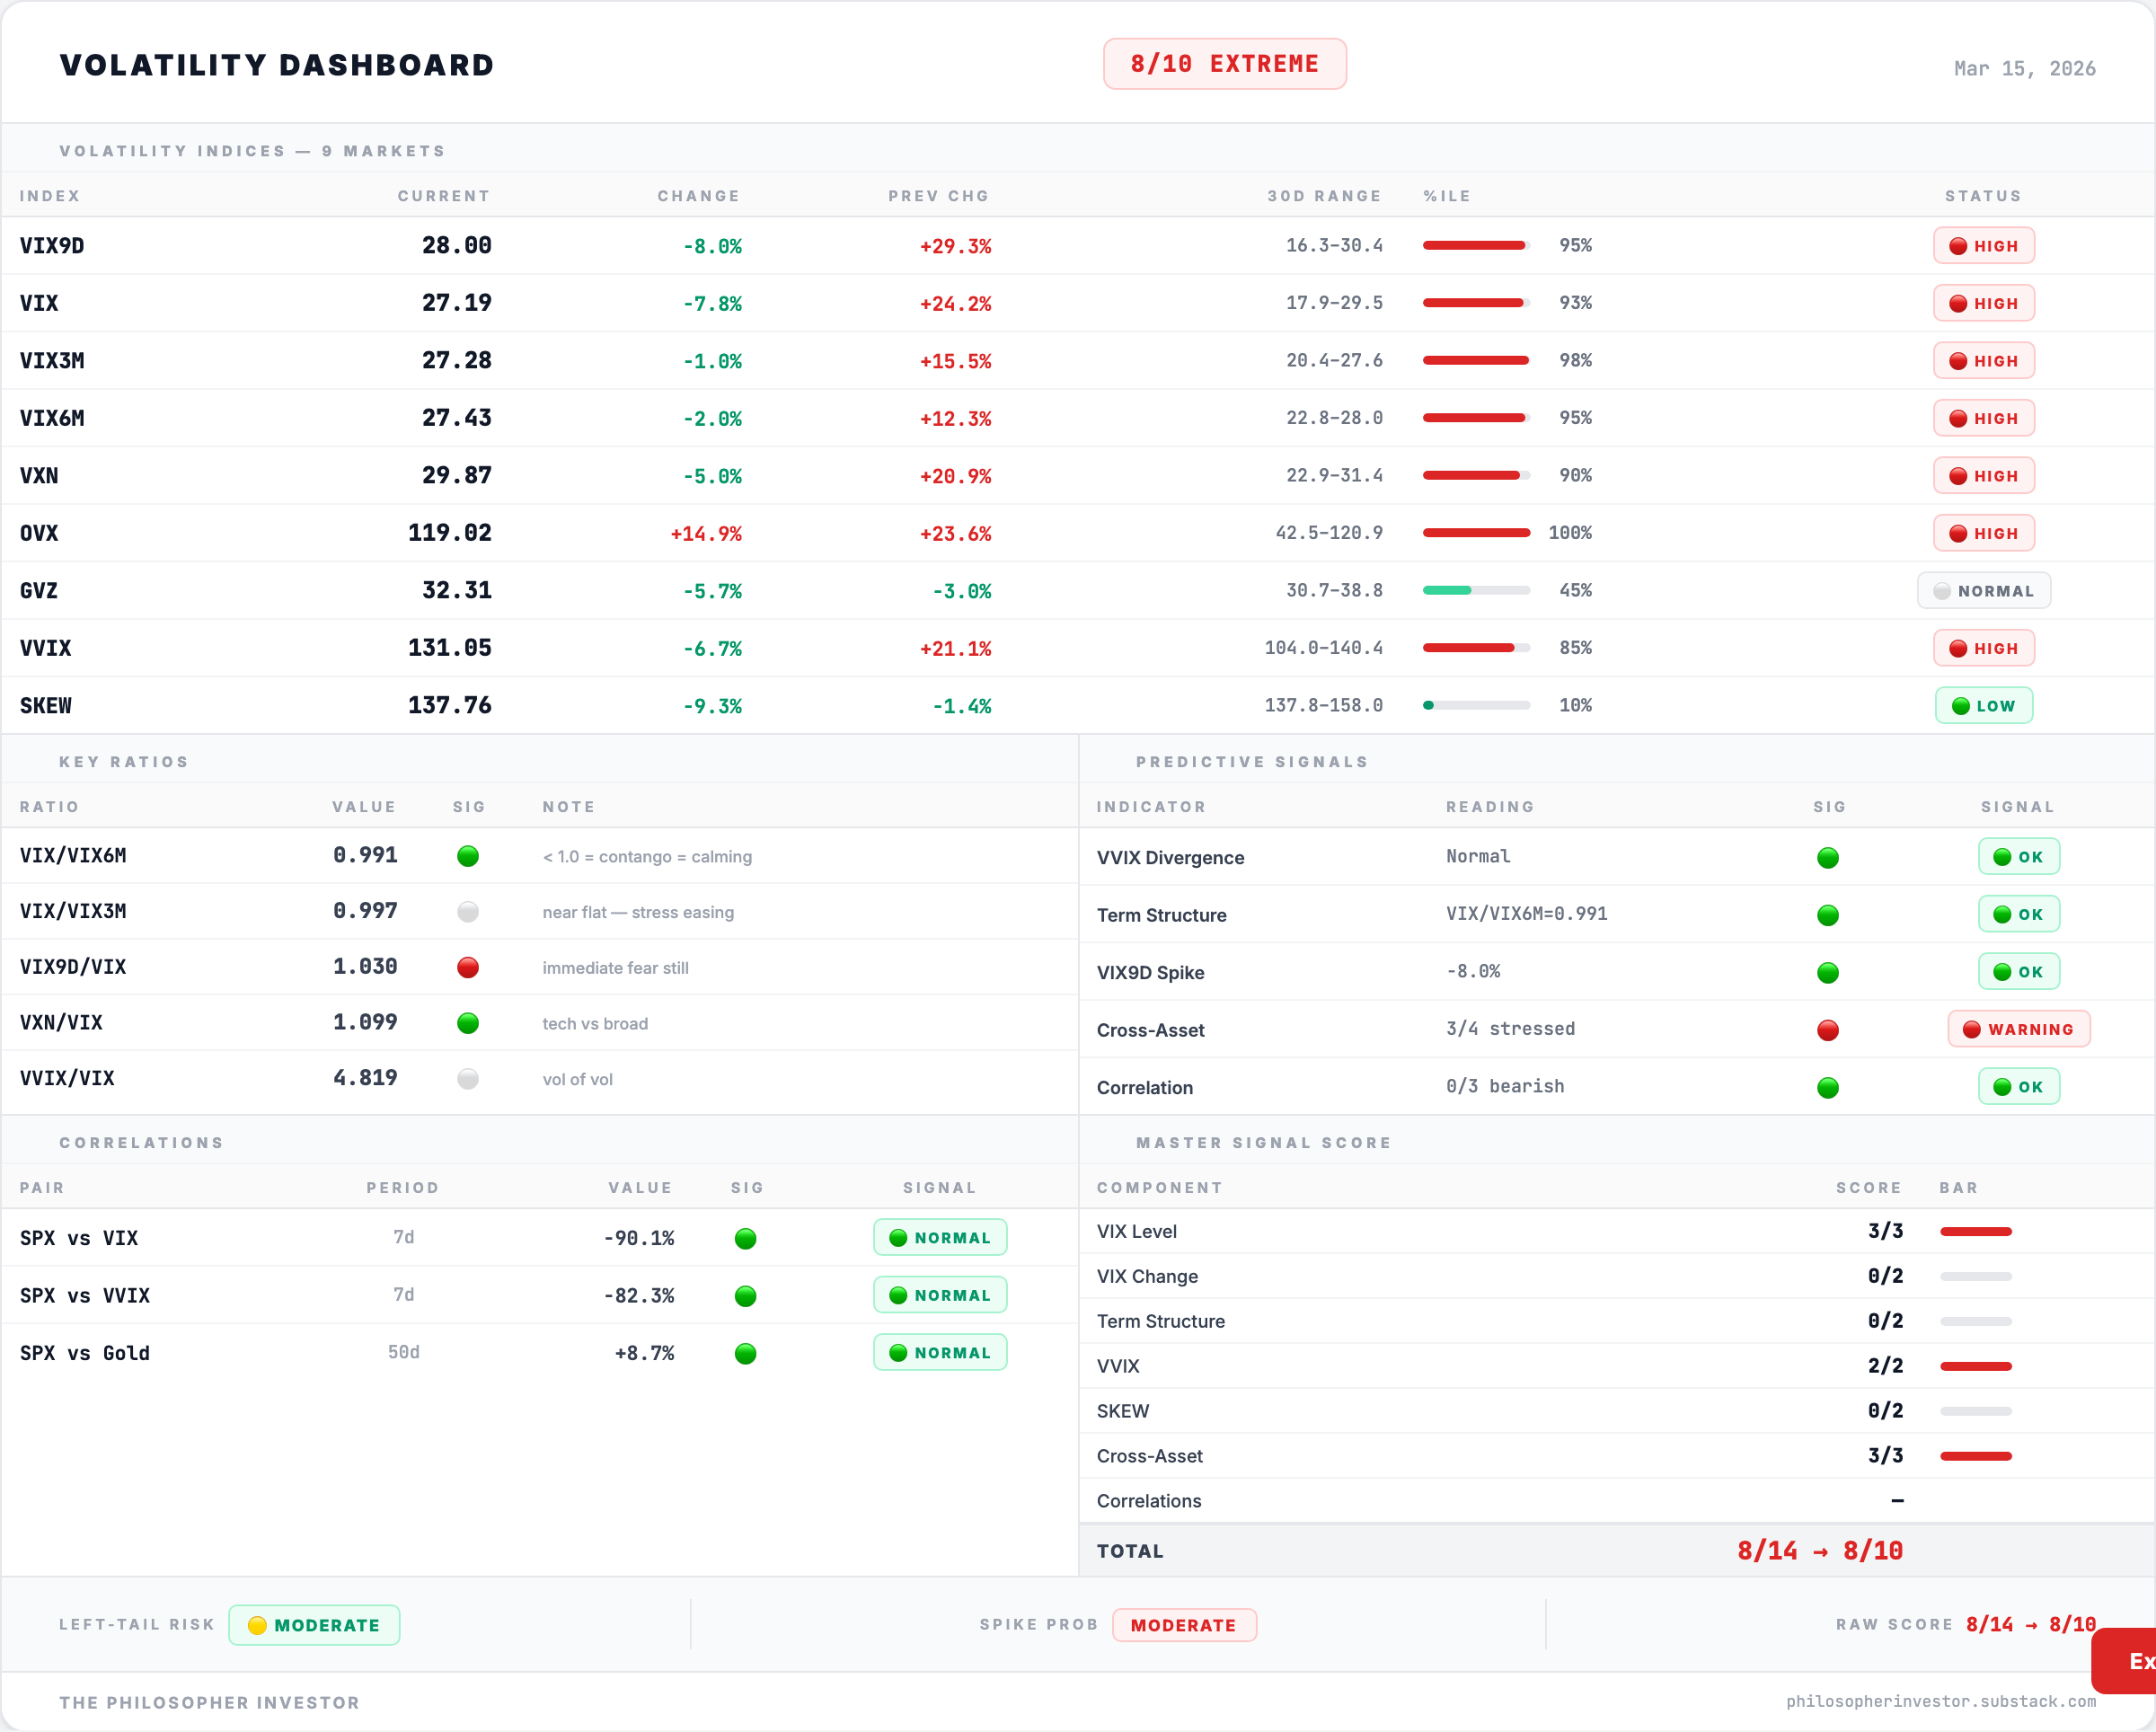
📉 Volatility: VIX 27.19. Score 8/10 EXTREME.
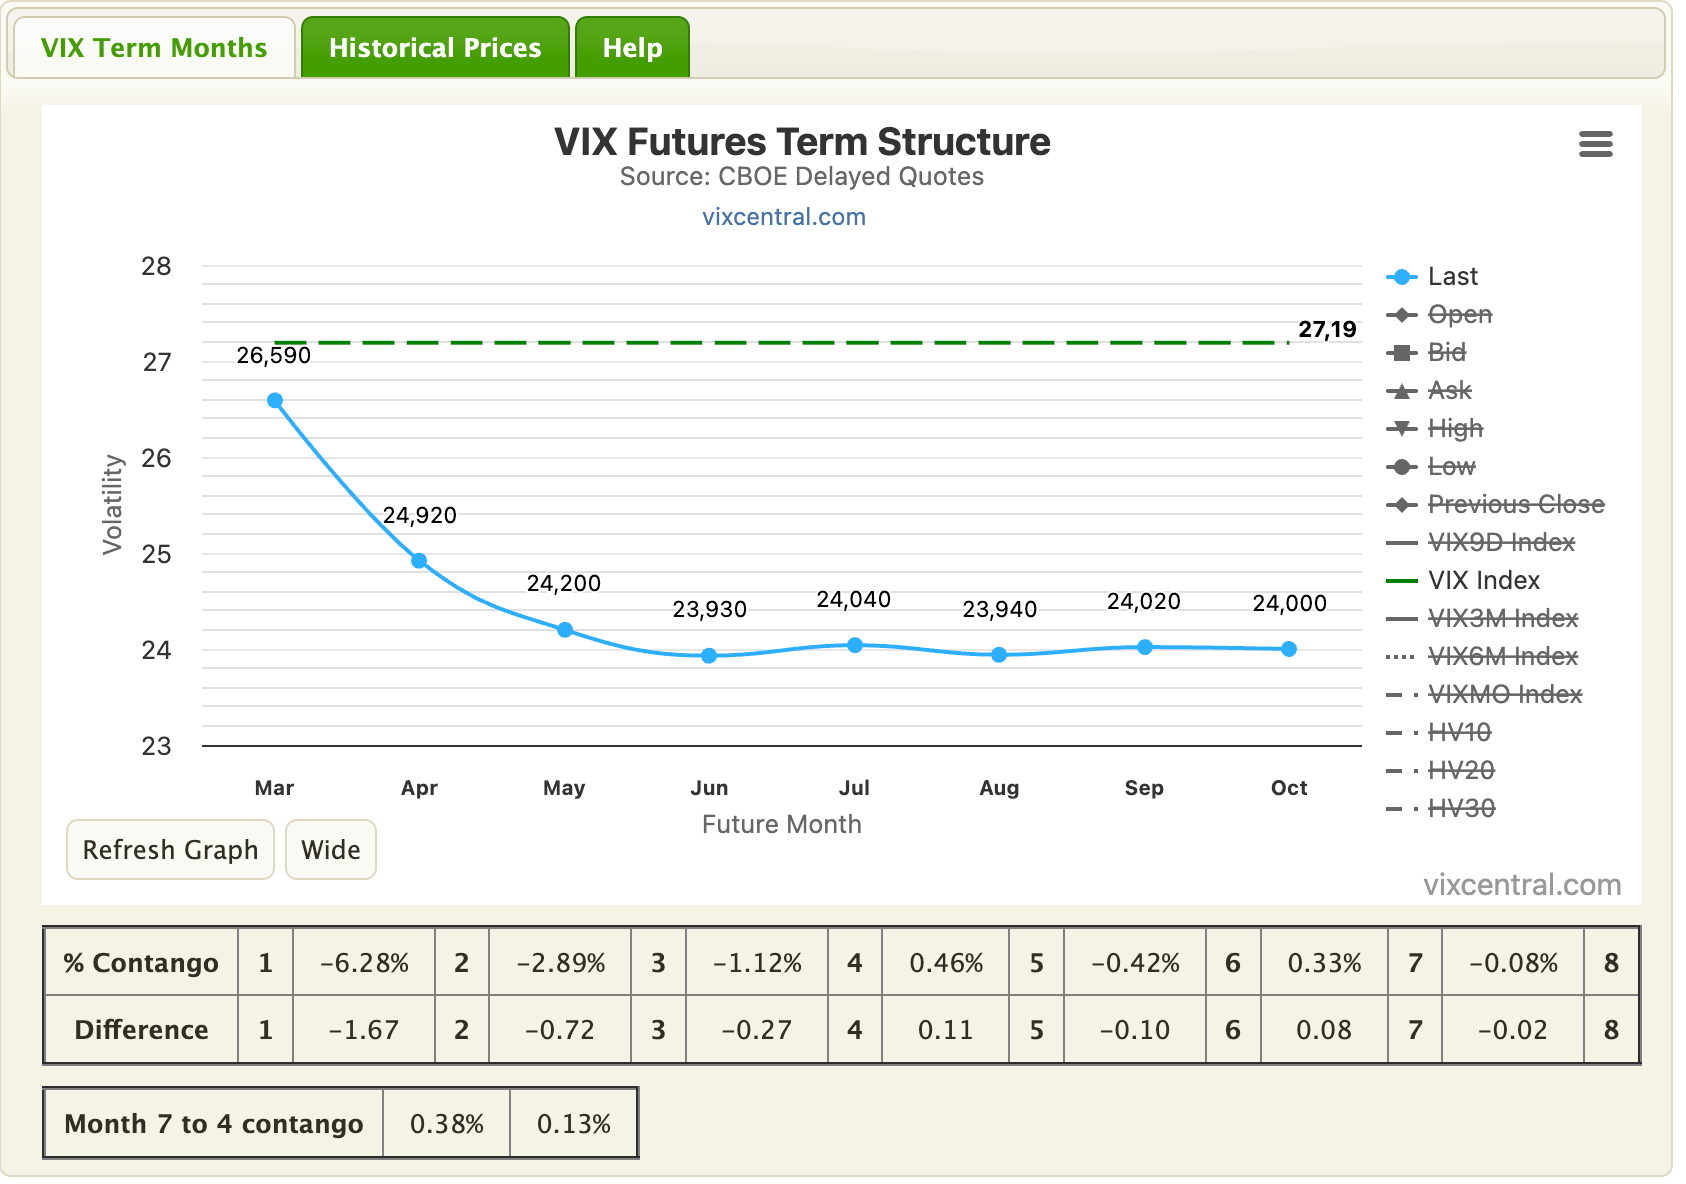
Here is the paradox of the week. The VIX fell -7.8% from 29.49 to 27.19. Backwardation resolved. The term structure is back in contango (barely). And yet the volatility score jumped from 5/10 to 8/10.
How? Because the stress generalized.
Let me walk through the numbers.
VIX at 27.19, 83rd percentile. VIX3M at 27.28, 97th percentile. VIX6M at 27.43, 95th percentile. The entire curve is elevated. Every single equity vol measure is reading HIGH.
OVX (oil volatility) at 119.02, 100th percentile. Up +14.9% this week on top of last week’s already extreme reading. VXN (Nasdaq vol) at 29.87, 90th percentile. GVZ (gold vol) at 32.31, 45th percentile, actually cooling. Gold vol is normalizing while oil vol hits new records.
VVIX at 131.05, 85th percentile, HIGH. VVIX measures the volatility of the VIX itself, how unstable the fear gauge is. At 131, traders are paying elevated premiums for options on the VIX. Instability about instability.
SKEW at 137.76, 10th percentile, LOW. Dramatic drop from 152 last week. SKEW measures demand for crash protection (deep out-of-the-money puts). At the 10th percentile, traders have stopped buying crash protection.
Two interpretations: either they believe the worst is priced in, or they already own all the protection they need. Given that OVX and VVIX are still extreme, I lean toward the second. The hedges are in place.
Key Ratios:
VIX/VIX6M at 0.991. Just barely below 1.0. Last week it was 1.05 in backwardation. The curve has flattened and technically returned to contango, but at 0.991 this is functionally flat. The panic spike resolved but the market has not normalized.
VIX9D/VIX at 1.030. The ultra short-term VIX is still above the 30-day. Immediate fear persists. Traders are paying more for next-week protection than next-month protection.
VXN/VIX at 1.099. Nasdaq volatility running 10% above broad market vol. Last week this was 1.07. The gap widened. Tech-specific stress is increasing.
💱 FX Signal: RISK-OFF CONFIRMED
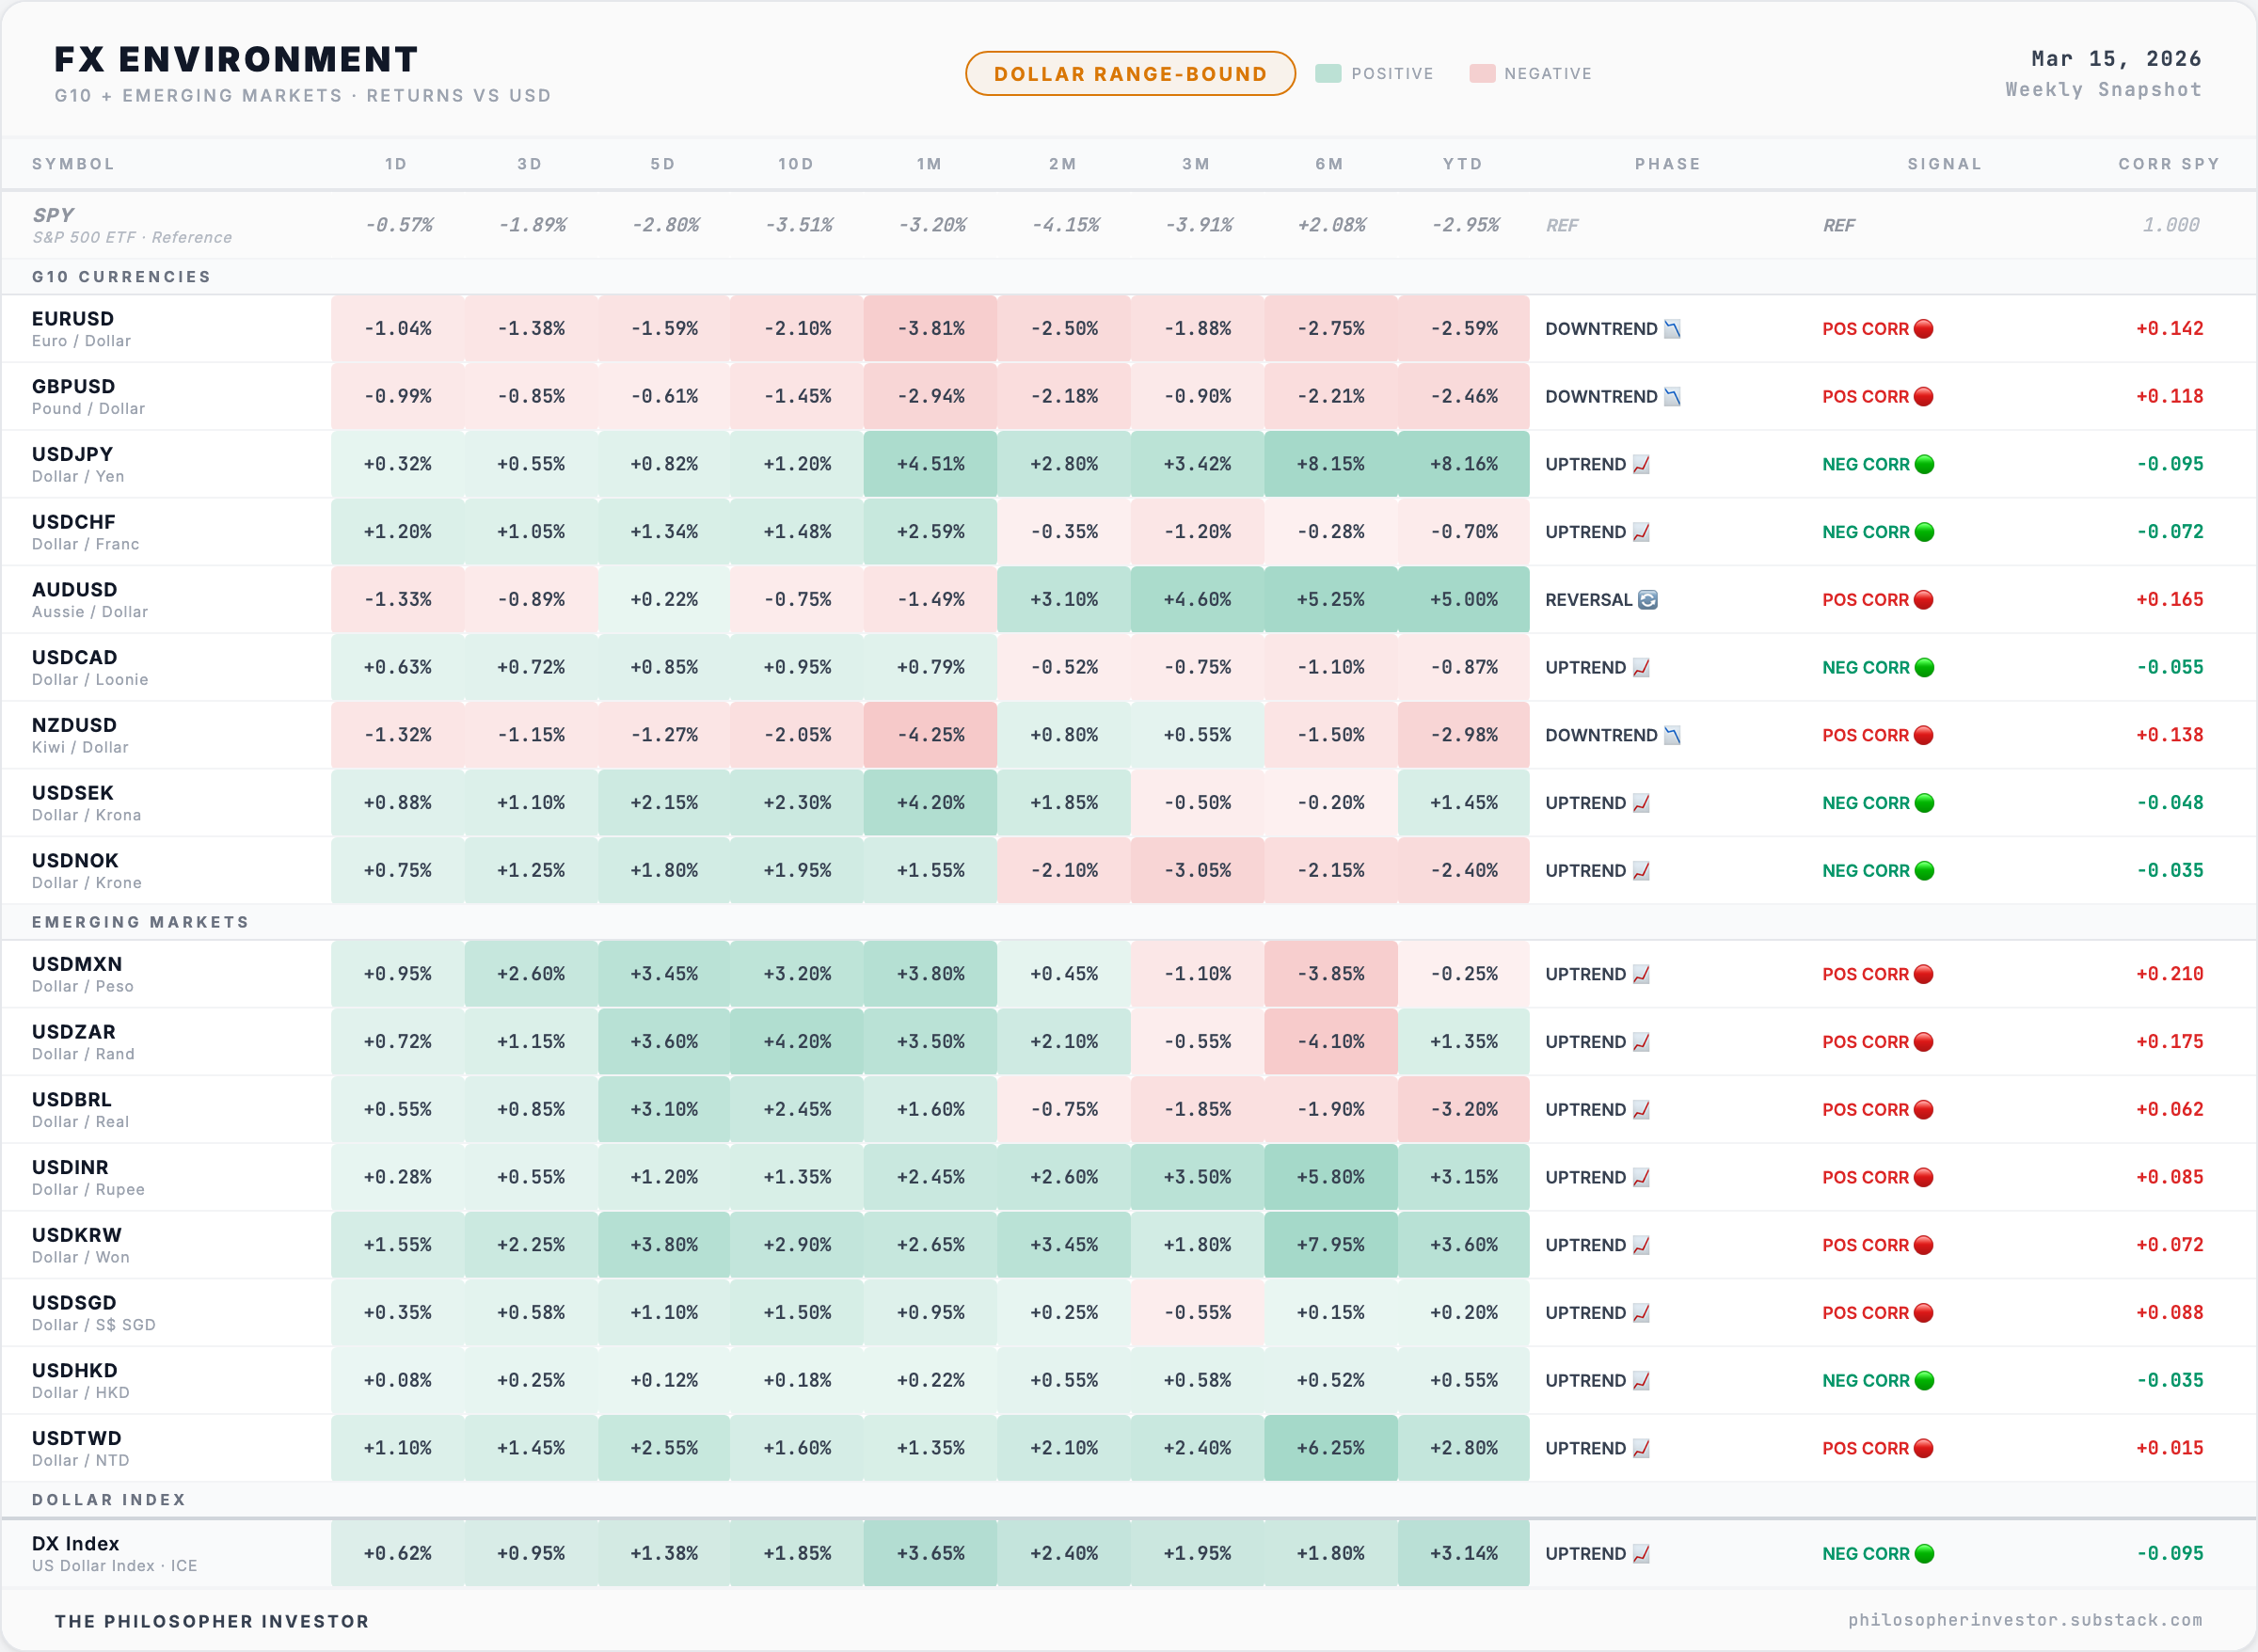
The dollar continues to strengthen. Every emerging market currency is weakening against the dollar.
USDMXN (dollar vs Mexican peso): uptrend, +3.45% over 5 days, positive correlation with SPY weakness.
USDZAR (South African rand): uptrend, +3.60% over 5 days. USDKRW (Korean won): uptrend, +3.80% over 5 days.
USDBRL (Brazilian real): uptrend, +3.10% over 5 days.
The entire EM complex is under pressure.
On the G10 side: EURUSD and GBPUSD both in downtrends with positive SPY correlation (they fall when risk sells off). USDJPY in uptrend with negative SPY correlation, meaning the yen is not acting as a safe haven this time.
USDCHF also in uptrend but the franc is weakening, unusual for a risk-off environment.
The Australian dollar (AUDUSD) is the interesting signal: marked as REVERSAL, the only currency flashing a potential phase change. Aussie is a classic risk-on currency (commodity exposure, China trade). A reversal signal here could indicate either the worst is priced into commodity currencies or that China’s stimulus is providing a floor. Worth monitoring.
The FX read: pure dollar strength. Money flowing to the US dollar as the global safe haven. EM currencies under pressure. This is consistent with a global de-risking event. The FX market, which trades $7.5 trillion per day, is confirming what breadth, vol, and sectors are all saying.
🧠 My Take
The correction deepened exactly as the data suggested it would. The breadth-leads-vol lag I described last week has now played out in full. Breadth collapsed from 54 to 28 while the VIX actually cooled. This is Phase 2 of the correction: the panic spike is over, but the damage is accelerating underneath.
Here is what I am watching most closely.
The 28 score is not yet capitulation. True capitulation usually sees breadth below 20, McClellan Summation below -1000, and new lows exploding above 50 in a single session. We are at 28, -485, and 12 new lows. Bad, but not washout. The 1,007 bottom triggers on March 12 came close to a washout reading, but the market bounced off it within two days. That intraday recovery matters.
Energy is the only trade working. With 85% of energy stocks above their 50-day, this is the most extreme sector concentration since the newsletter started. Only 2 out of 11 sectors leading. When leadership narrows this much, two things can happen: either the laggards catch up (bullish) or the leaders finally get dragged down too (bearish). I am watching Energy closely for any cracks.
The gold sentiment flip is critical. The screener data shows GLD’s options put/call ratio flipped from 0.38 (ultra-bullish) to 1.28 (bearish) in one week. That is a complete reversal. Open interest put/call ratio at 3.65 shows massive put accumulation. Gold miners (GDX) are at their 98.6th percentile of realized volatility. Options on NEM and GDX are at their 97th percentile of implied vol. Last week gold was the unanimous trade. This week sentiment has cracked. But sentiment extremes often mark turning points, not continuations. If gold holds above $440 despite this fear, the dip is buyable.
SPY options flow is paradoxically bullish. Volume put/call ratio at 0.13 means traders are buying 7.7 calls for every put on SPY. This during a week where breadth collapsed to 28. Either retail is buying the dip with calls (often wrong at the wrong time) or institutional desks are positioning for a snap-back rally. The heavy bearish sweeps on cyclicals (LYB $5.2M in puts, ALK $1.6M, LULU $1.3M) suggest the smart money is hedging specific names, not the broad market.
Scenario matrix for March 16-21:
Scenario A, Oversold Bounce (35%): Breadth at 28 with 1,007 bottom triggers is historically associated with a 1-2 week bounce. VIX drops below 25. SPY retests $670-675. Best play: quality pullback names from the BTFD screener (ARW, WMT, STX).
Scenario B, Continued Grind (30%): Breadth stabilizes 25-35. VIX stays 25-28. New lows stay under 20. The market chops sideways while internals slowly repair. No clear direction. Energy and utilities continue to lead. SPY ranges $655-670.
Scenario C, Acceleration (20%): Breadth breaks below 20. New lows explode above 30. McClellan Summation breaks -700. SPY tests the 200-day moving average. Requires a catalyst: Hormuz escalation, credit event, or tariff shock. If this happens, the bottom fishing screener will likely flag 1,500+ names.
Scenario D, V-Shape Recovery (15%): Geopolitical de-escalation or Fed communication shift. VIX drops below 22. Breadth snaps back above 40 within a week. Least likely given the depth of the breadth damage, but possible if the Hormuz situation resolves.
🔎 Options Flow — Smart Money Positioning
46 unusual options sweeps on March 13. The picture they paint is clear: institutional money is not bearish on everything. They are hedging the economic cycle while loading up on specific dislocations. Airlines, crypto, gold miners, tankers. The bears are urgent. The bulls are patient. That asymmetry tells you something.
The bearish bets are short-dated. LYB puts at $5.2M expire April 17. One month. ALK puts at $1.6M, same date. LULU puts at $1.3M expire April 2. Three weeks. These are not long-term macro hedges. These are traders who think the next 30 days are going to be ugly for cyclicals and consumer discretionary. They want to be paid fast.
LYB (LyondellBasell) is a chemical company directly downstream of oil. When oil spikes, their input costs explode. $5.2M in puts is a bet that margin compression hits their stock before Q1 earnings. ALK (Alaska Airlines) at $1.6M in puts is the oil-as-cost-input play: airlines get crushed when jet fuel reprices. LULU at $1.3M is the consumer spending thesis. When gas goes from $3.50 to $5.00, yoga pants are the first thing people stop buying. XBI (biotech ETF) puts at $233K suggest hedging against the broader risk-off bleeding into growth sectors.
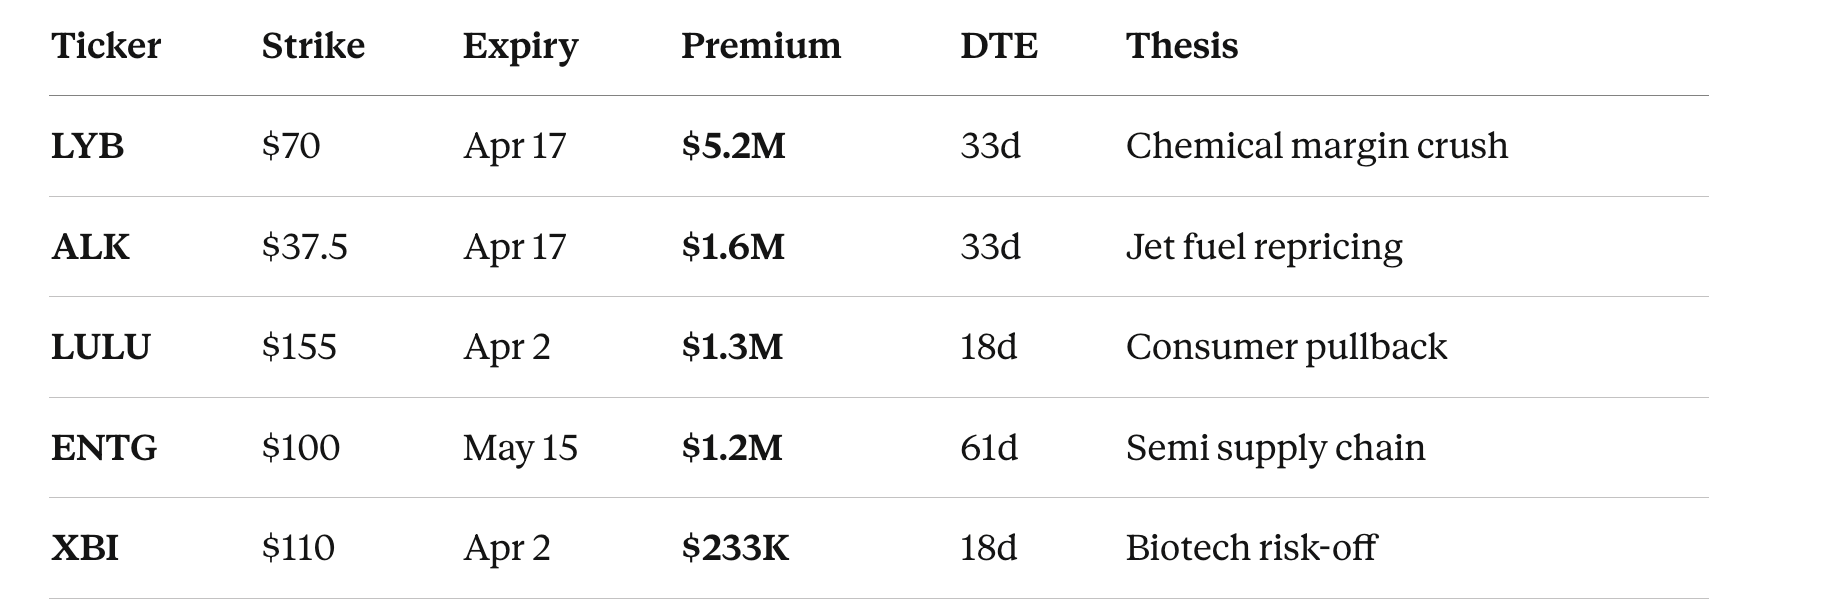
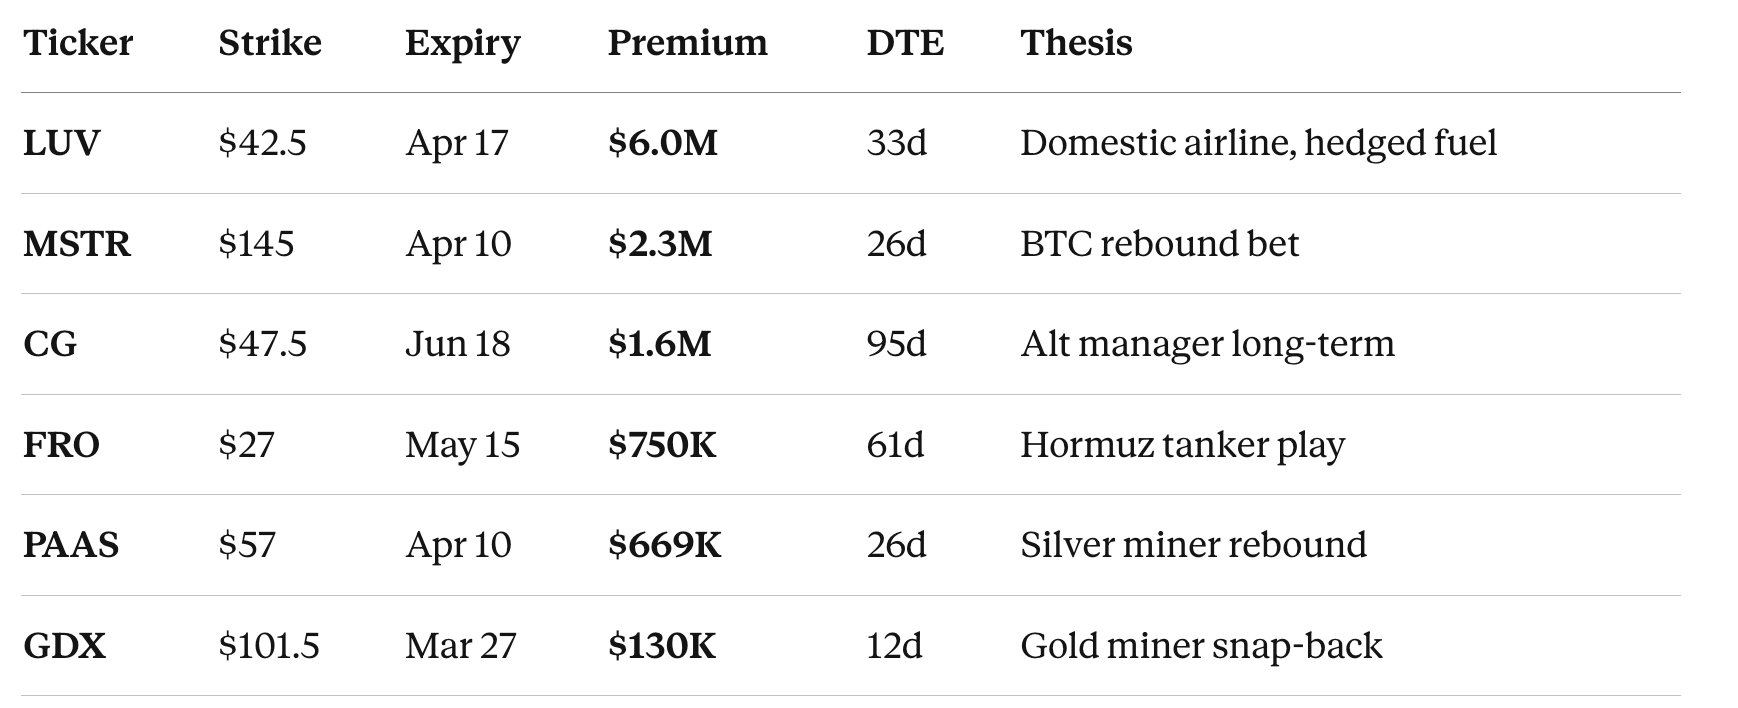
The bullish bets are longer-dated. CG (Carlyle Group) calls at $1.6M expire June 18. Three months out. FRO (Frontline) calls at $750K expire May 15. Two months. Even the shorter-dated bullish sweeps have wider strikes. The bulls are giving themselves time. They are not chasing a bounce. They are positioning for a repricing that might take weeks to unfold.
LUV (Southwest Airlines) at $6.0M in calls is the largest single sweep of the week and it seems contradictory. Why buy airline calls when ALK puts are printing? Because LUV is a domestic carrier with fuel hedges. ALK has more international exposure and less hedging. Smart money is not making a sector bet. They are picking winners and losers within the same sector. That is the tell.
MSTR calls at $2.3M, strike $145, April expiry. A bet that Bitcoin bounces above $75K within a month. Aggressive, binary, but the premium size says conviction. FRO calls at $750K is the Hormuz trade in pure form: someone with a large existing tanker position adding upside protection with two months of runway.
🔥 Trade of the Week: ENPH
Oil at $103 makes solar the contrarian play nobody is talking about.
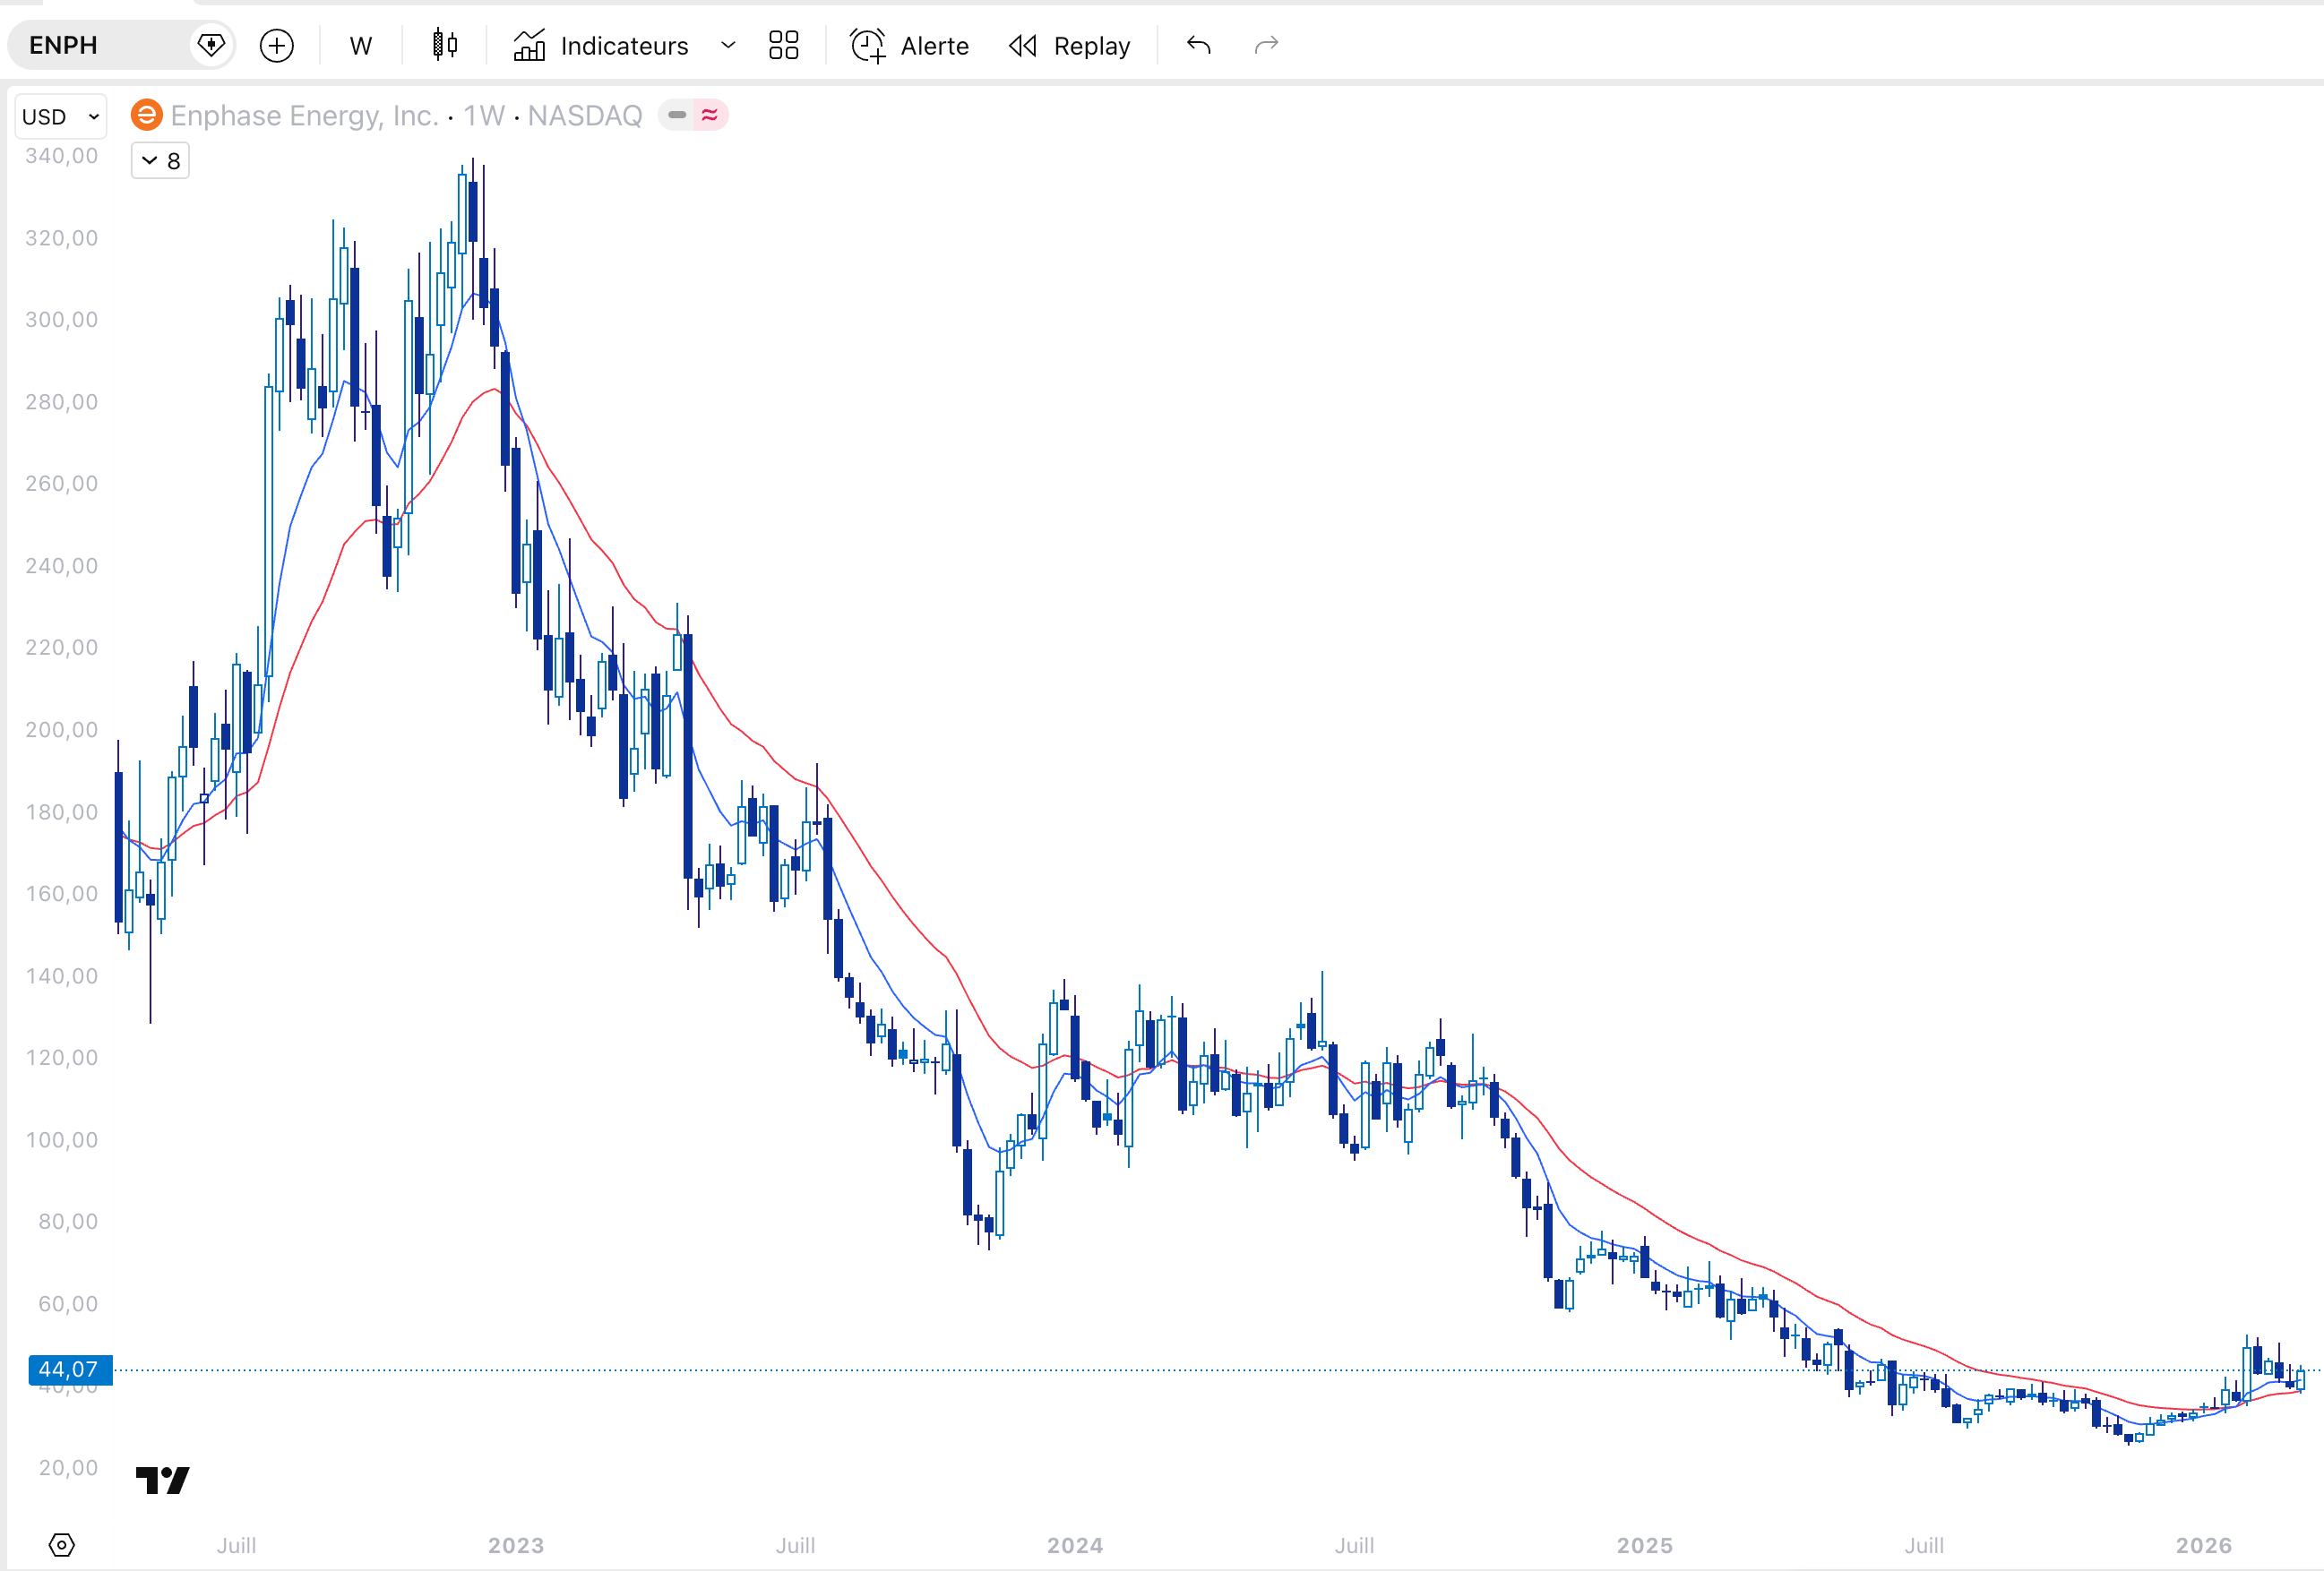
Enphase Energy makes the micro-inverters that convert solar panels into usable electricity. The “picks and shovels” of residential solar. After running from $60 to $340 in 2021-2022, it crashed with the rest of clean energy. Three-year grind lower. Now at $44.07, building a base.
The thesis is the oil math. Every dollar higher on crude makes solar more competitive. At $55/barrel, solar was a nice-to-have. At $103/barrel, it is an economic imperative. Residential electricity bills are repricing. The homeowner staring at a $300/month power bill is suddenly very interested in panels on the roof. ENPH is how that electricity gets converted.
My pullback screener scored it 95/100.. Tied for the highest score in the entire 2,529-stock universe. Pulled back to the 38.2% Fibonacci retracement, the ideal swing entry zone. RSI at 42.6, neutral, not oversold. This is not a falling knife. It is an orderly pullback in a trend that is trying to rebuild.
The 13F data backs it up. One whale fund increased its position by +300% ($12.8M deployed). A second added +26% ($8.5M). The largest holder ($181M) held steady. Net flow: accumulation with growing conviction.
Entry: $42 to $45 (current zone, Fib 38.2%)
Stop Loss: $35 (below Fib 61.8% + ATR buffer, -18%)
Target 1: $58 (+32%) in 2-3 months
Target 2: $70 (+59%) in 4-6 months
Three things kill this trade. A ceasefire that crashes oil below $70. A broader market crash that drags all mid-caps down. Or a company-specific earnings miss. The stop at $35 handles all three.
🎯 Portfolio Performance
I share entry levels, stops, and targets. Position sizes are yours to decide based on your own risk tolerance.
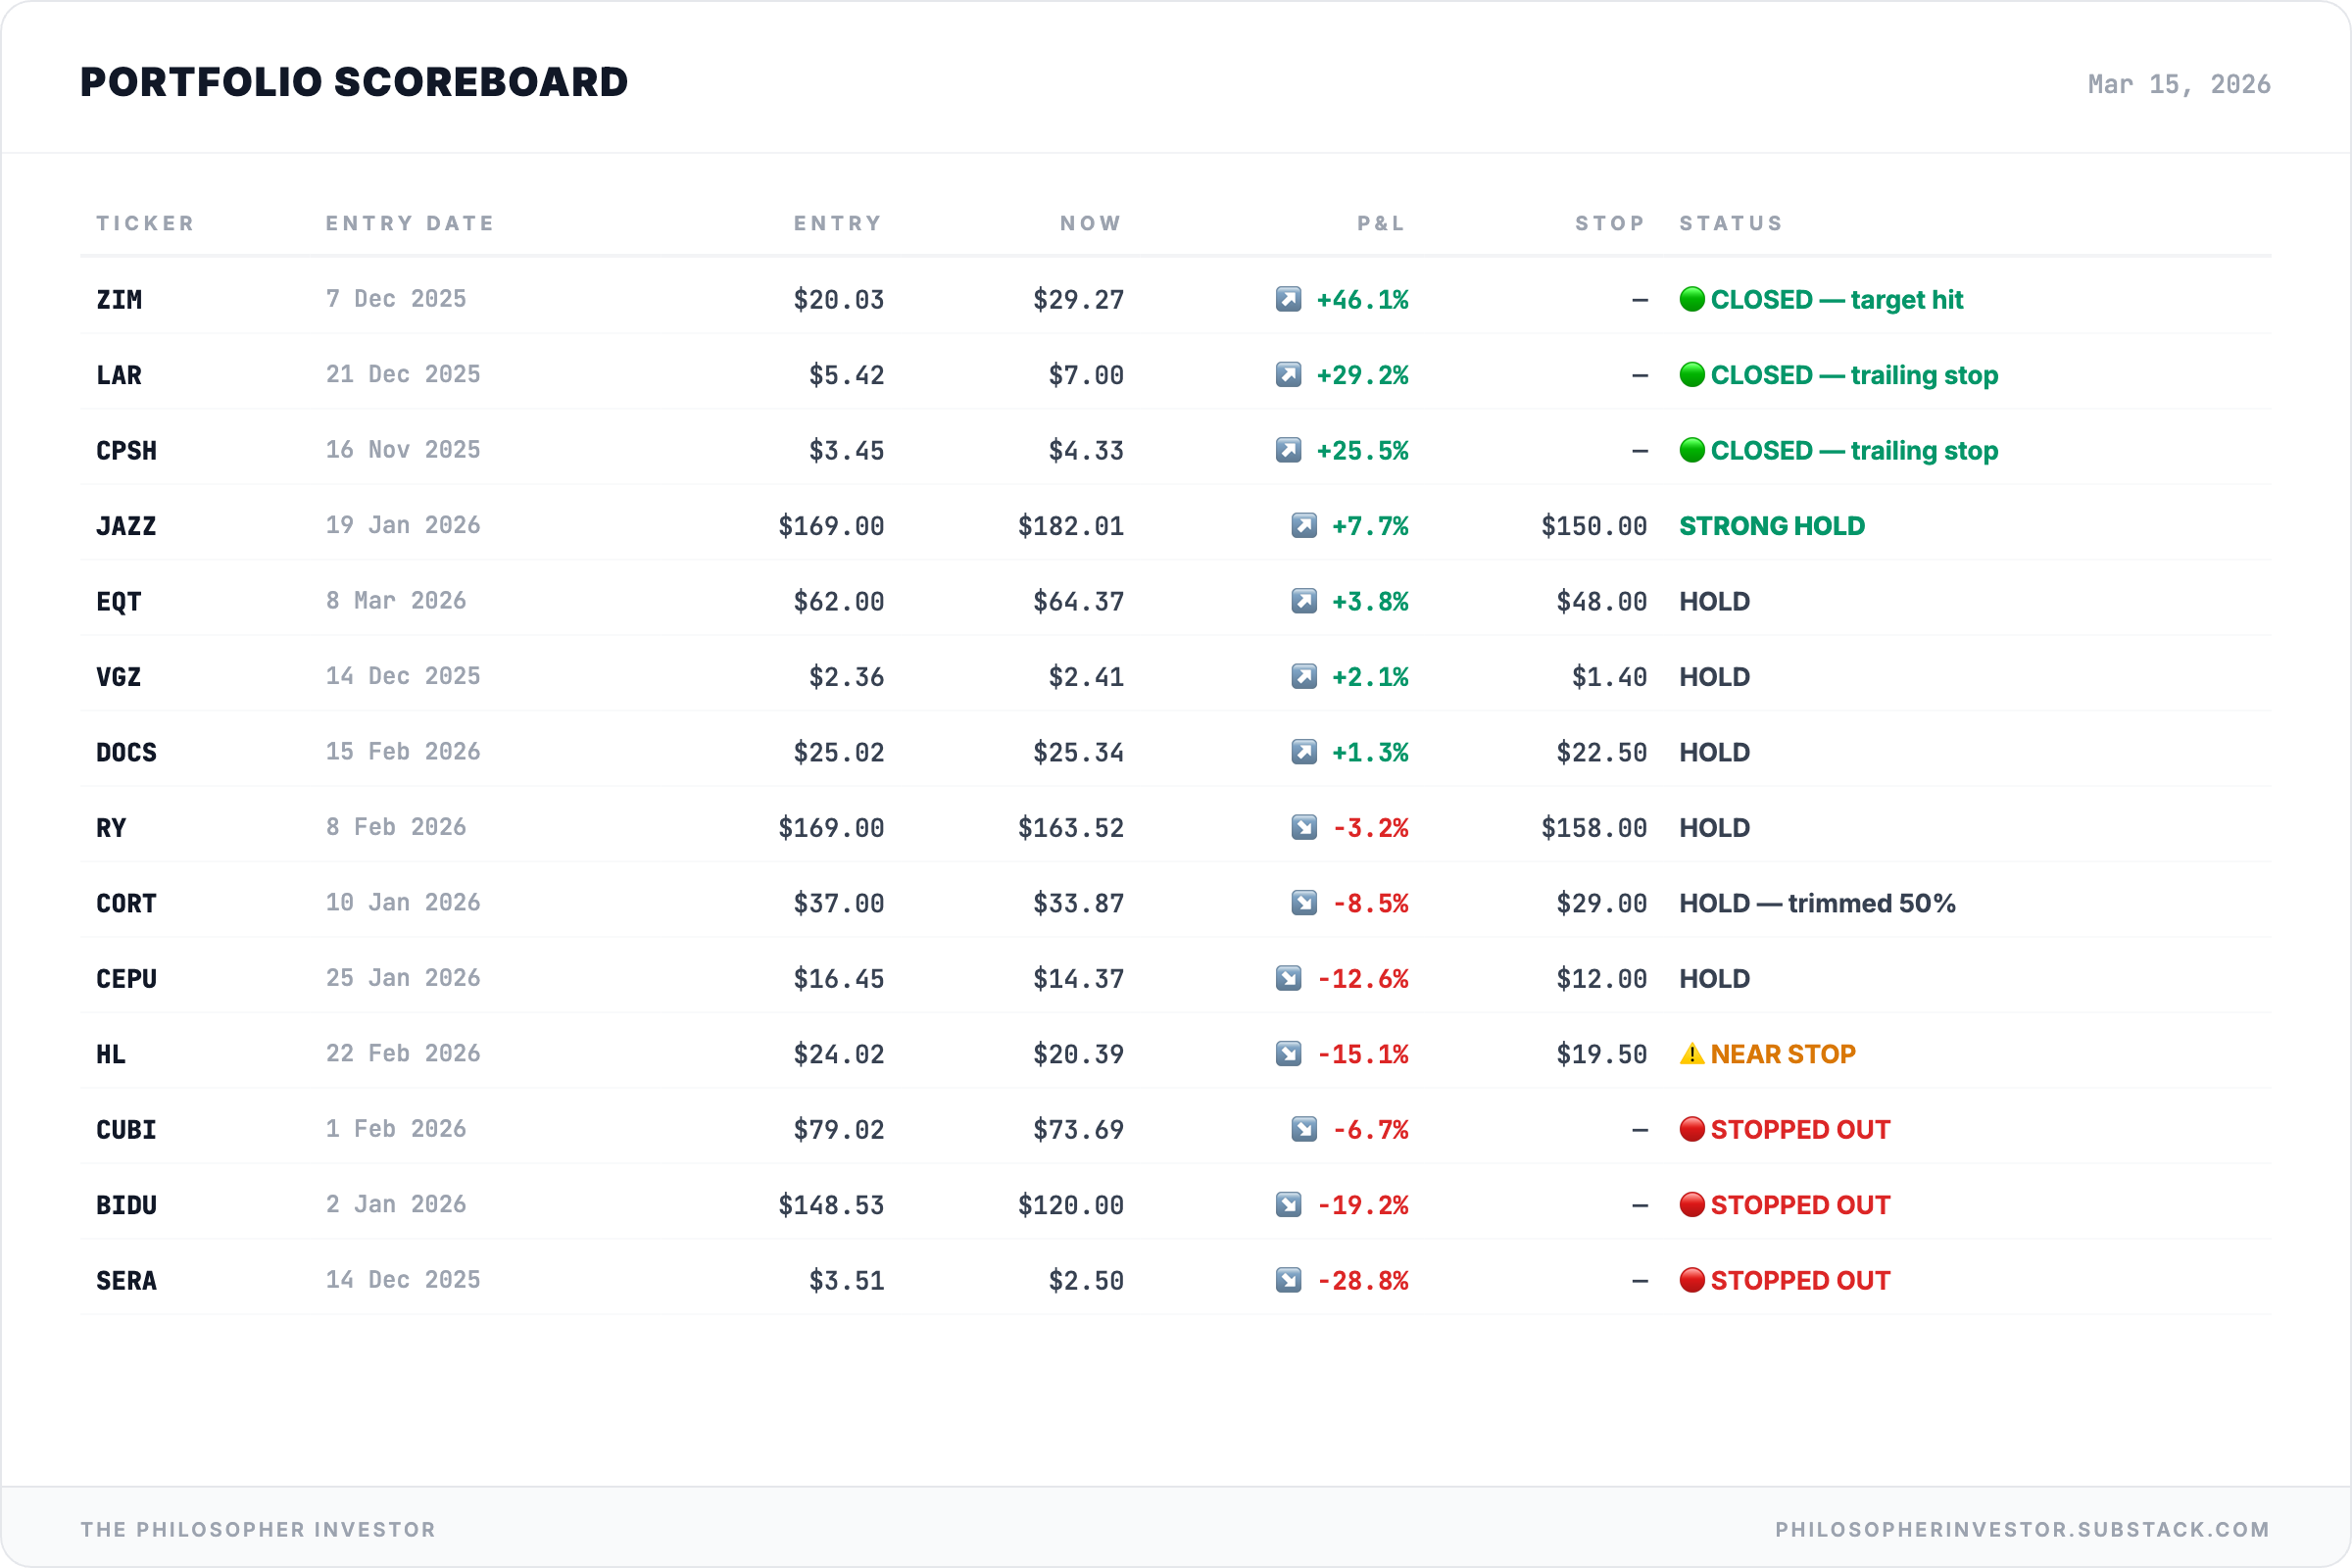
EQT is the Hormuz play. Largest US natural gas producer, zero hedges, sitting on the right side of the biggest energy disruption in years. Stop is wide at $48 because this is a geopolitical catalyst trade. Targets: $70, then $80-85 if the disruption persists.
HL is the one to watch. Sitting -15% with the stop at $19.50. If it closes below that level next week, we are out. No exceptions. The original write-up flagged $19-20 as the zone where the thesis breaks. We are testing it.
CORT trimmed 50%. Reducing risk while keeping exposure in case it reverses.
What are you watching this week? Reply to this email. I read every one.
See you next week.
Disclaimer
This newsletter is for educational and informational purposes only. It is not financial advice.
The content reflects personal opinions shared publicly as a journal. Trading stocks, options, futures, or any financial instrument involves significant risk. You can lose your entire investment. There is no guarantee of profit.
The author is not a registered investment advisor, broker, or financial professional with any regulatory authority including the SEC or CFTC. Always consult a licensed financial advisor before making any investment decisions.
By reading this newsletter, you accept full responsibility for your own trading and investment choices. Past performance does not guarantee future results. Markets are unpredictable.
Screenshots are courtesy of TradingView, VixCentral, and other platforms with which the author has no affiliation. Information shared may contain errors or become outdated quickly.
This content is the intellectual property of the author. Copying or redistributing without permission is prohibited.
By continuing to read, you acknowledge and accept these terms.
Read the desk every week
Market analysis in plain English, plus the app that scans the whole US market for you.
Become a member Read the original on Substack ↗