Buffett's Largest Cash Position Ever. Tudor Calling Top. The Market Made New Highs.
Market Recap — May 3rd 2026
2026-05-03 · 9 min read · Originally published on Substack ↗

TL;DR
Most defensive I have been in eleven weeks. Closed my biggest winners. Cash heavier than at any point this year.
The S&P made new highs while bonds sold for the third week. The yen got rejected hard at 160 on Friday.
Trade of the Week: IREN earnings Thursday. Strongest screener confluence I have seen since BUR in April

Hello my friends,
Ten years in markets, and this one still surprises me.
The S&P fell roughly ten percent. Eleven sessions later, it printed one of the most aggressive V-shape recoveries we have seen.
A podcast I listened to this week made the case cleanly. Roughly thirty percent of every dollar in existence was printed in the last five years.
Imagine the same amount of stocks chased by 30% more dollars. The prices have to go up, even if nothing about the companies changed.
The names who built their careers in markets like this one are not buying the rally.
Buffett sits on the largest cash position in Berkshire’s history.
Paul Tudor Jones has called the market overheated. When two of the sharpest macro minds of the last forty years lean the same way, you cannot ignore it.
Maybe they are wrong. They have been wrong before.
I do not think it is a bad time to take some profits. As the saying goes, nobody ever went broke taking a profit.
With Iran one headline away from re-escalation, with stocks at record highs, I would rather be early than wrong.
This is the edition where I tell you why I closed several winners this week, why I am the most defensive I have been in a while and why the one tactical trade I am running is a screener-validated earnings shot with bounded sizing.
Now let’s get to the data.
To get the most out of these market recaps and understand the framework behind my observations, I encourage you to read about my methodology here.
Market Health
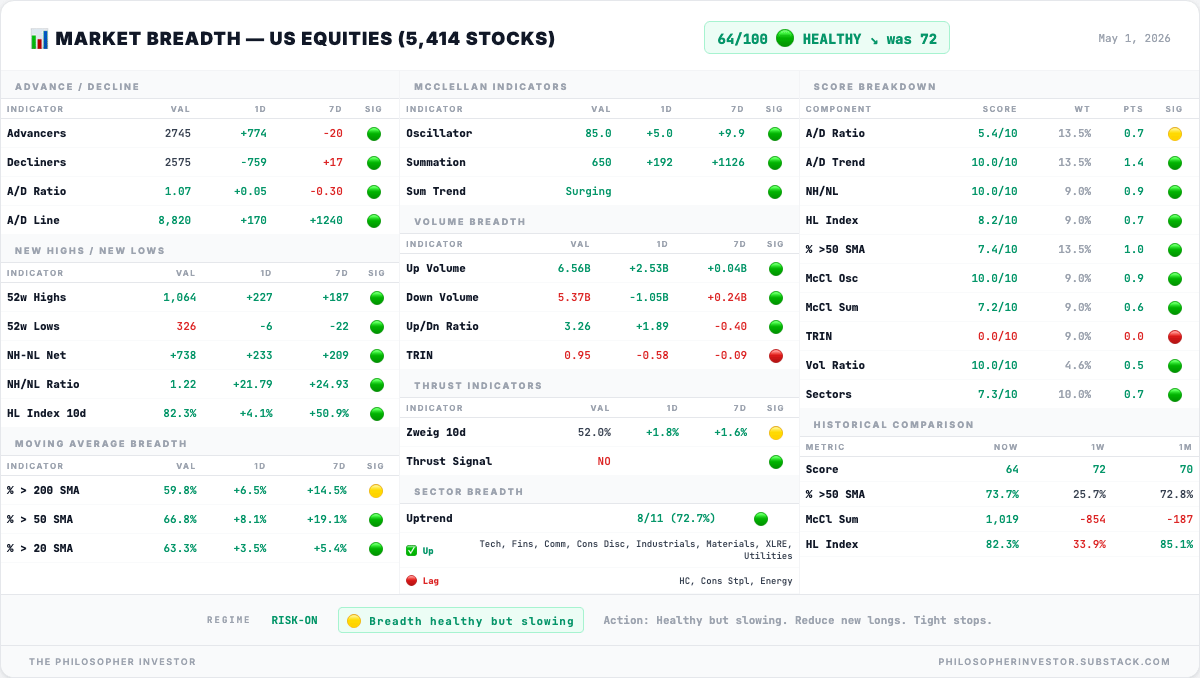
📊 Breadth Score: 64/100 — HEALTHY ✅ (was 72 last week)
Breadth dropped from 72 to 64 this week. An 8-point decline while the index made a new recovery high. The score is still in healthy territory, but the direction is downward. That matters more than the level.
Participation is real but getting weaker. Two-thirds of the 5,414 stocks I track trade above their 50-day moving average. On Friday, slightly more stocks rose than fell. Two weeks ago, the gap between winners and losers was much wider. 1,064 stocks sit within one percent of a 52-week high. Only 326 are near a 52-week low.
But there is a split between short-term momentum and longer-term confirmation. Daily advances are still outnumbering declines, which keeps the McClellan Summation Index rising at 650. The problem is that each daily win is getting smaller. The rally is still moving forward, just with less force.
The other crack is concentration. The five largest S&P 500 names did roughly half the index lift this week. The normal share is closer to one third. When five names do that much of the work, the rally depends on those five names not breaking.
None of these signals is bearish on its own. Participation is real. But it is shrinking at the edges while the index keeps making new highs.
📉 Volatility 16.99 — Fear Collapsed.
The vol complex this week says one thing, and only one. The market is hedging the concentration that drove the rally. It is not hedging a macro tail.
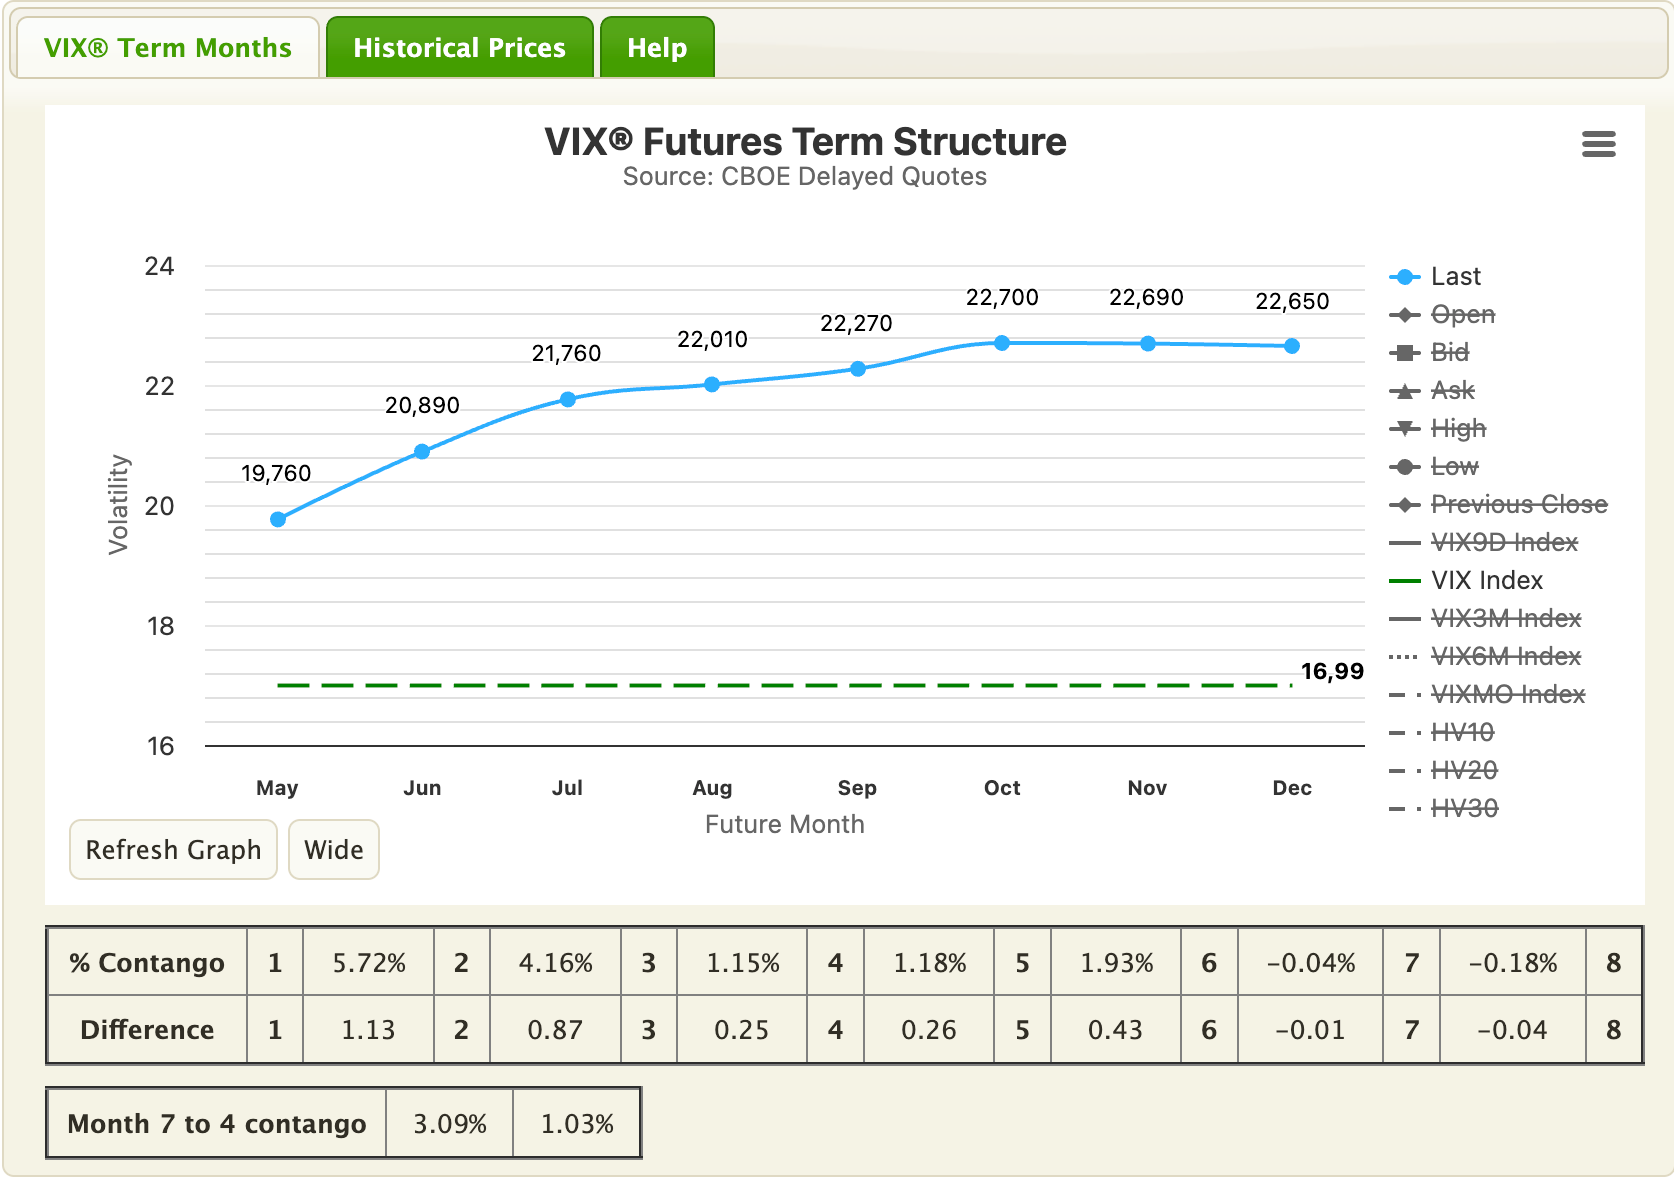
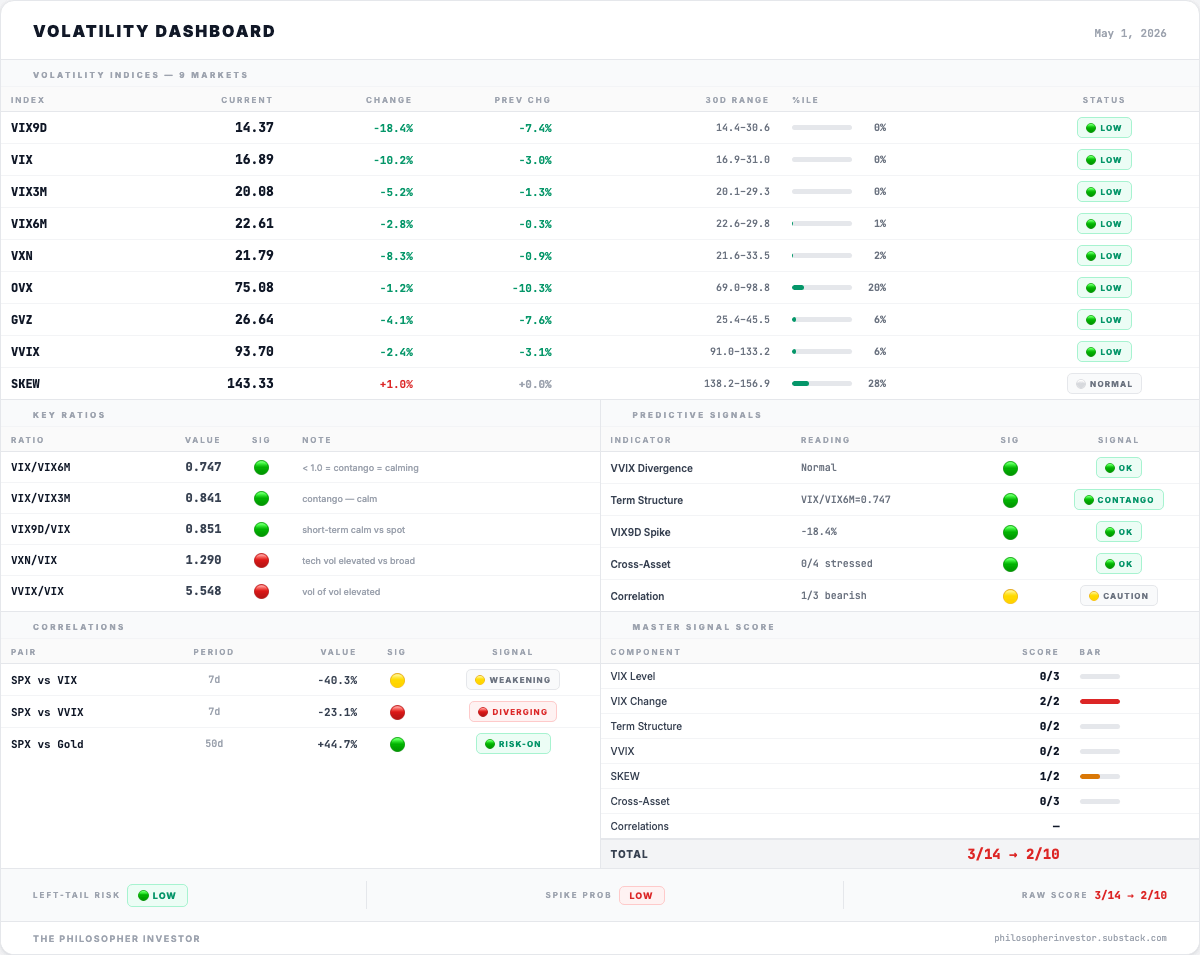
VIX collapsed -10% to 16.99. Clean contango through six months. SKEW closed at 143, technically above the 140 threshold but sitting in the 28th percentile of its historical range.
The two ratios that are firing are:
VVIX/VIX at 5.55: someone is paying elevated premiums for protection against a sharp move higher in vol.
VXN/VIX at 1.29: that protection is concentrated in the same five mega-cap names that did half the weekly index lift.
This is the same dispersion the QQQ/QQQE pair below reads at +2.58σ. The vol market is pricing the concentration.
🔍 Pairs Alignment
Bonds are refusing to follow equities higher. The Fed already met. The bond market is not waiting for the next data point. It is actively pricing a different path than stocks, and it has been doing so for three weeks. That is not a short-term bet. That is a view.
QQQ vs QQQE is showing the same thing. Strip the top five Nasdaq names this week and the remaining ninety-five were closer to flat. The index-level breadth is coming from five stocks, not from broad participation.
QQQ vs IWM: tech outperforming small caps for the fourth consecutive week. Small caps are the most sensitive to lower rates and domestic growth. Their underperformance during a week where vol collapsed says the soft-landing trade is not being bought outside of mega-caps.
SPY vs UUP: stocks rallying while the dollar holds firm. Three weeks running. A strong dollar with strong stocks typically means foreign capital is flowing into the largest, most liquid US names.
💱 FX USDJPY — A Sharp Rejection
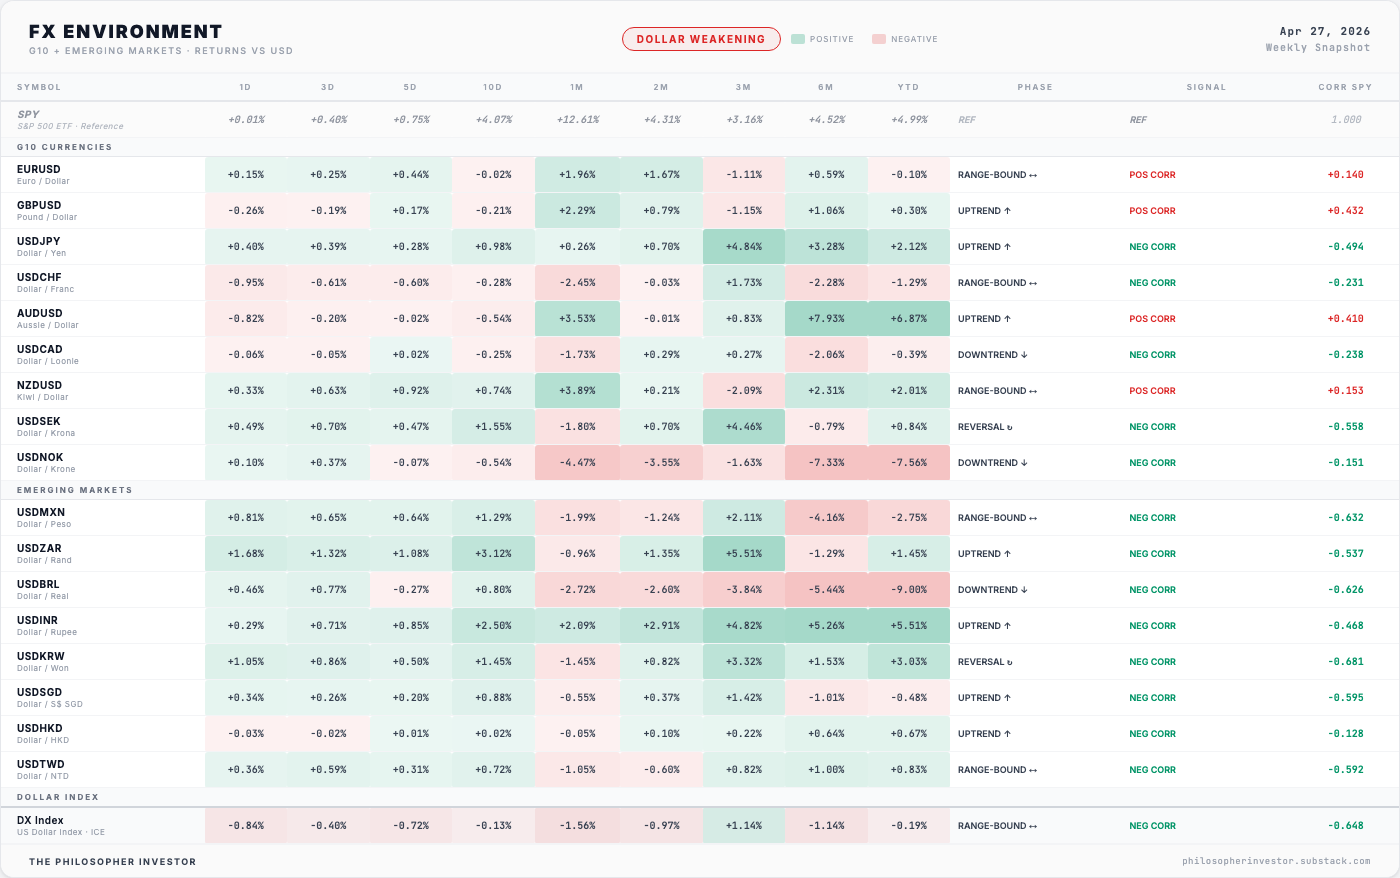
Last week I flagged the yen as the most important chart. The BoJ was not hawkish enough. The yen kept weakening through the week and tested 160 before printing a sharp single-session reversal to 157.
Touching 160 is not casual. It is the zone Japanese authorities defended with documented FX intervention in 2024, and the level where Ministry of Finance rhetoric turns from “watching closely” to “ready to act.”
Whether Friday’s reversal was intervention rhetoric, actual intervention, or a positioning unwind, the chart now shows a clear rejection at 160 and the first meaningful directional change in weeks.
160 rejections come in two flavors. The kind that hold for two months. The kind that break 152 in three weeks. We do not yet know which one this is.
Through 155, the risk changes nature. A strong yen forces carry trade unwinds funds that borrowed cheap yen to buy US assets have to sell those assets to repay the loan. That is how a currency move becomes forced selling across US equities. The regime moves from hedging concentration to hedging contagion.
Above 158 with MoF backing off, the carry trade rebuilds and the yen stops being the pivot.
We sit at 157, mid-range between the 152 dip a few weeks ago and the 160 ceiling that just printed its sharpest rejection in months.”
🚨 Sector Rotation
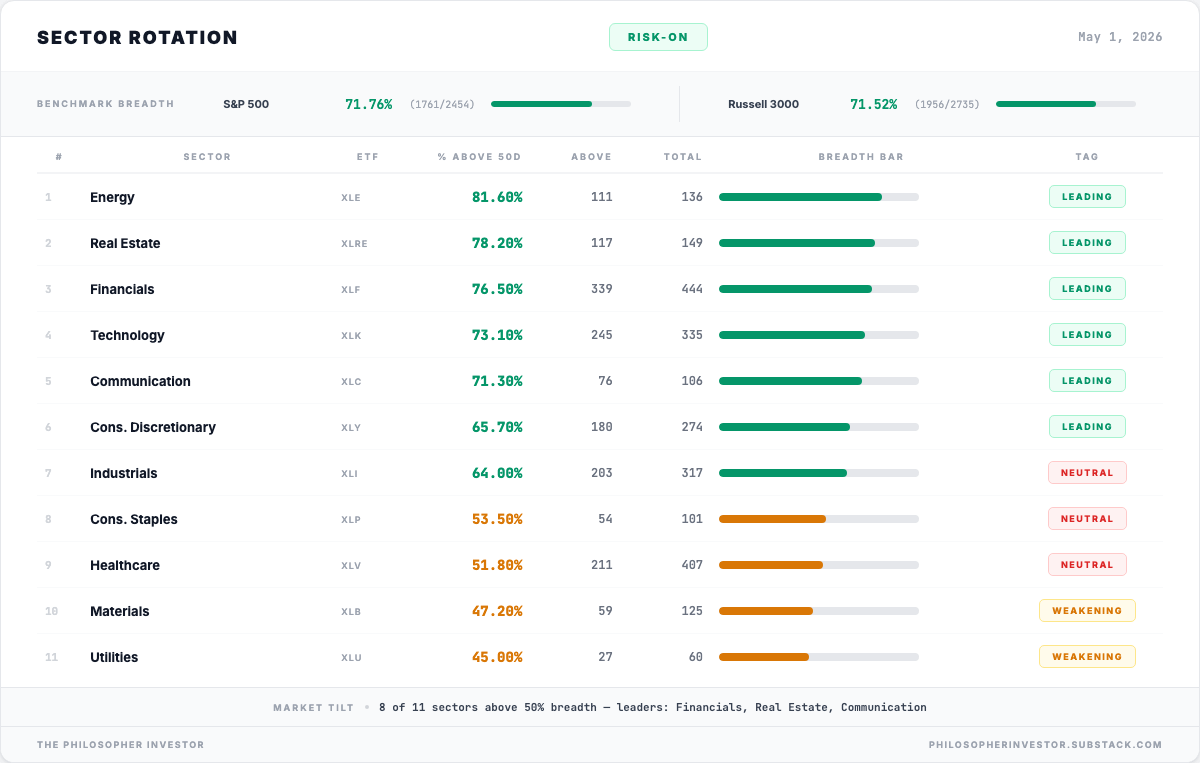
Eight of eleven S&P sectors are in healthy shape this week, meaning more than half the stocks in each sector trade above their 50-day moving average. Across the whole market, about 72% of S&P 500 stocks are trading above that line, and the Russell 3000 reads almost the same at 71.5%. That is broad participation, not a narrow rally.
The leadership is wide. Energy is the strongest with 82% of its names in uptrends, followed by Real Estate at 78%, Financials at 77%,Technology at 73%, Communication at 71% and Consumer Discretionary at 66%. Only Materials and Utilities sit below the 50% line, and neither of those decides the regime.
This is where the sector view and the pairs view appear to disagree. The pairs section flagged QQQ vs equal-weight QQQ at +2.58σ as a concentration warning, meaning the rally is being carried by a handful of mega-caps. The sector view shows the opposite: broad participation across eleven sectors. Both are true because they measure different things. Again, the concentration risk lives at the index level. The participation lives at the sector level.
The detail to watch is Consumer Discretionary versus Consumer Staples. Discretionary names are leading at 66% breadth, Staples are flat at 54%. When investors buy non-essential goods stocks faster than defensive ones, that is bullish. If that gap narrows, the bear case gets its confirmation. If it widens, the rally has the breadth to keep extending despite the mega-cap concentration the vol market is pricing.
🧠 My Take
The dashboard tells two stories this week and both are real.
The first is concentration. The vol market is pricing protection on the five mega-caps that drove this rally. Bonds have refused to follow stocks higher for three weeks running. The cap-weighted Nasdaq is pulling away from equal-weighted, the widest gap in months. The yen tested 160 and was rejected hard back to 157 in a single session. Every one of those signals points bearish on a 30 to 60 day horizon.
The second is participation. 72% of S&P stocks trade above their 50-day average and eight of eleven sectors are in healthy shape. Consumer Discretionary sits twelve points of breadth above Consumer Staples, which is bullish.
Both readings are honest because they measure different things. The concentration risk lives at the index level, inside a heavily weighted handful of names.
What decides which story wins:
For the bull case, the broad sector breadth has to absorb a potential mega-cap dispersion event, the bond market has to be wrong about the rate path it is pricing, and the yen has to hold above 155 without forcing a carry unwind.
For the bear case, the mega-cap concentration has to actually break, the yen rejection at 160 has to cascade lower, and the Discretionary-Staples gap has to compress.
Where I sit personally: I lean bear. I am selling into strength, closing my winners, and watching for any sign that the concentration cracks. I am probably early. The sector breadth could absorb the risk for another four to six weeks. But I would rather be early than late.
🔥 Trade of the Week:
Five of my screeners flagged IREN this week, and the two highest-conviction ones are firing together. That combination does not happen often.
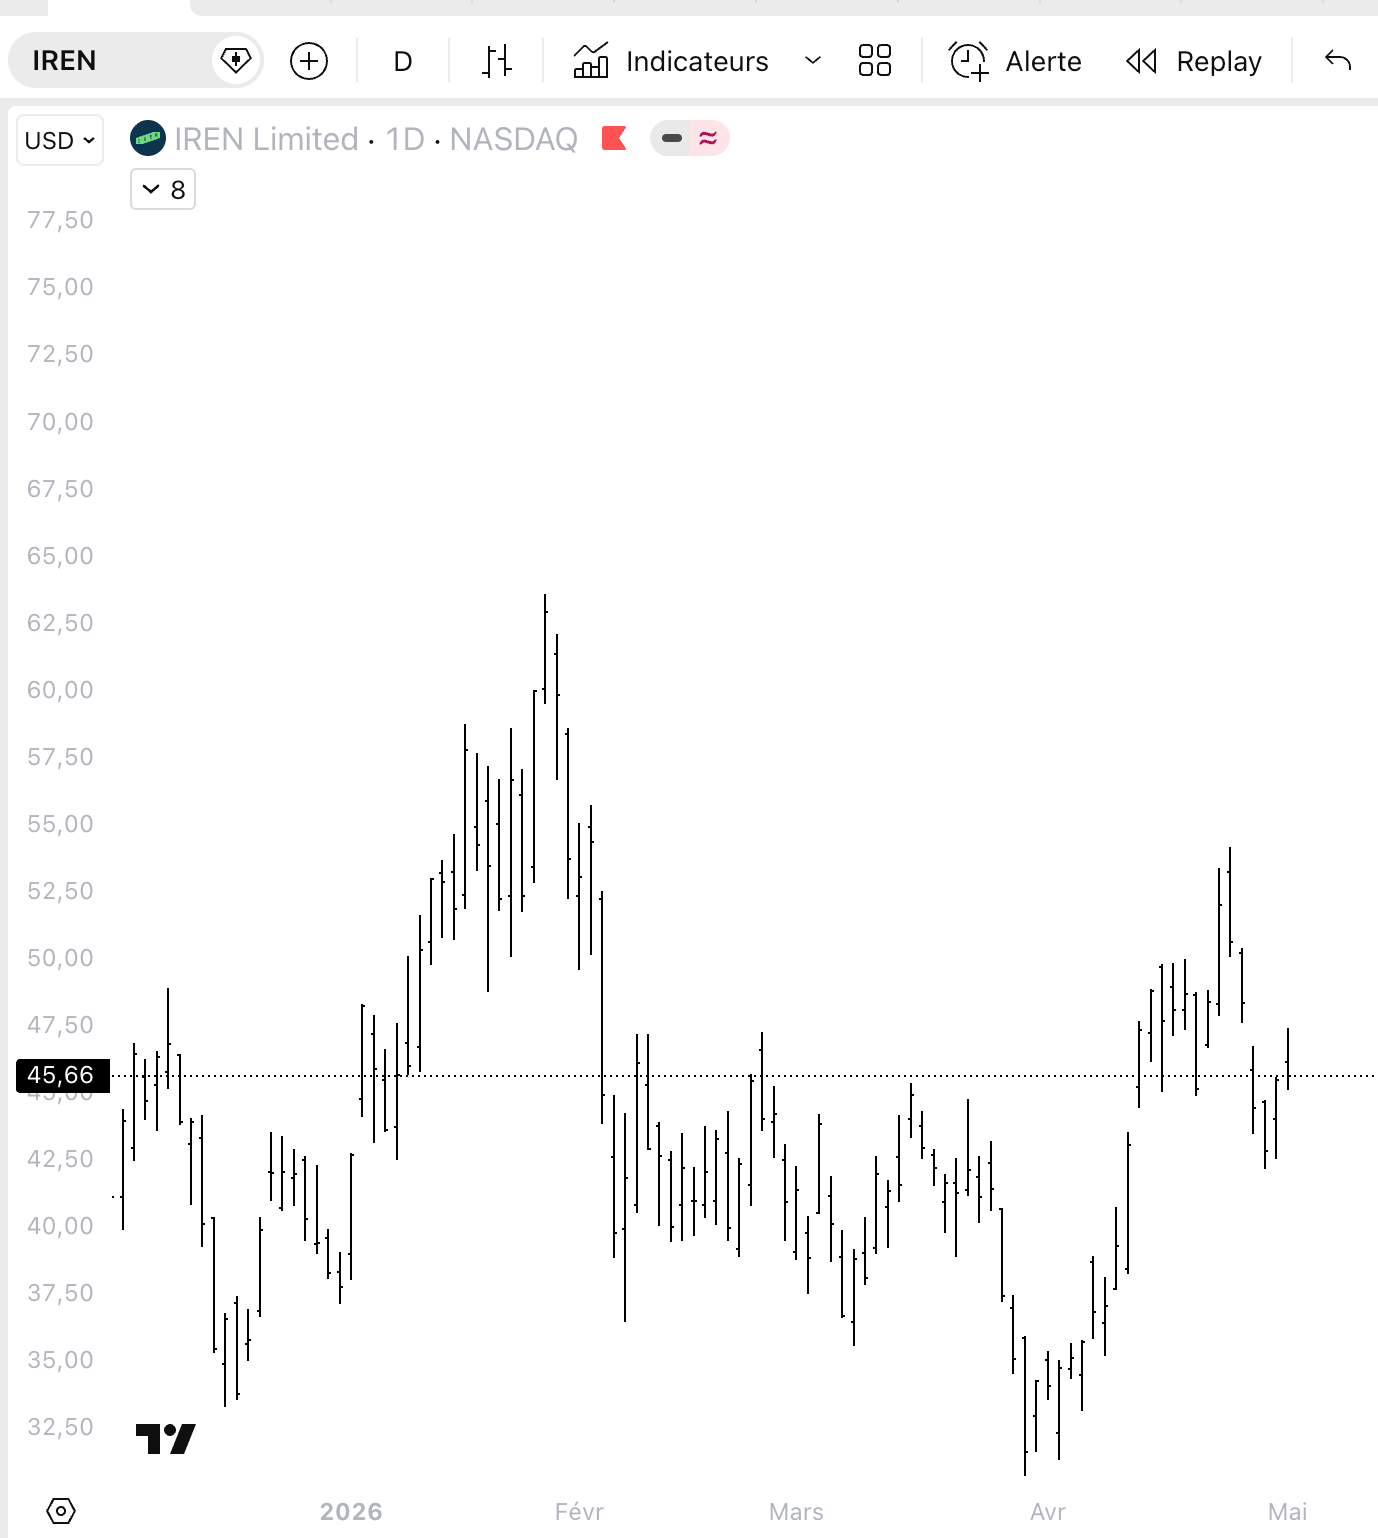
IREN closed Friday at $45.66, sitting on a clean consolidation pattern. Net options flow was +$2.3M bullish on the week, with two large call sweeps on May 8 and May 15 strikes against modest put hedging. Smart money is leaning long into the print, with size and on the front end of the curve.
The Sweetwater 1 site, the 1.4GW first phase of a planned 2GW campus, was energized this past week on schedule. Execution is slowly de-risking. Dilution remains the open question.
Earnings drop Thursday May 7 after the close. Implied vol on the front-end options is too high to justify buying premium ahead of the print. That is why I am playing this trade in spot, not in options.
The setup:
Entry: $44 to $46 (current spot $45.66)
Stop: $40
Target 1: $52
Target 2: $60
Sizing: 2-3% of book
🎯 Portfolio Performance
I share entry levels, stops, and targets. I don’t take every position I flag. Position sizes are yours to decide based on your own risk tolerance. This is a model portfolio updated weekly at Friday’s close. My personal positions may differ in timing and sizing.
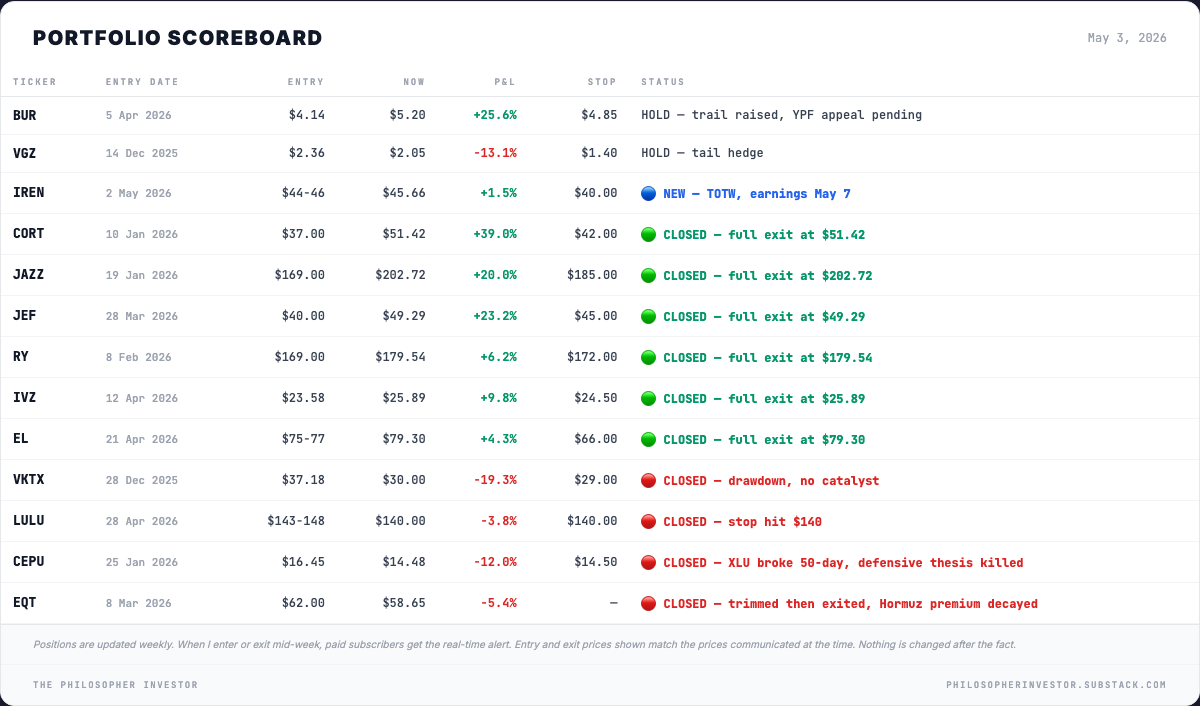
CORT closed at $51.42 (+39%), JAZZ at $202.72 (+20%), JEF at $49.29 (+23.2%).
All three runners monetized at strength.
That decision costs upside if the rally keeps extending. It saves the book if the concentration story the rest of the dashboard is flagging actually breaks.
RY, IVZ, and EL closed flat to modestly green.
VKTX closed at -19.3% without a specific catalyst, the drawdown wider than I am willing to defend without a thesis.
LULU stopped at $140 during the week from the $143-148 entry. The setup-driven exception did not hold. The stop did its job.
BUR at +25.6% is the only directional long that survives. Kept because the YPF appeal is an idiosyncratic catalyst that sits independent of the macro stack.
VGZ kept as the gold tail hedge by design.
IREN at $45.66 is the only new add at 2-3% of book, ahead of Thursday earnings where five of my screeners flagged the same name in the same week and the highest-conviction combo in my system lit up with its strongest historical edge profile.
Cash is the heaviest it has been at any point this year.
See you next week,
Daniel
Disclaimer
This newsletter is for educational and informational purposes only. It is not financial advice.
The content reflects personal opinions shared publicly as a journal. Trading stocks, options, futures, or any financial instrument involves significant risk. You can lose your entire investment. There is no guarantee of profit.
The author is not a registered investment advisor, broker, or financial professional with any regulatory authority including the SEC or CFTC. Always consult a licensed financial advisor before making any investment decisions.
By reading this newsletter, you accept full responsibility for your own trading and investment choices. Past performance does not guarantee future results. Markets are unpredictable.
Screenshots are courtesy of TradingView, VixCentral, and other platforms with which the author has no affiliation. Information shared may contain errors or become outdated quickly.
This content is the intellectual property of the author. Copying or redistributing without permission is prohibited.
By continuing to read, you acknowledge and accept these terms.
Read the desk every week
Market analysis in plain English, plus the app that scans the whole US market for you.
Become a member Read the original on Substack ↗