Every Signal Is Green. The Smart Money Is Hedging.
Market Recap — April 19th 2026
2026-04-19 · 11 min read · Originally published on Substack ↗
TL;DR
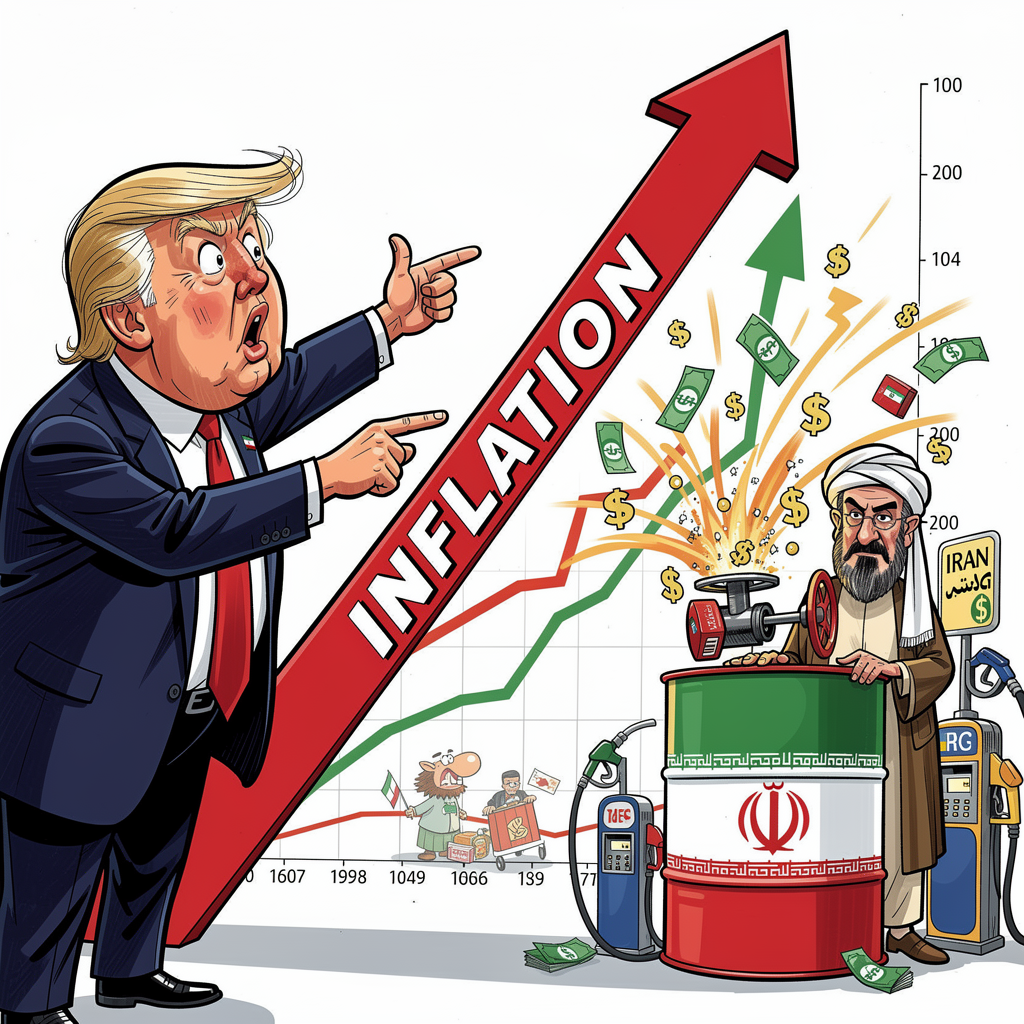
CPI at +3.3% headline. The market ignored it and ripped on the ceasefire instead.
If the tape is this green, why is every institutional option print a put?
Trade of the Week: Estée Lauder (EL). Binary event layer on the Puig merger.

Hello my friends,
I have recently started using Polymarket more often.
The contract for “Fed cuts at least twice in 2026” was pricing ~35%. Not a 60% conviction that rates come down. Not a 20% whisper that they won’t. Roughly one in three: the exact odds of a market that doesn’t know whether to trust the disinflation or brace for the next hawkish pivot.
The recession contract sits at 28%. Low enough that nobody is panic-selling, high enough that nobody is buying with both hands either.
The prediction market crowd does not believe in the V-shaped recovery and does not believe in the crash. It believes in the grind.
This tape is RISK-ON on every surface indicator and defensively positioned in every place where real money leaves a fingerprint.
There were actual catalysts underneath: Trump’s ceasefire language with Iran, negotiations on $20B of frozen Iranian funds, a path toward the Strait of Hormuz reopening.
Those moved the tape.
The real question is not whether the catalysts were real, but whether the reaction is proportional to them or amplified far beyond what they justify.
And here is the part that made me scratch my head this week.
CPI printed +3.3% headline, the highest annualized reading since May 2024. Energy up +10.9% month-over-month. Gasoline specifically up +21.2%, the largest single-month gasoline jump on record back to 1967. Both driven by the Iran shocks.
Core came in softer (+2.6%), which is what the market grabbed onto to keep the disinflation narrative alive. But headline at 3.3% in a week where oil is still unresolved is not a benign reading.
The FOMC meets April 28-29. Minutes from the March meeting strengthened the “two-sided” policy language: “several” participants backing a two-sided description in January moved to “some” judging there was a “strong case” for it in March. The direction is clear.
Rate hikes are moving from unthinkable to discussed.
So the question is: if the tape is this green, why is the smart money hedging like it's not?
Market Health
📊 Breadth Score: 72/100
We were at 51 last week.
McClellan Oscillator (a momentum indicator measuring the difference between advancing and declining stocks, smoothed over time) has turned positive. The percentage of stocks above their short-term moving averages jumped a full quartile. Every sub-component of the breadth engine flipped in the same direction inside five sessions.
That is either a thrust or a mean-reversion illusion.
The difference matters because thrusts extend and illusions reverse.
Real participation takes three weeks to build. We have only five days of market going up.
The ceasefire narrative removed the immediate tail risk and gave discretionary money permission to come back. CTA re-leveraging (commodity trading advisors are systematic funds that scale position size up and down based on trend and realized volatility) did the rest.
When realized volatility compresses and trend models flip from red to green, these funds mechanically add exposure. They buy because their risk budget allows them to, not on conviction. And when the ten most-sold names rip 8% in a week because they stopped going down, every breadth and alignment reading repairs mechanically.
Every other section of this letter points back to the same flow.
The fingerprint is everywhere. New highs expanding while the median stock still trades below its 200-day. Short interest on the most-beaten-down names collapsing inside a single week. Sector ETFs that should lead a real broadening (XLF, XLI, IWM) underperforming a regime that should favor them.
What looks like participation is forced short covering plus mechanical re-engagement on top of a geopolitical headline.
📉 Volatility
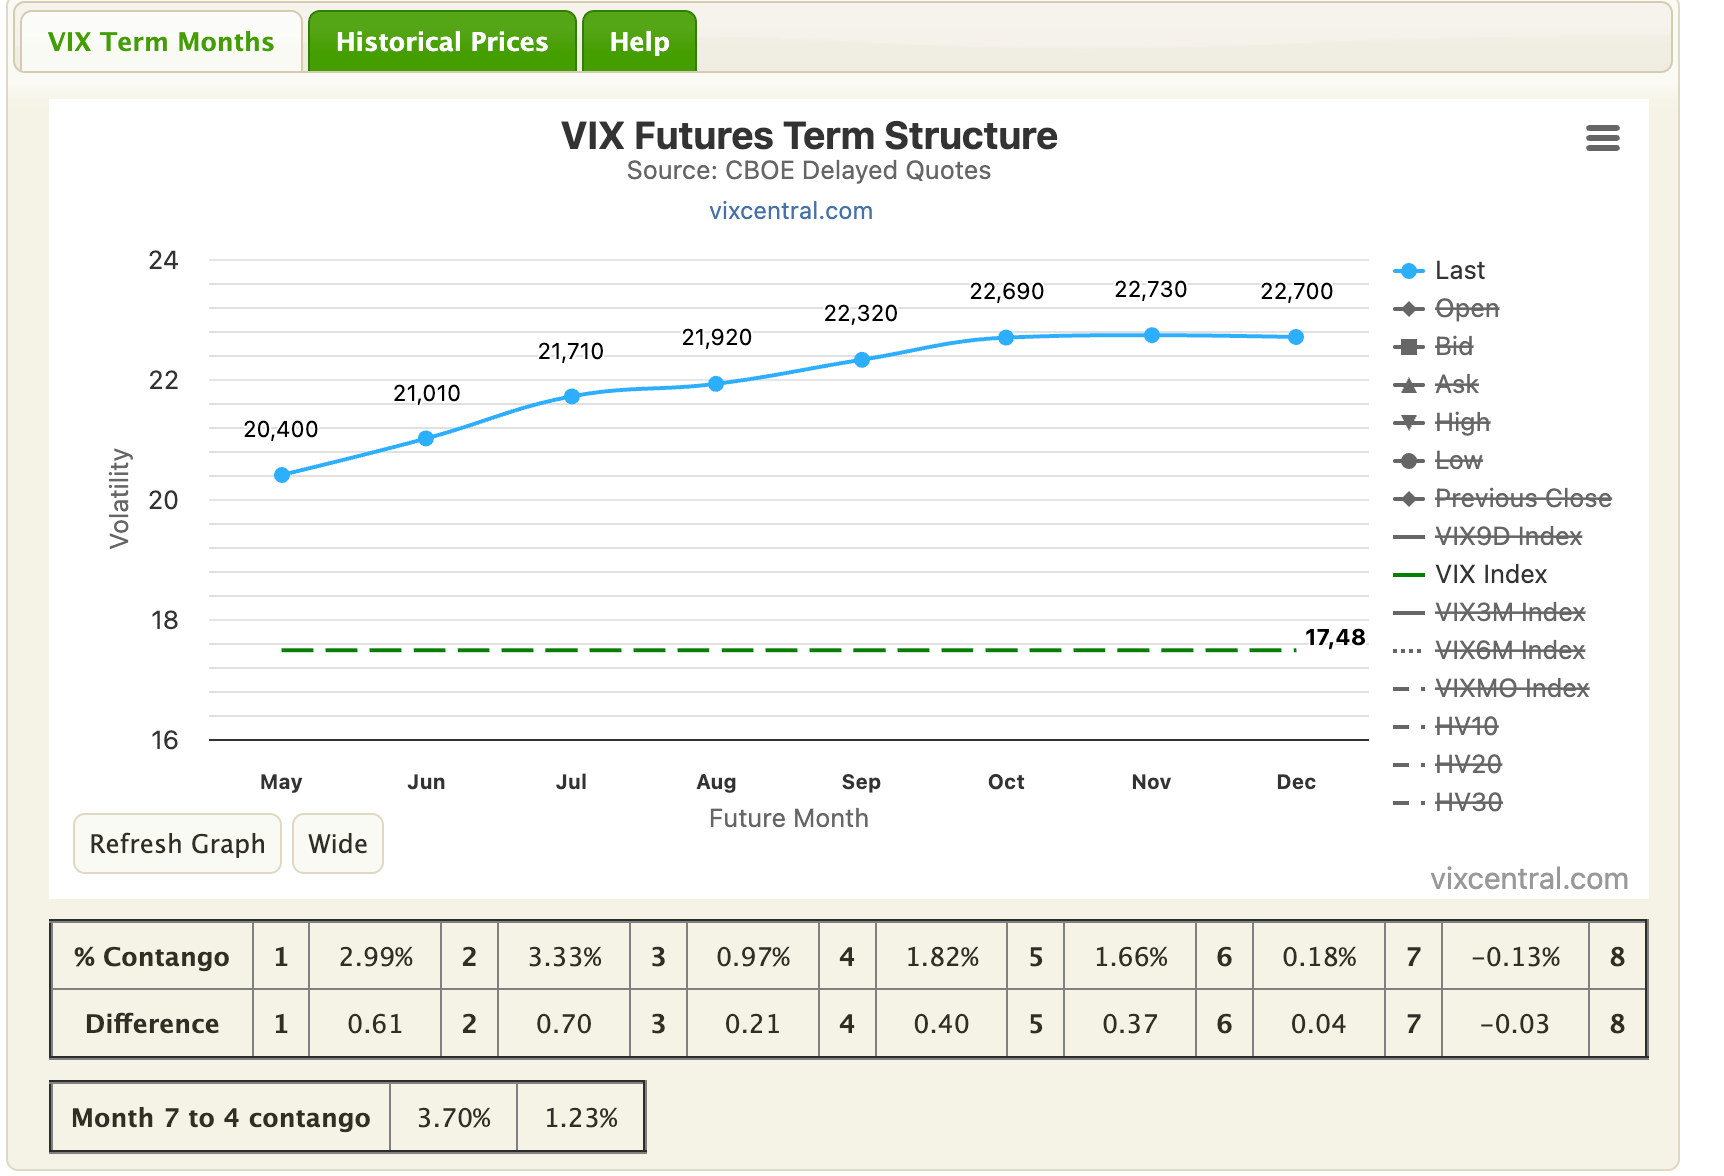
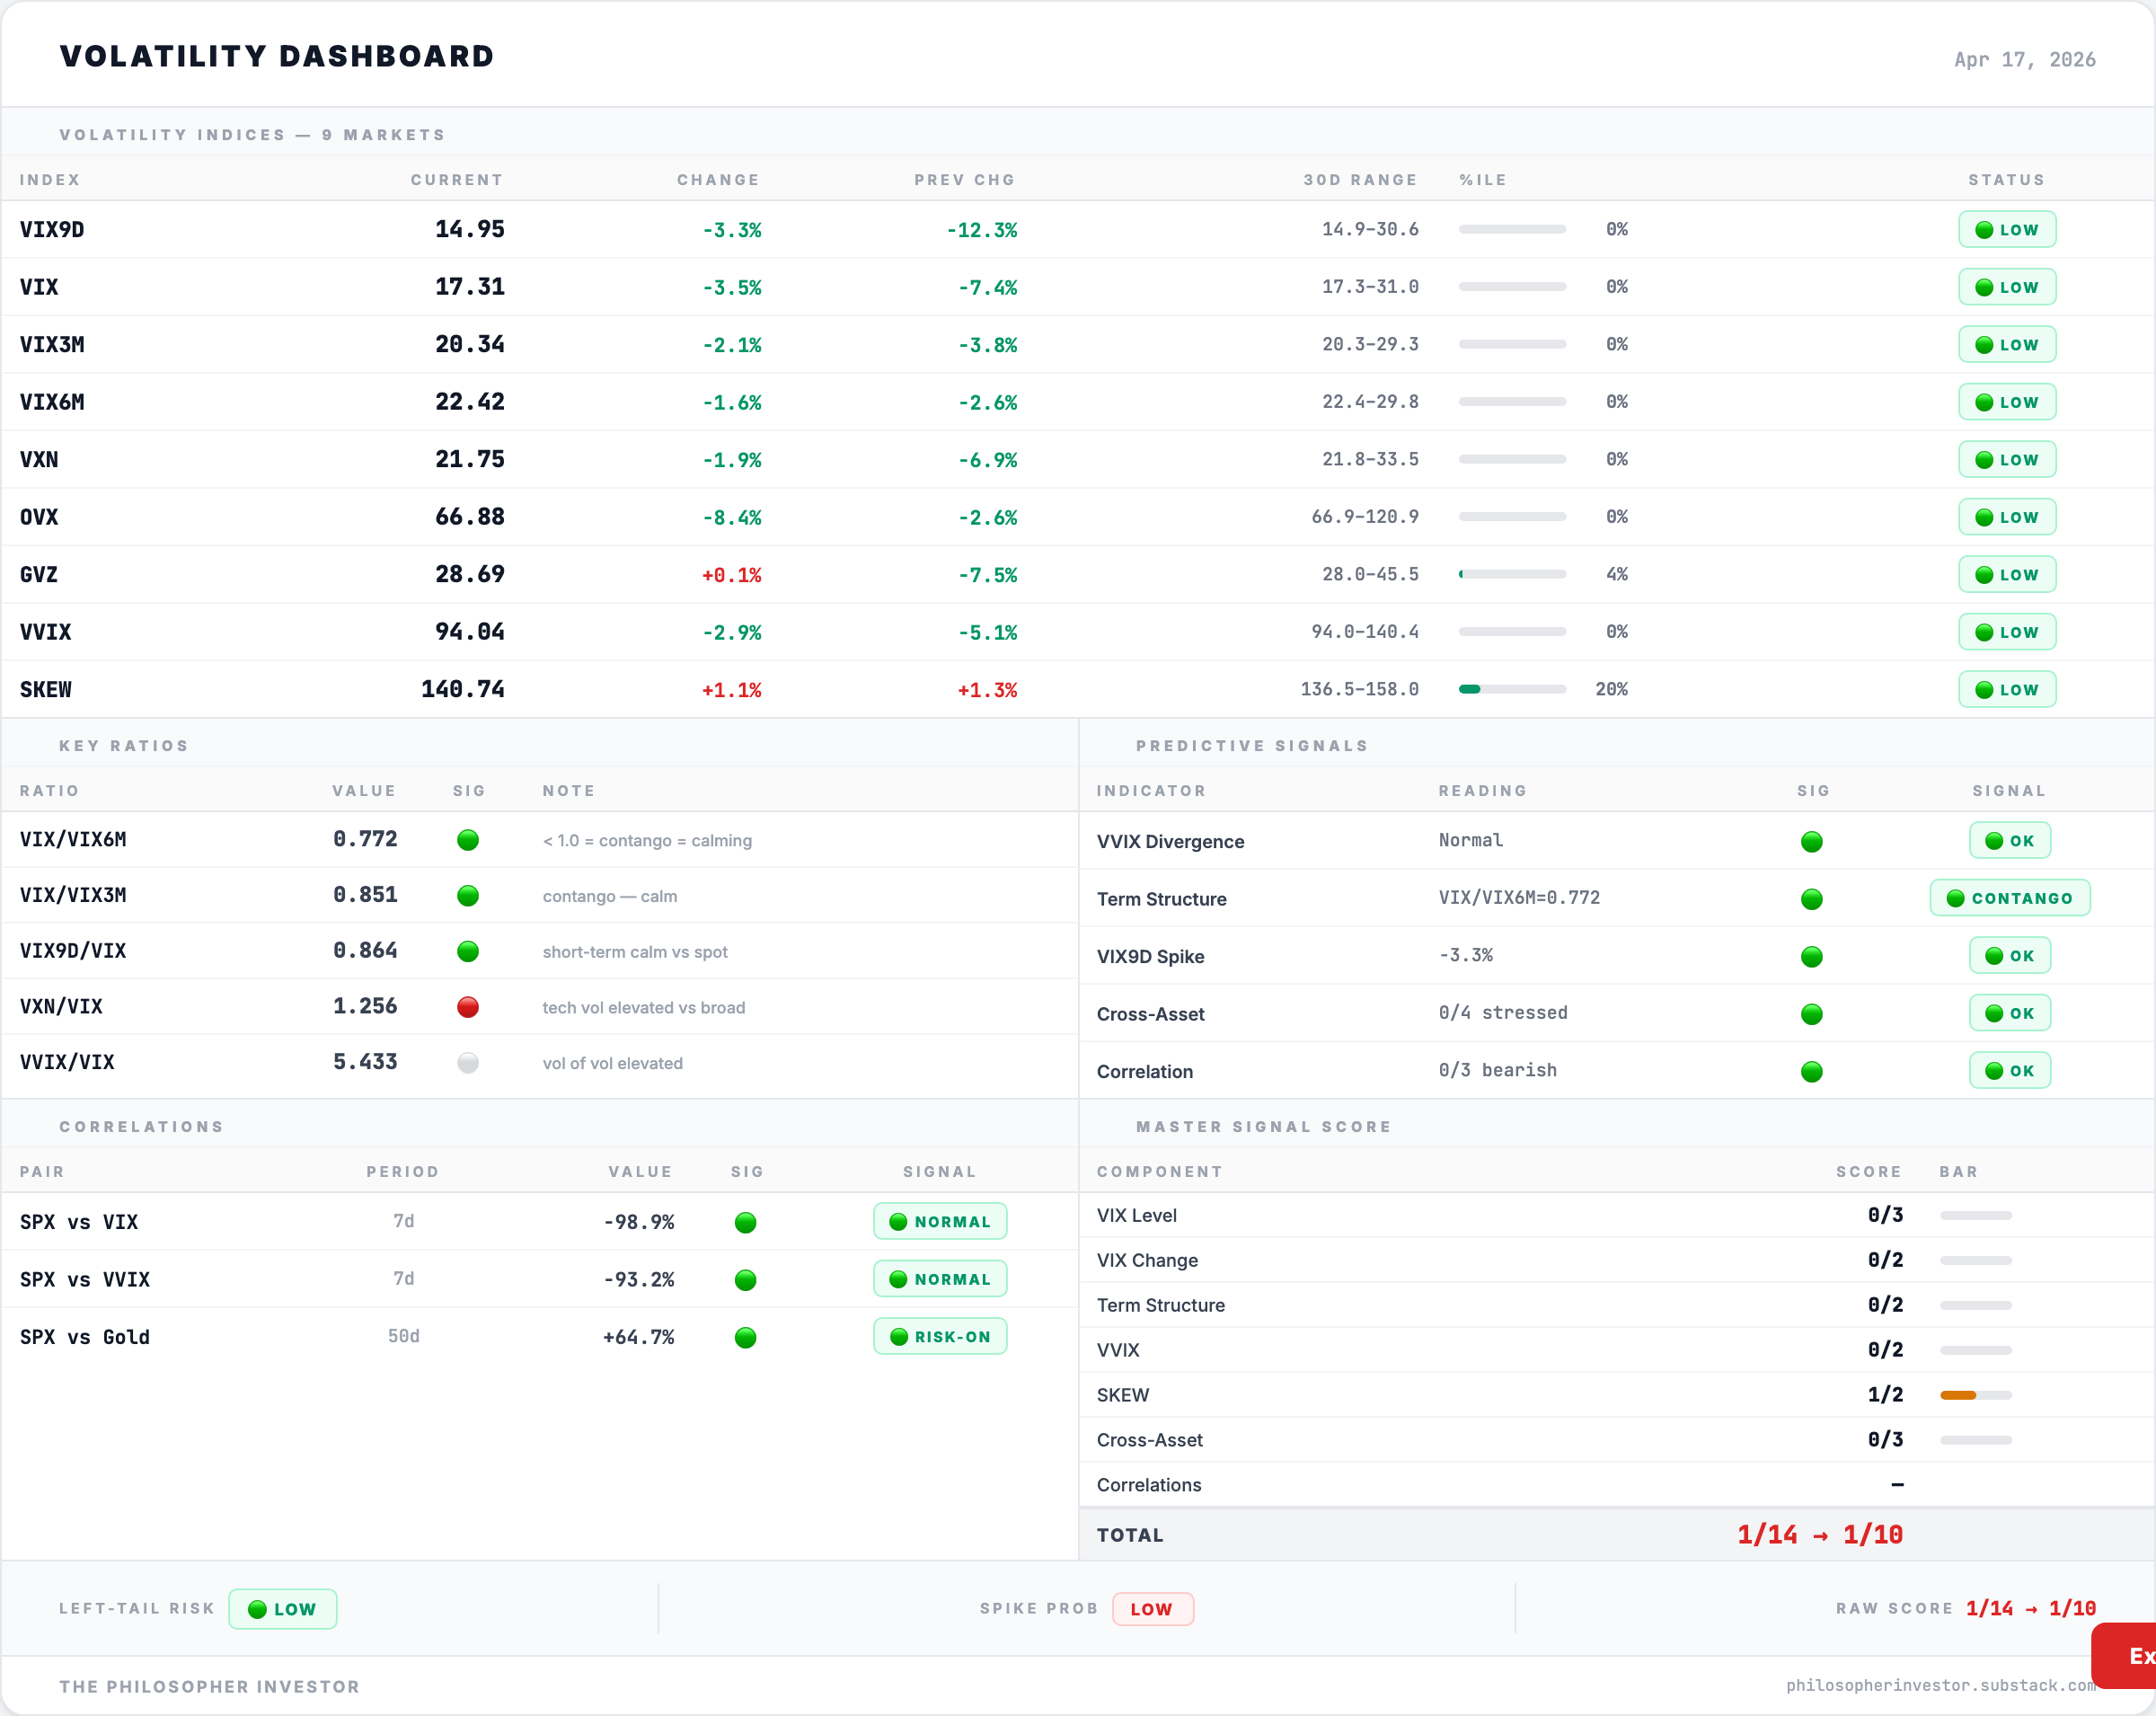
VIX printed 17.48 against roughly 19 a week ago.
The term structure is in contango (the short end of the VIX curve is below the long end, the normal shape of a calm market)
The street is paying up to hold protection past month-end, right through the FOMC and BoJ meetings, while pricing no imminent catalyst in the next two weeks.
🔍 Alignment Score 25/100
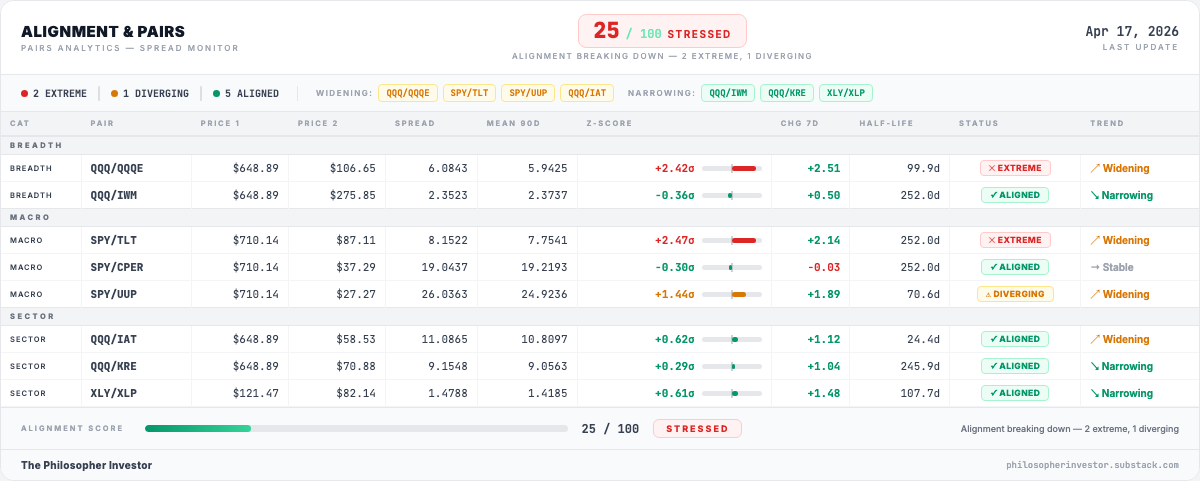
The composite dropped 60 points in five sessions. Five pairs are still in sync but the three that broke are the most macro-relevant relationships in the dashboard, and they all broke the same direction: mega-cap tech pulling away from everything.
🔴 QQQ vs QQQE (mega-cap vs equal-weight Nasdaq). Z = +2.42, EXTREME, widening (+2.51 on the 7-day change). Was +1.90 last week the one pair I flagged as “worth monitoring into earnings.” It did not stabilize. It accelerated through 2-sigma. The top seven Nasdaq names are pulling away from the average Nasdaq stock faster, not slower.
🔴 SPY vs TLT (stocks vs long bonds). Z = +2.47, EXTREME, widening (+2.14). Was +0.69 last week. One of the largest one-week moves on this pair I have seen outside a Fed event. Equities ripped; TLT refused to follow. Either the bond market is wrong about the rate path, or the equity rally is.
🟠 SPY vs UUP (stocks vs dollar). Z = +1.44, DIVERGING, widening (+1.89). Was -0.24 ALIGNED last week. Equities pulling ahead of the dollar by more than a sigma.
The read: both extremes point at the same thing. A rally only seven names are carrying, with the bond market explicitly refusing to validate the move.
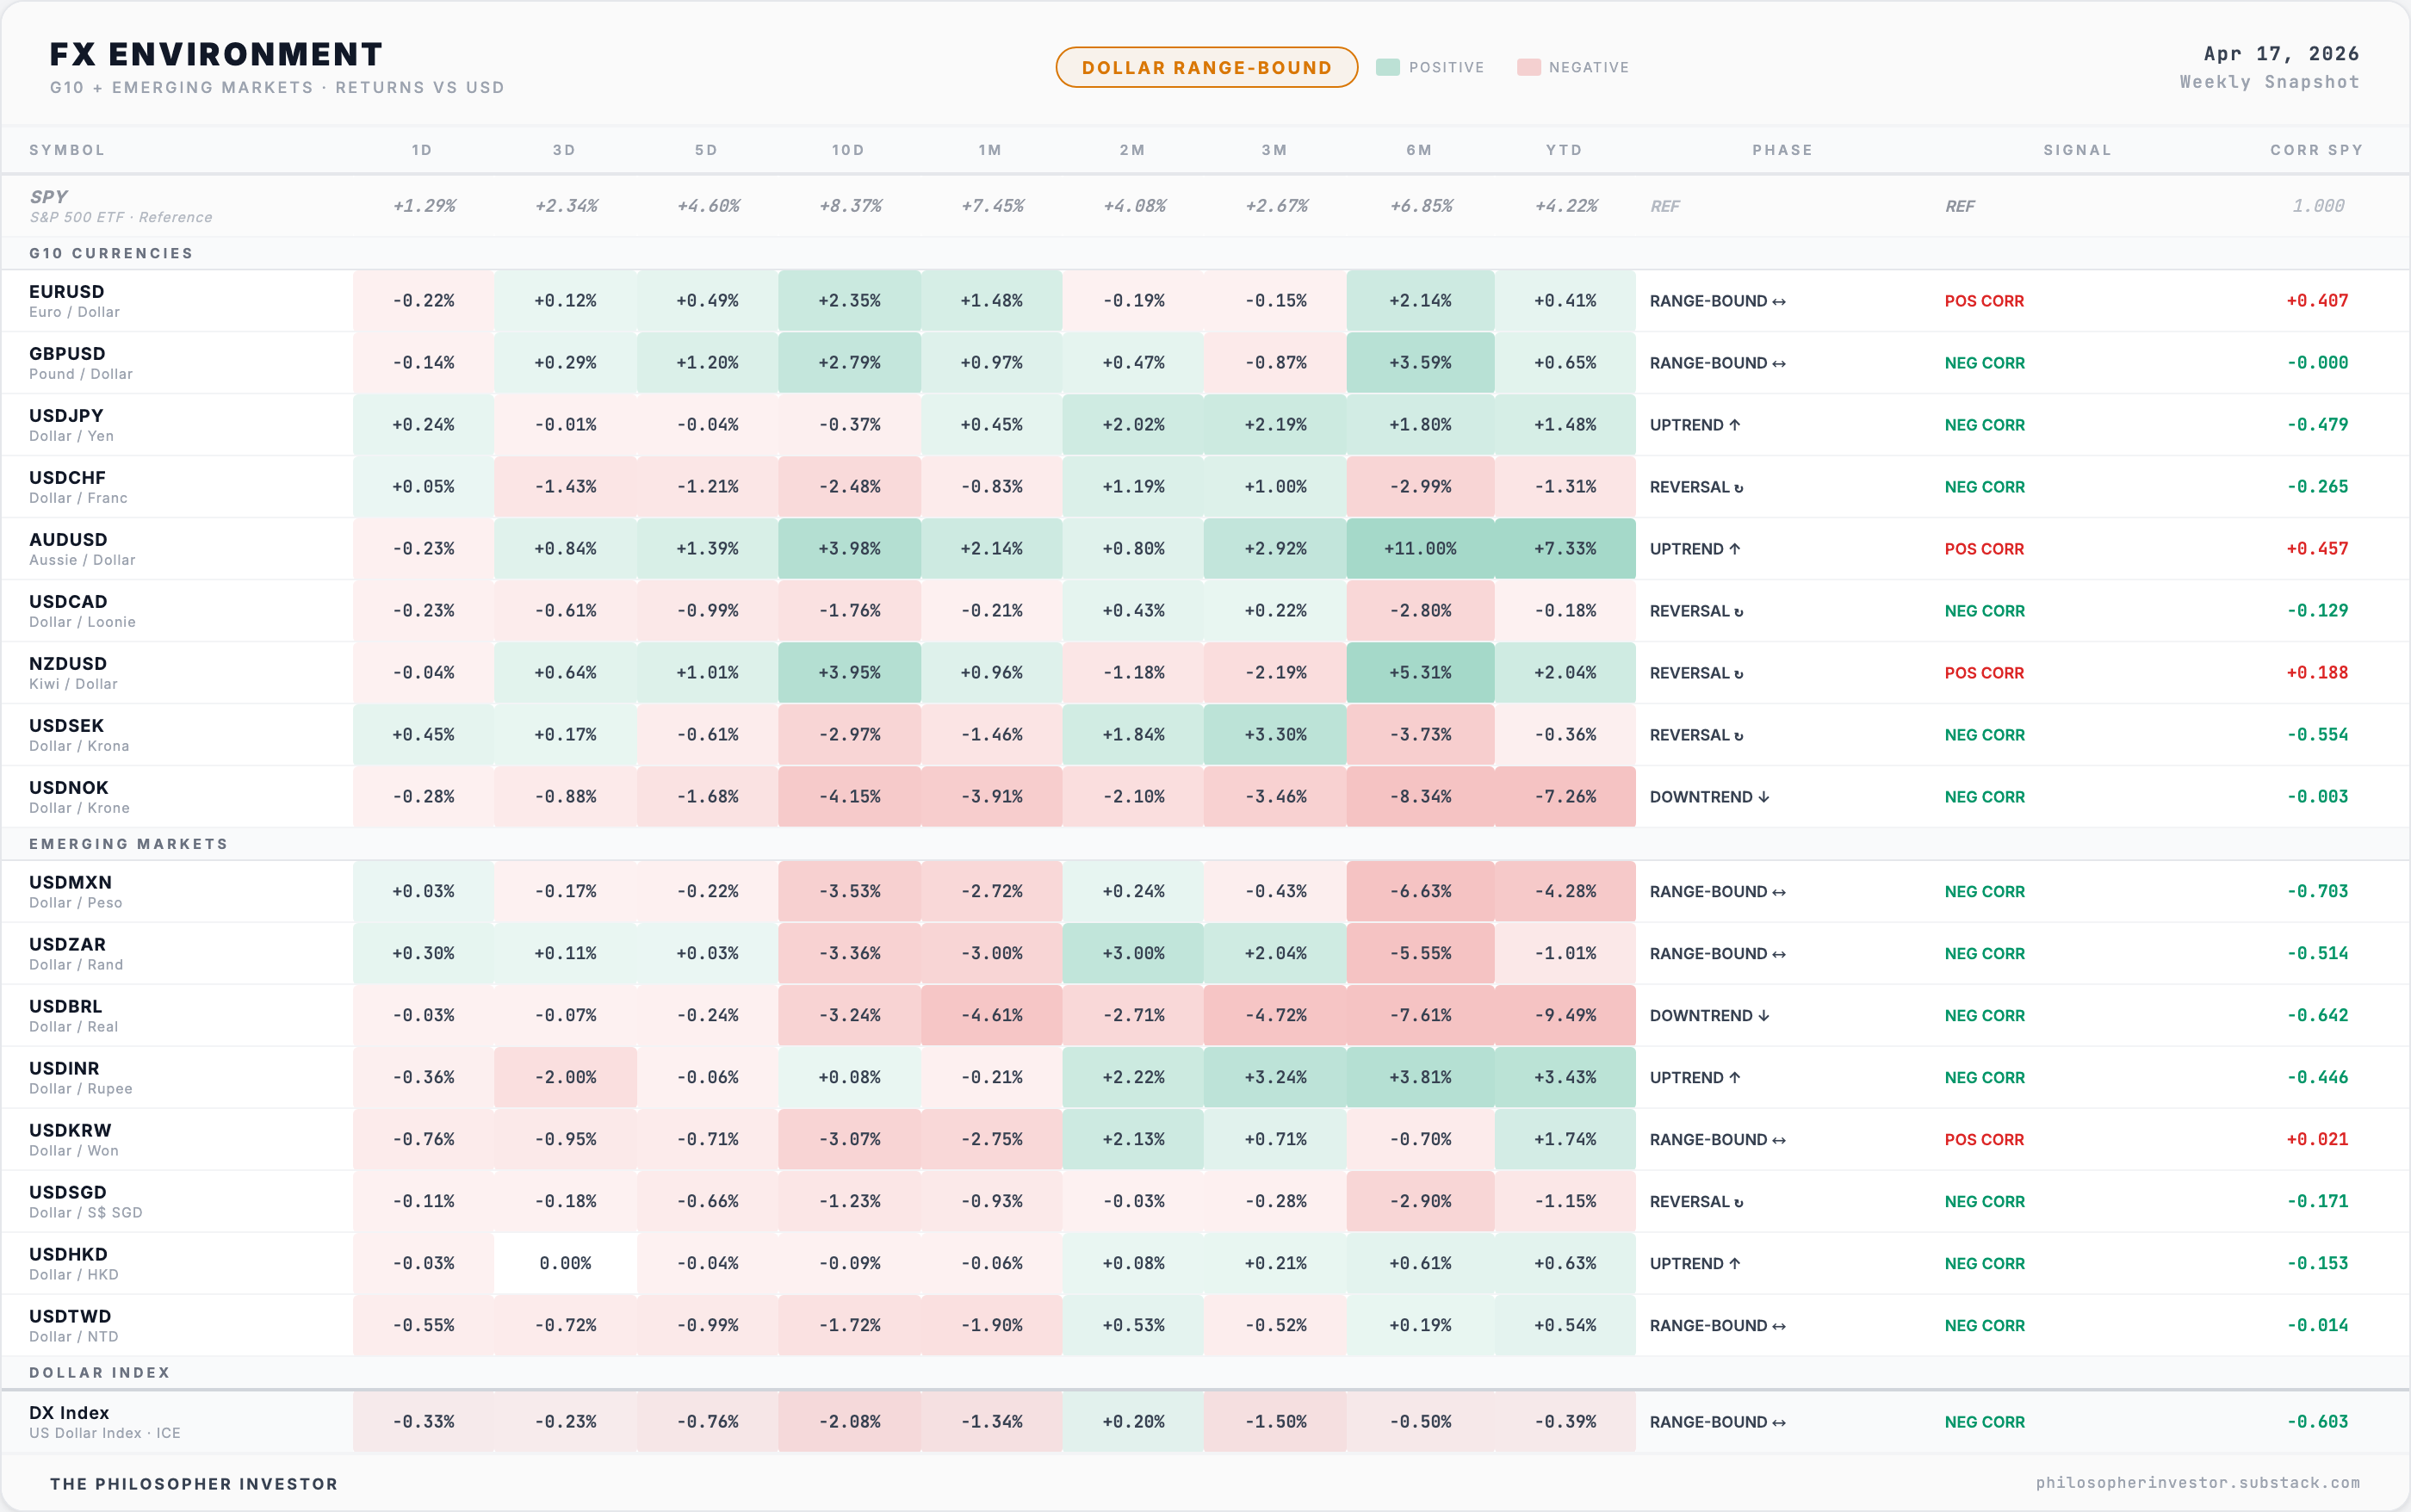
💱 FX
DXY has softened roughly -2.4% over the last month. Gold is up close to +10% from the late-March lows ($4,430 → $4,878). SPY is up about +6% month-over-month.
A softening dollar plus ripping gold plus ripping equities is the textbook bull regime.
But the underlying FX moves are more split than the composite suggests. EUR/USD and GBP/USD both gained over 1.5% against the dollar this week. AUD/USD, the cleanest global risk-on proxy because Australia exports commodities to the China cycle, added close to 3% on the month.
On the emerging market side the picture splits. Mexican peso and Brazilian real both rallied hard against the dollar (LatAm risk-on), while Indian rupee and Korean won weakened (Asian EMs hedging).
The dollar is weakening selectively, not across the board.
The parts of the world feeding the AI buildout and the commodities cycle are bid. The parts that trade with China are not.
Which brings me to USD/JPY.
The pair is currently trading around 158, comfortably above the 148 level that has held for three months as the ceiling-for-yen / floor-for-carry line. A break of 148 (the yen strengthens by roughly 6% from here) unwinds the yen carry trade.
That is exactly how August 2024 played out. VIX went from around 23 to an intraday print around 65 when the carry unwound, even though fundamentals had not moved.
The Bank of Japan meets April 27-28. An ex-BoJ official said publicly this week “it is time to act.”
We could have fireworks.
🚨 Sector Rotation
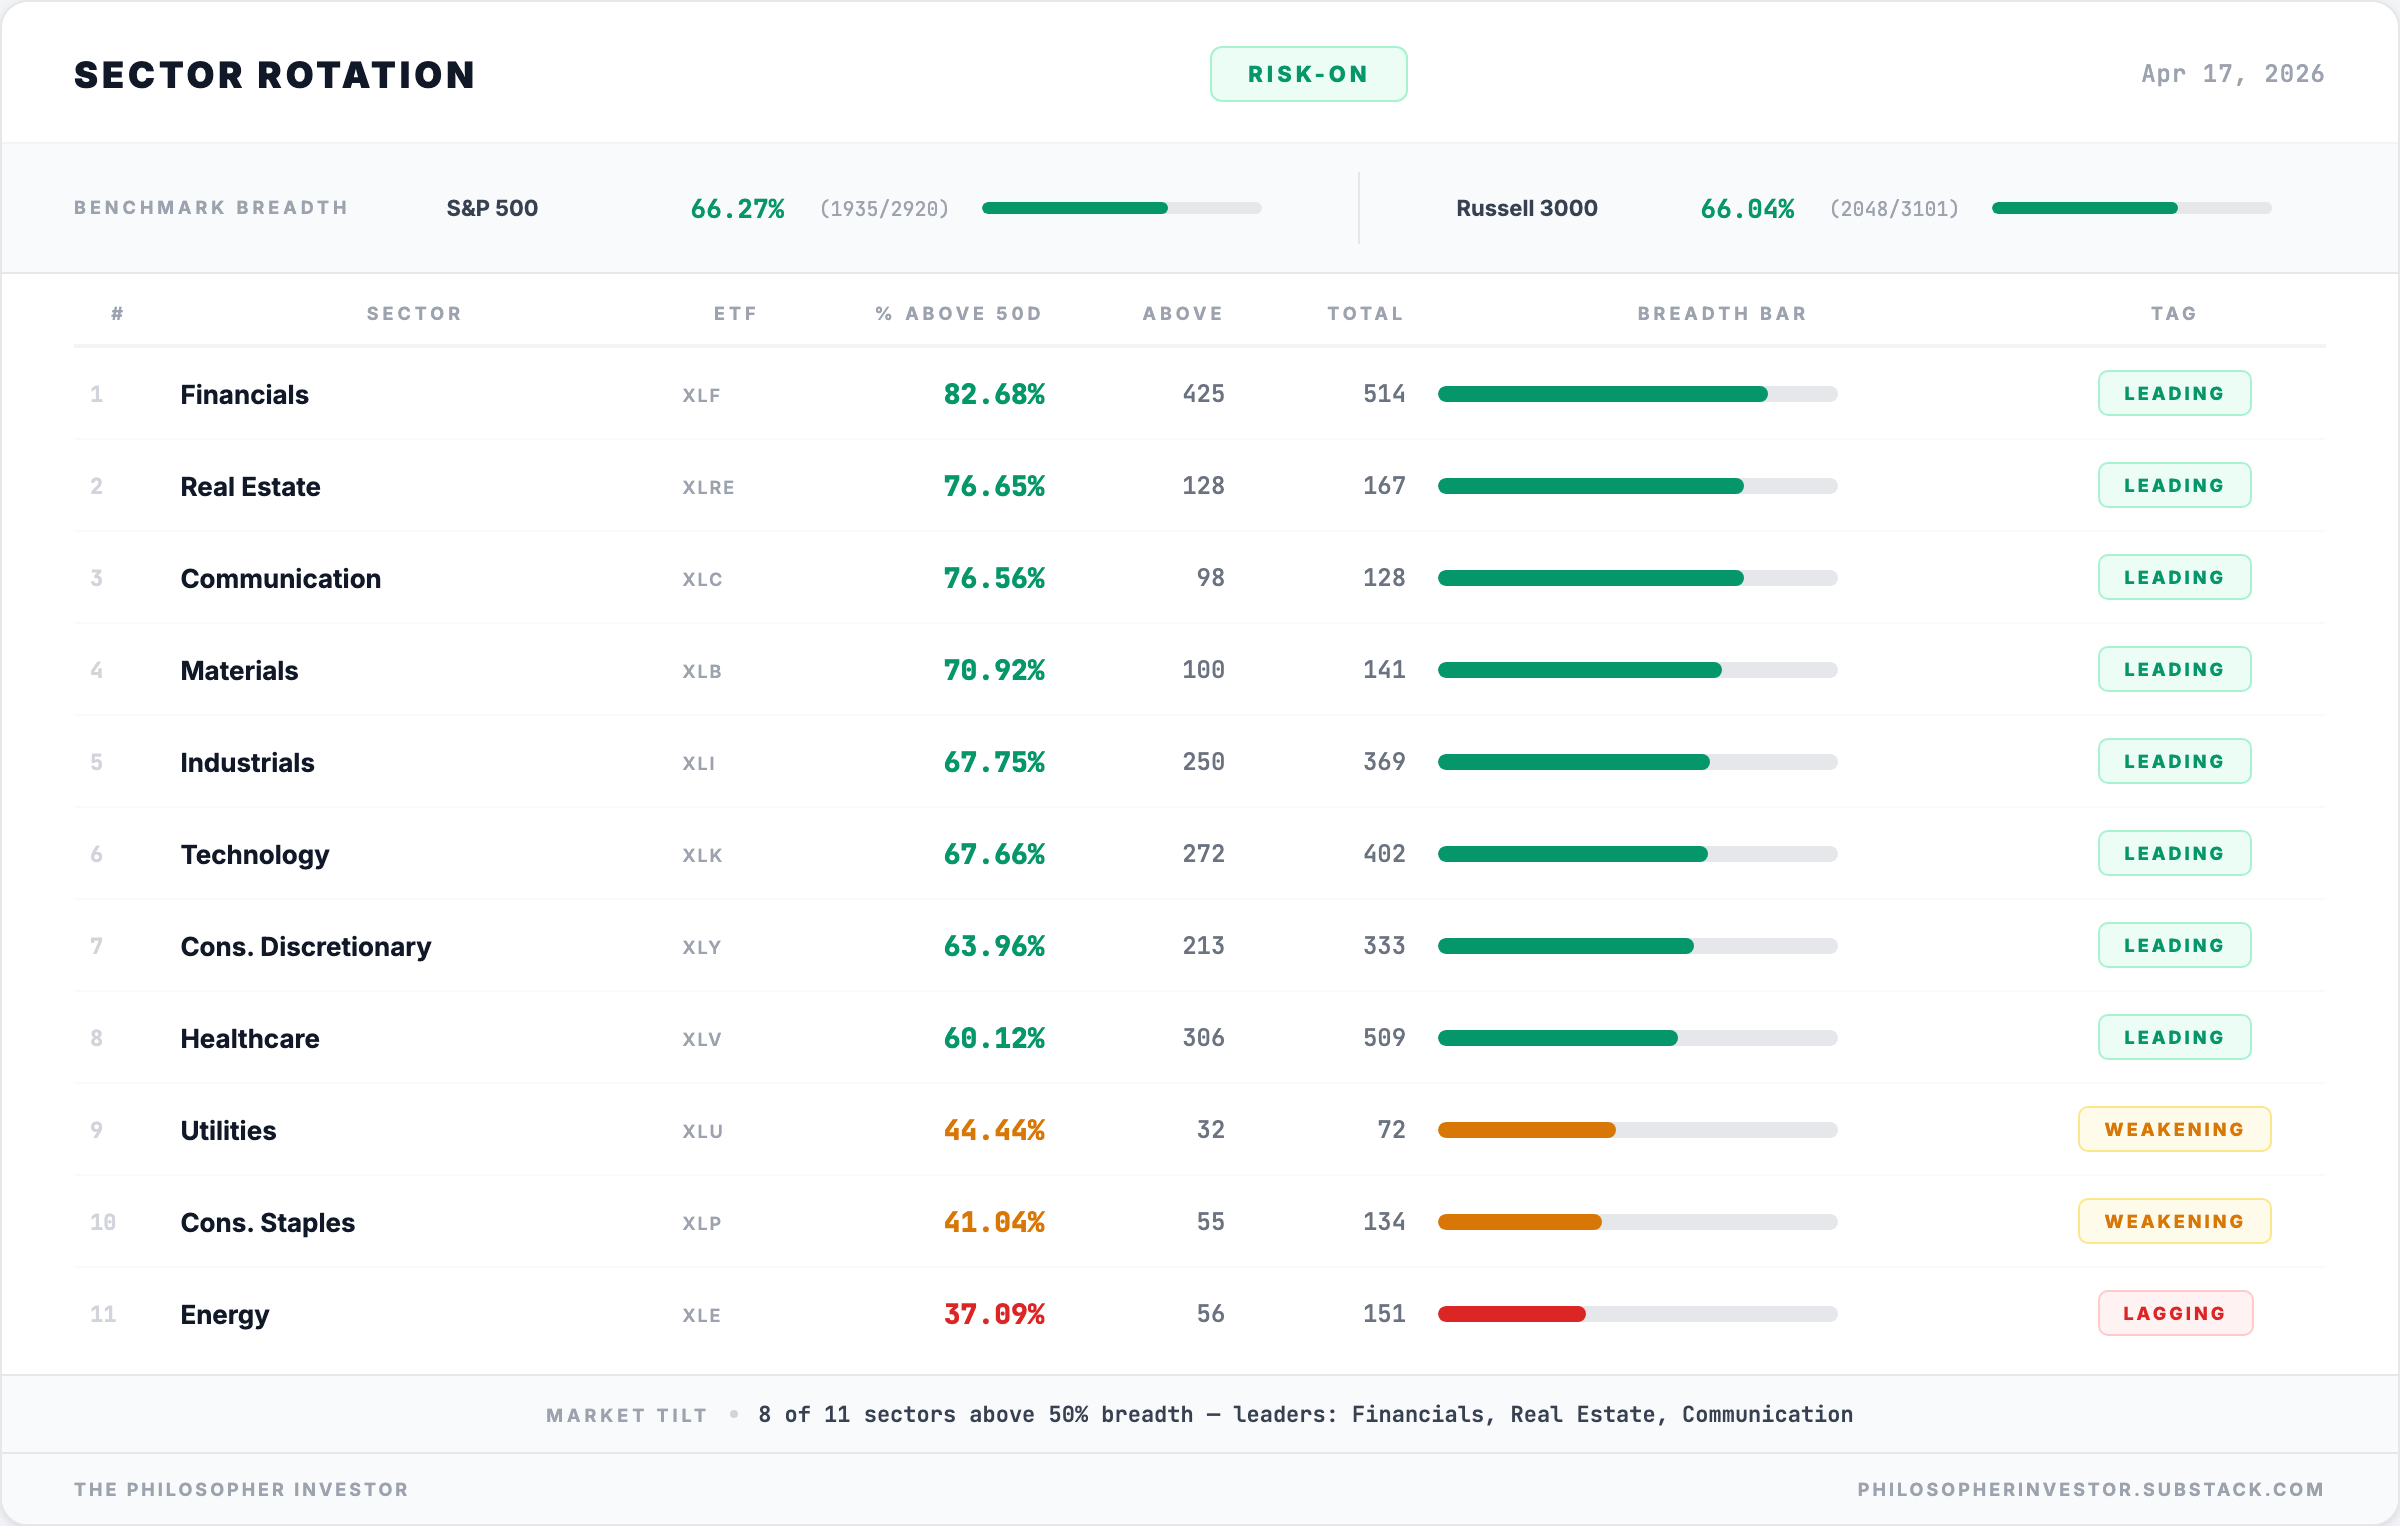
Last Saturday I called Utilities “the sector that wins regardless of Iran, tariffs, or the Fed.” Five sessions later XLU is third from the bottom.
Nothing broke in the AI datacenter story. What broke was the implicit geopolitical premium priced into the sector.
When a sector is leading on a catalyst instead of a thesis, the catalyst reprices, the breadth leaves, the price follows later.
The three biggest gainers this week are all rate-sensitives betting on a cut story that SPY/TLT at +2.47 EXTREME is openly rejecting.
Sectors cannot lead on a rate-cut thesis indefinitely while the bond tape says no.
The paradox from last week resolved in reverse. I asked why Healthcare was lagging while Utilities led and answered: import exposure.
This week Healthcare jumped from last to mid-leader. Utilities collapsed.
Defensives are not behaving defensively right now because they are not being held for defense. They are being held for specific catalysts.
When the catalyst changes, the trade changes with it.
🐋 Smart Money
Every bit of real-money conviction flow this week was defensive. Zero bullish call flow at institutional size. The only size prints are puts.
XLY, the position that won’t go away
Nine sessions ago (April 10), institutional desks bought puts on XLY at 10.5× the daily mean with spot at $112.43. Vol-PCR that day: 14.48. XLY has since rallied to ~$120.
Nine sessions to roll, cut, or book the loss on a moving tape. None of that happened.
The positioning is still on the tape heading into retail earnings in ten days.
That is the signal. Not the April 10 volume print. The April 19 refusal to close it.
A Vol-PCR of 14 on an ETF holding Amazon (~26%), Tesla (~18%), Home Depot, and McDonald’s is size placing a view that consumer spending cracks before month-end.
Not one fund. A Vol-PCR that high is coordinated conviction across desks. That is what makes the signal hard to dismiss.
Nine sessions in the money against them and the flow is still there.
🔥 Trade of the Week: Estée Lauder (EL)
Estée Lauder sits in Consumer Staples. No, that is not a contradiction.
Defensives are not being held for defense, they are being priced on specific catalysts. EL is a Consumer Staple traded on its own binary catalyst, the Puig merger. The broken-sector context is exactly what created the $68 base we are buying off.
Thesis
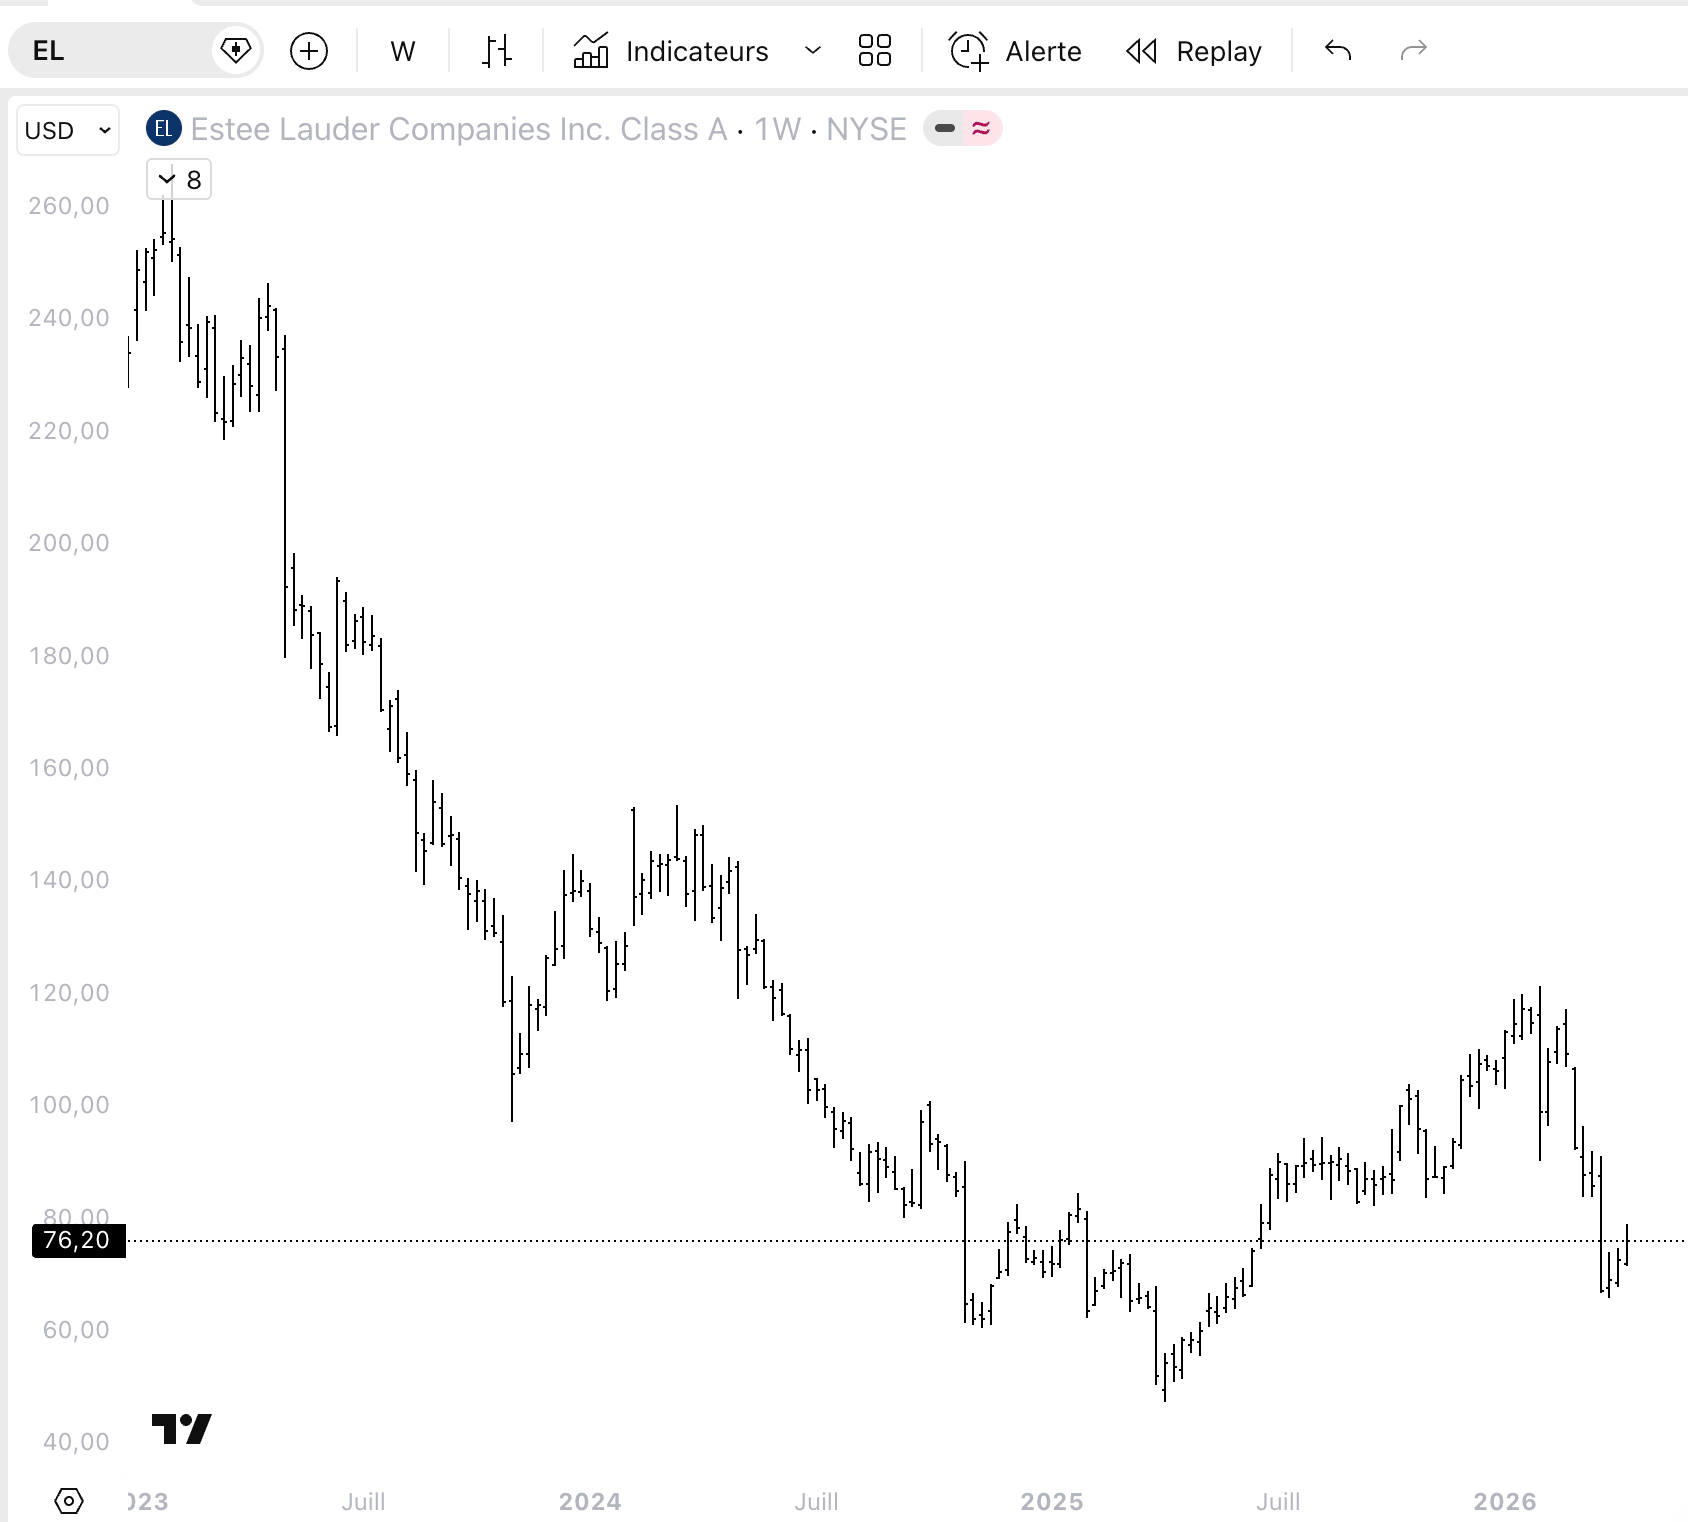
Estée Lauder has lost three quarters of its value since 2022.
On March 23rd the stock gapped from $91 to $79 on 19.7 million shares of volume, 5x the average. That gap was not a random capitulation.
That was the trading session when the company confirmed via 8-K filing that it was in merger discussions with Spain’s Puig Brands, a deal that would combine the two into roughly $40B of market cap and $20B of annual sales. Puig stock jumped +13.4% that day. EL fell another -9.5% the following session.
The market’s read was clear: whatever the deal looks like, EL is the party giving up more value.
For the three weeks after the announcement, the stock sat between $67 and $73 while deal details stayed private. Now it closed Friday at $76.20 with a clean intraday high of $78.88.
The base is the market’s attempt to price the deal before it is formally announced.
That is what we are buying into.
Consumer staples trade on sentiment cycles and capital structure events, not quarterly earnings.
When a name this size absorbs a merger announcement that dilutes existing shareholders, two groups of sellers appear.
The first are long-term holders already frustrated with the China luxury reset, travel retail collapse, and tariff exposure. They see the Puig deal as management admitting the turnaround has failed.
The second are forced sellers: index funds rebalancing as market cap shrinks, risk-parity books cutting defensive allocations, M&A arb desks shorting the buyer (EL) and going long the target (Puig), options market makers delta-hedging around the earnings gap (continuously adjusting their stock exposure to offset the options they’ve written).
Both groups finished working in March.
What remains are value buyers who think EL at $68 pre-deal-terms is cheap enough to absorb any reasonable outcome, and short sellers nervous about covering before the formal announcement lands.
The setup works if selling pressure is exhausted. The three-week base at $68 says it is.
The setup fails if the deal gets richer for Puig than the market already assumes, or if the talks break and EL reverts to standalone turnaround skepticism.
This trade has a binary event layer that did not exist on the pure technical read. Three paths forward:
Deal confirmed with reasonable terms. The overhang clears, the stock re-rates toward the gap at $88 and potentially $95. Timing: within four weeks based on Bloomberg’s “within weeks” reporting.
Deal breaks. Puig drops, EL bounces on relief as the dilution threat disappears, then reverts to standalone turnaround skepticism with travel retail and China still broken. Path: spike to $82-85 on the break, then back to $68-72.
Deal confirmed with punishing-for-EL terms. The stock breaks the $68 base to fresh lows. Stop triggers cleanly at $66.
This is a medium-conviction base trade with a known catalyst, sized for the catalyst rather than the chart.
Levels
Entry zone: $75-77 (spot inside the zone, opening position at Monday’s cash price).
Stop: below $66, under the March 30th capitulation low.
Target 1: $88
Target 2: $95
If EL breaks $66 on deal-terms disappointment or a Q1 guide-down in early May, I am out without hesitation.
If it holds $68 on a deal-break scenario, I am adding more size on the relief bounce back to the entry zone.
🎯 Portfolio Performance
I share entry levels, stops, and targets. I don’t take every position I flag. Position sizes are yours to decide based on your own risk tolerance. This is a model portfolio updated weekly at Friday’s close. My personal positions may differ in timing and sizing.
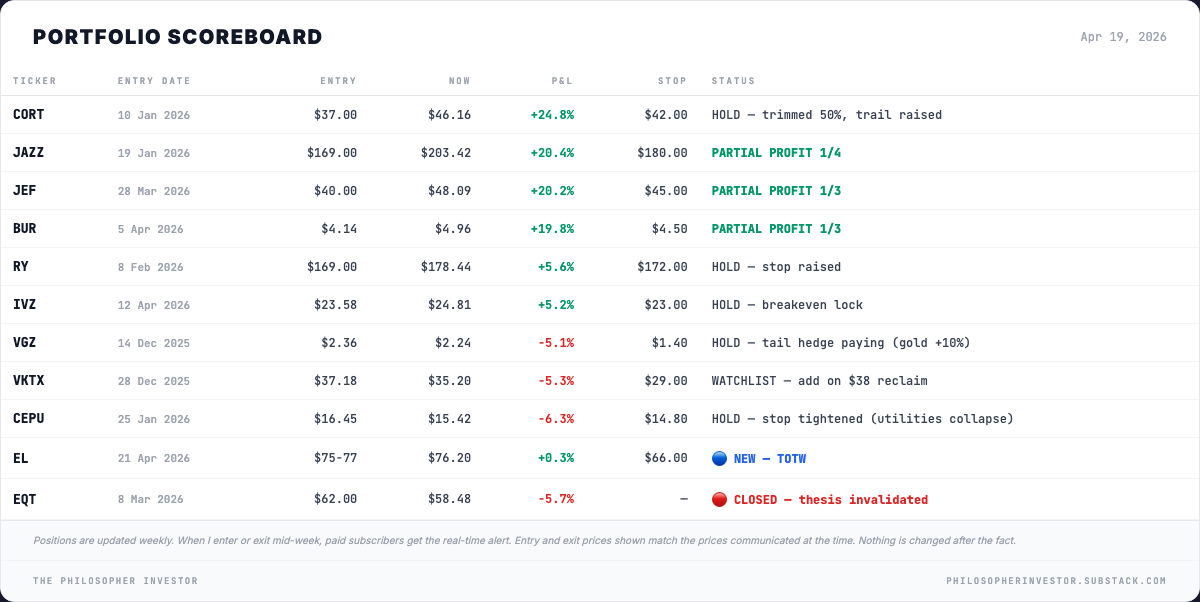
Ten positions active. CORT, JAZZ, JEF, and BUR all between +19% and +25%. Partial profits booked, trailing stops raised.
RY and IVZ quietly working. IVZ at breakeven.
VGZ still red at -5.1%, up sharply from a -24% drawdown as gold rips +10%.
VKTX and CEPU red but well within stops.
EQT: cut at -5.7% when the thesis cracked.
👁️ What I’m Watching
Four pivots this week, in order of importance.
1. Hormuz is the week
The ceasefire expires Wednesday April 22 with no extension requested. Hormuz re-closed Saturday after Friday’s reopening. WTI at ~$93 after a round-trip through $84 and back.
Two paths:
Strait reopens, deal extended: oil below $75, hot CPI becomes a one-off, breadth extends.
Ceasefire expires: oil above $95, 3.3% CPI goes structural, FOMC forced hawkish, every repair from this week reverses in 48 hours.
As of tonight, scenario two is the live one. WTI at Monday’s open is the first signal.
2. Retail earnings
AMZN April 29, then WMT, HD, TGT, LOW in mid-May.
Any two guiding down validates the XLY put flow thesis. All five beating flips the base case toward melt-up. WMT and TGT are the real signal (AMZN is more cloud than retail).
PANW reports the same window. Soft enterprise commentary confirms the 5.3× put ramp.
3. Central bank week (April 27-29)
BoJ (27-28) is the real risk. USD/JPY at 158, break line at 148. Hawkish lean compresses 158 toward 150 fast.
FOMC (28-29): no dot plot in April, so the risk is the press conference tone. Any explicit naming of hike conditions breaks the Fed-cut bid narative.
See you next week.
Daniel
Disclaimer
This newsletter is for educational and informational purposes only. It is not financial advice.
The content reflects personal opinions shared publicly as a journal. Trading stocks, options, futures, or any financial instrument involves significant risk. You can lose your entire investment. There is no guarantee of profit.
The author is not a registered investment advisor, broker, or financial professional with any regulatory authority including the SEC or CFTC. Always consult a licensed financial advisor before making any investment decisions.
By reading this newsletter, you accept full responsibility for your own trading and investment choices. Past performance does not guarantee future results. Markets are unpredictable.
Screenshots are courtesy of TradingView, VixCentral, and other platforms with which the author has no affiliation. Information shared may contain errors or become outdated quickly.
This content is the intellectual property of the author. Copying or redistributing without permission is prohibited.
By continuing to read, you acknowledge and accept these terms.
Read the desk every week
Market analysis in plain English, plus the app that scans the whole US market for you.
Become a member Read the original on Substack ↗