Five straight red weeks. Here's what quietly improved.
Market Recap — March 28th 2026
2026-03-29 · 14 min read · Originally published on Substack ↗

TL;DR
S&P 500 breadth score at 15/100. Essentially flat from last week’s 14. The bleeding has paused but nothing has healed. Only 25.7% of stocks above their 50-day moving average. Energy is still the only sector in a real uptrend. Nine sectors lagging. Correction confirmed, fifth straight week.
VIX spiked +13% on Friday to close at 31.05. Gold volatility at 45.07, up 16.6% this week. The fear is spreading from stocks to commodities.
Trade of the Week: JEF (Jefferies Financial Group). Investment bank down -48% from its all-time high, trading at 8.2x. Bottom fishing signal fired 15 times in March for this one.

Hello my friends,
Two things happened this week that should not have happened at the same time.
The VIX spiked +13% to 31.05. Five straight red weeks. SPY at $634, down -7% from peak. Polymarket pricing 36% recession.
Every headline screaming the same word: danger.
And underneath, for the first time in five weeks, the selling pressure quietly eased. The breadth indicators I track stopped deteriorating. The divergences started narrowing. The fear accelerated while the damage decelerated.
That contradiction is the entire setup right now. And it probably resolves on April 6, when Trump’s Iran pause expires.
Until then, this is what the data says.
To get the most out of these market recaps and understand the framework behind my observations, I encourage you to read about my methodology here.
Market Breadth
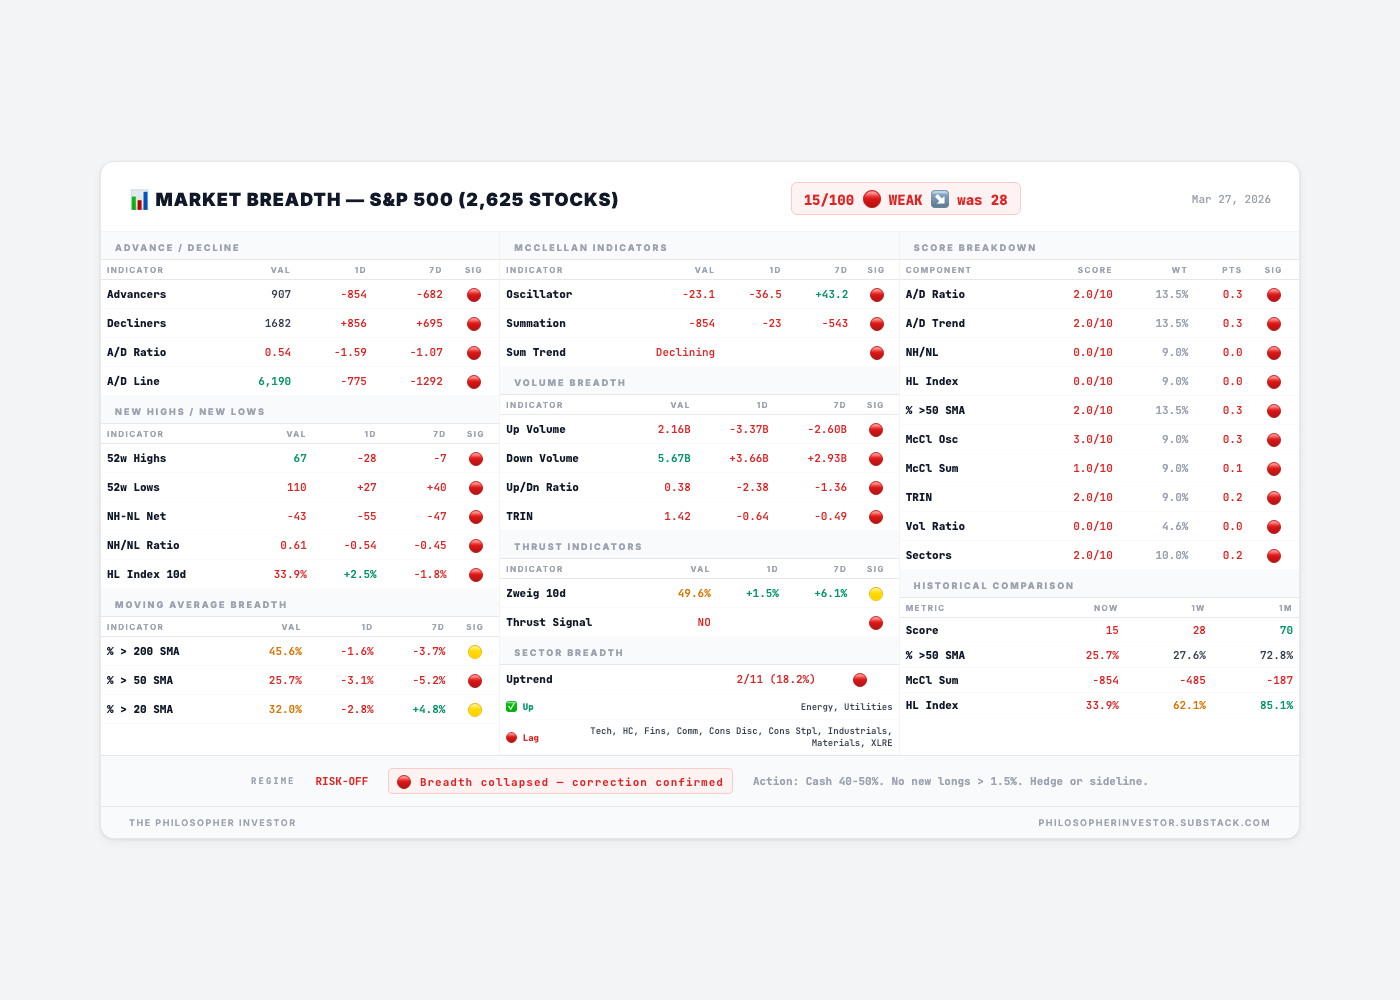
Breadth Score: 15/100 — 🔴 VERY WEAK
Up +1 point from last week’s 14. Down -55 points from one month ago (70). We are in the same territory we were last week. The bleeding has decelerated but nothing is recovering.
Friday’s session: 907 advancers vs 1,682 decliners. The advance/decline ratio came in at 0.54. Roughly two stocks fell for every one that rose. Not great, but better than last week’s 0.21 that I called capitulation-level. Progress? Maybe. Or maybe just a slightly less violent day of selling.
The volume picture is ugly. $5.67 billion in down volume vs $2.16 billion in up volume. The up/down ratio is 0.38. For every dollar flowing into stocks, nearly three dollars are flowing out. The TRIN (a measure of selling pressure that accounts for both volume and breadth) hit 1.42. Above 1.0 means sellers are in control. Above 1.4 means they are aggressive about it.
The McClellan Oscillator bounced to -23 from last week’s -176. That looks like improvement until you realize the Summation (the cumulative version that tracks whether damage is building or fading over weeks) dropped to -854. Last week: -485. A month ago: -187. The oscillator bounced. The underlying damage kept building. That is the definition of a correction that is not done.
The High-Low Index recovered slightly to 33.9% from last week’s 27.7% collapse. Still well below the 50% threshold where I start getting comfortable. 67 new 52-week highs vs 110 new lows. Still more stocks breaking down than breaking out, but the ratio improved from last week’s 6-to-1 to roughly 1.6-to-1.
Participation: 25.7% above the 50-day moving average. Three out of four stocks are in a short-term downtrend. 45.6% above the 200-day. We crossed below 50% on the long-term measure. More than half the market is now below its long-term trend line. One month ago this was 72.8%.
The Zweig 10-day breadth thrust indicator is at 49.6%. A thrust signal fires above 61.5% and has historically been one of the most reliable “all clear” signals in market history. We are not there. Not even close.
Two sectors in uptrend out of eleven. Energy and Utilities. Technically an improvement from last week’s one (Energy alone). Utilities recovered from 37.5% to 54.17%, barely above the 50% line.
Regime: RISK-OFF. Action: Cash 40-50%. No new longs above 1.5% of portfolio. Hedge or sideline.
🚨 Sector Rotation: One King, One Pretender
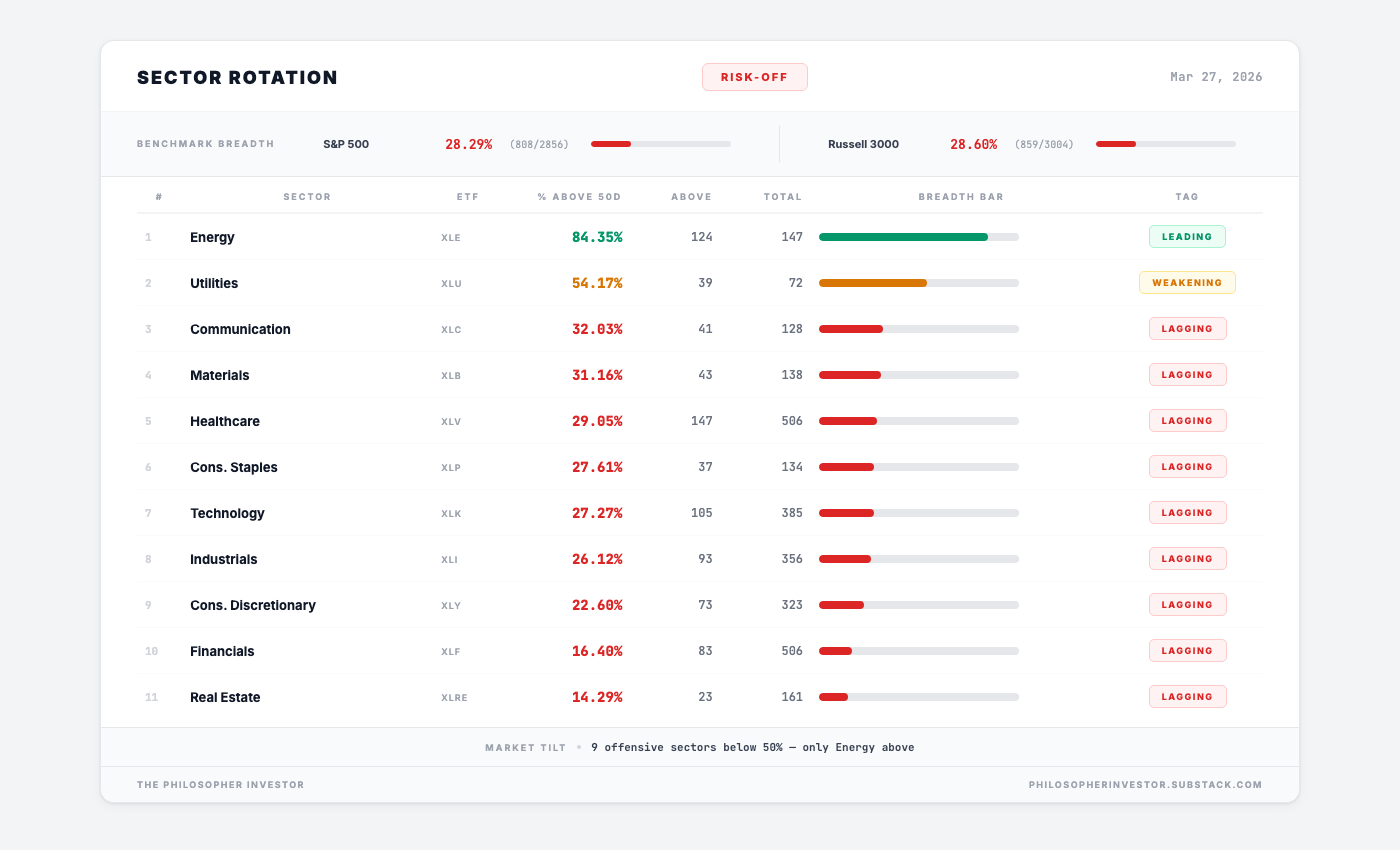
The sector picture has not changed in five weeks. Energy leads everything by a margin that borders on absurd.
Energy (XLE): 84.35% of stocks above their 50-day. 124 out of 147 energy stocks in an uptrend while three-quarters of the rest of the market is broken. This is a parallel universe. Oil at $113 Brent is printing money for every E&P company in America. The war premium, the Hormuz disruption, the supply squeeze. Every dollar above $100 is a direct earnings upgrade for this sector and a direct tax on everything else.
Utilities (XLU): 54.17%. The pretender. It recovered above 50% this week but look at the tag. The dashboard sees the momentum fading. When rate hike fears combine with a market selloff, utilities are caught in a vise: they are supposed to be the safe haven, but rising rates hurt their economics. They cannot hold this line for long.
Below those two, everything is a wall of red.
Communication (XLC): 32.03%.
Materials (XLB): 31.16%.
Healthcare (XLV): 29.05%.
Consumer Staples (XLP): 27.61%.
Technology (XLK): 27.27%, nearly three out of four tech stocks have lost their trend.
Industrials (XLI): 26.12%.
Consumer Discretionary (XLY): 22.60%.
Financials (XLF): 16.40%, only 83 out of 506 financial stocks holding up. Dead last:
Real Estate (XLRE) at 14.29%. 23 out of 161 real estate stocks in an uptrend. Mortgage rates above 6.5% are killing this sector slowly.
The gap between first and last is 70 points. Energy at 84% and Real Estate at 14% in the same index. I have never seen this kind of dispersion.
🔍 Divergence Score: 36/100 — MODERATE RISK
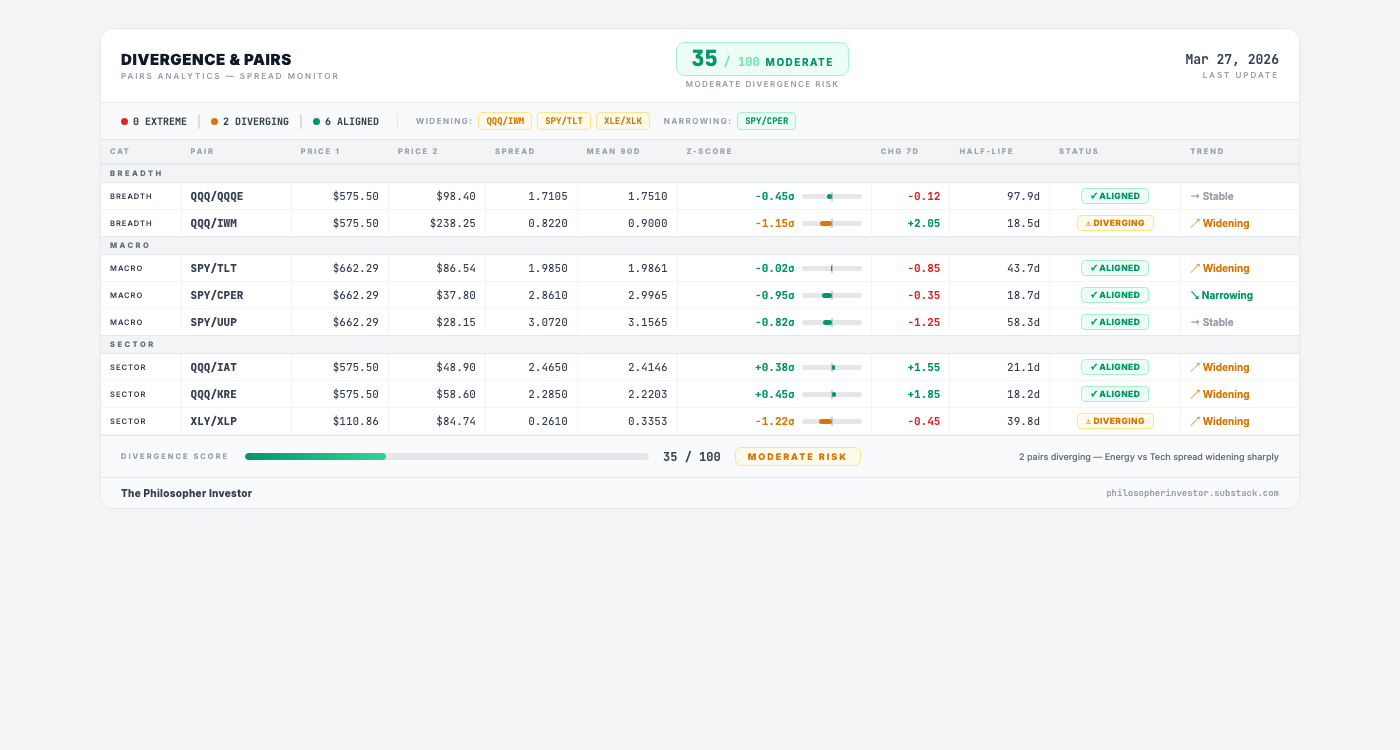
The divergence score improved from last week’s 25. The two extreme signals from last week (dollar flight-to-safety and discretionary vs staples) both normalized. That is the first piece of genuine good news in a month.
Two relationships are still diverging. But both are narrowing. That matters.
Large caps vs small caps (QQQ vs IWM). Z-score at -1.94. The Nasdaq 100 is underperforming small caps by nearly two standard deviations from its 90-day average. Big tech is taking the heaviest hits. But this divergence is narrowing. The gap is compressing, not widening. Half-life is only 18.5 days, meaning this kind of dislocation has historically resolved itself fast. Either big tech bounces or small caps catch down.
Discretionary vs staples (XLY vs XLP). Z-score at -1.02. Consumers rotating from things they want to things they need. Classic recession-fear behavior. Flagged last week too. Also narrowing. The fear is still there but it is not accelerating.
Both diverging pairs narrowing simultaneously is a constructive signal. The internal stress is fading even as the headline numbers stay ugly.
Energy vs Tech spread widening sharply. XLE/XLK is one of the widening pairs. If you are positioned in Energy, this is the best quarter in years. If you are positioned in Tech, you are in a bear market.
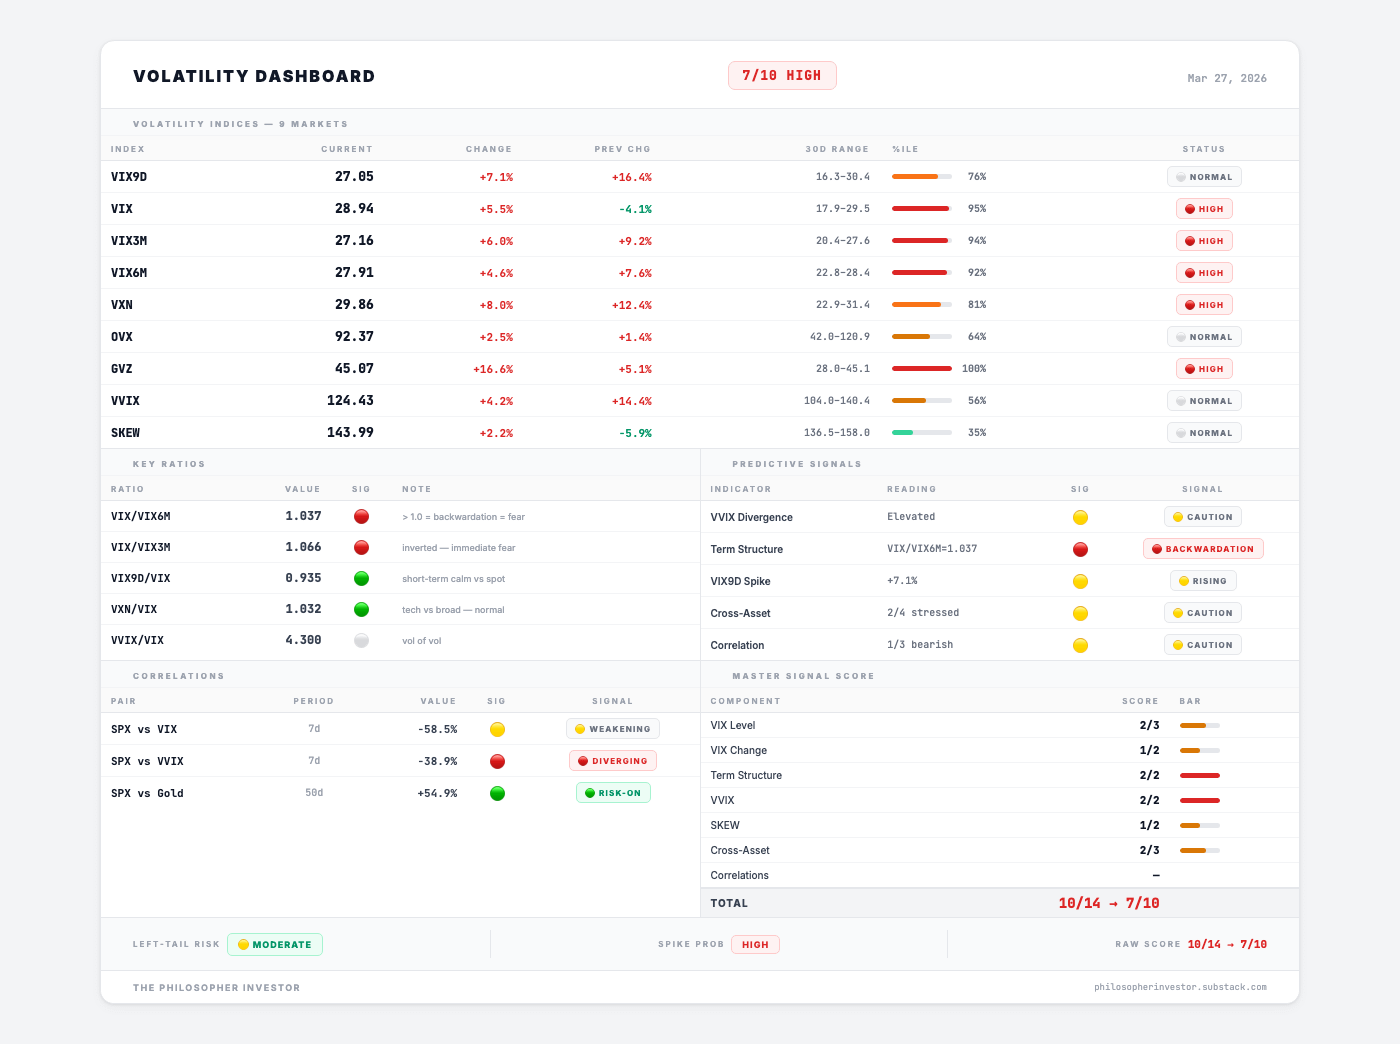
📉 Volatility: VIX 31.05 — The Highest Close Since April 2025
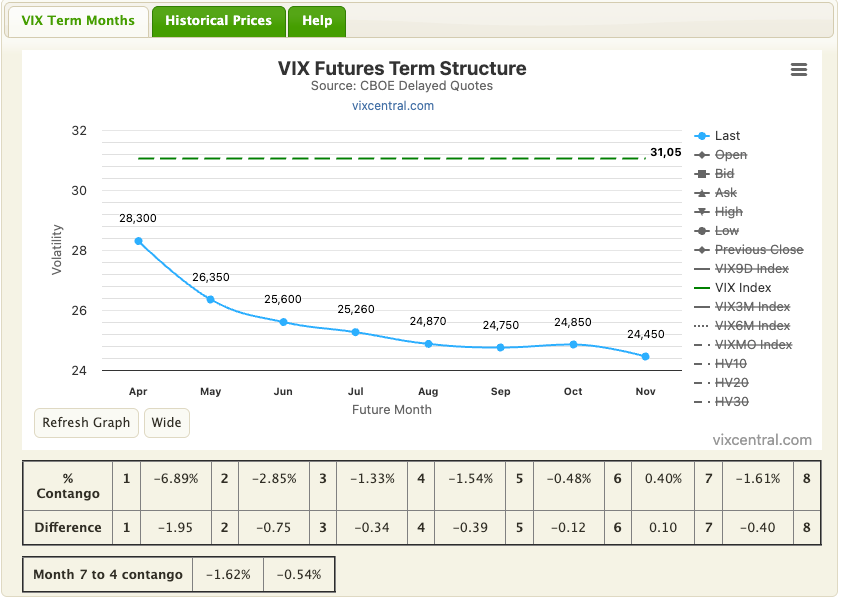
VIX opened Friday at 28 and never looked back. By the close: 31.05. Up +13% in a single session. The 100th percentile of its 30-day range. First close above 31 since the April 2025 tariff shock.
The term structure has not fully inverted. VIX/VIX6M ratio: 1.04. We are right at the threshold. One bad session tips us into backwardation. But technically, we are not there yet. The market is paying almost as much for protection today as it expects to pay six months from now. In normal times that ratio sits around 0.85. At 1.04 the safety margin is gone.
VIX3M at 27.16, 94th percentile. VIX6M at 27.91, 92nd percentile. VXN (Nasdaq volatility) at 29.86, 81st percentile. The entire curve is elevated. Even the 6-month view is in the top decile. The market expects this regime to last months, not weeks.
Gold volatility (GVZ) at 45.07. 100th percentile. Up +16.6% this week.
Gold pulled back in price. But gold’s volatility exploded to very high level. When price falls and vol rises simultaneously, the market is pricing MORE turbulence ahead, not less. We saw this pattern earlier with oil vol. Now it is spreading to gold. The stress is broadening from commodity-specific to systemic.
Oil volatility (OVX) at 92.37, 64th percentile, up only +2.5%. The initial Hormuz shock has been digested. Oil vol has normalized. Gold vol is taking the baton.
VVIX at 124.43, 56th percentile. SKEW at 143.99, 35th percentile. Both normal range. The VIX is high but stable. Not whipsawing. Just elevated.
The market is not pricing a crash. It is pricing sustained discomfort. Historically, VIX has not remained above 31 for very long.
💱 FX Signal: Dollar Strengthening
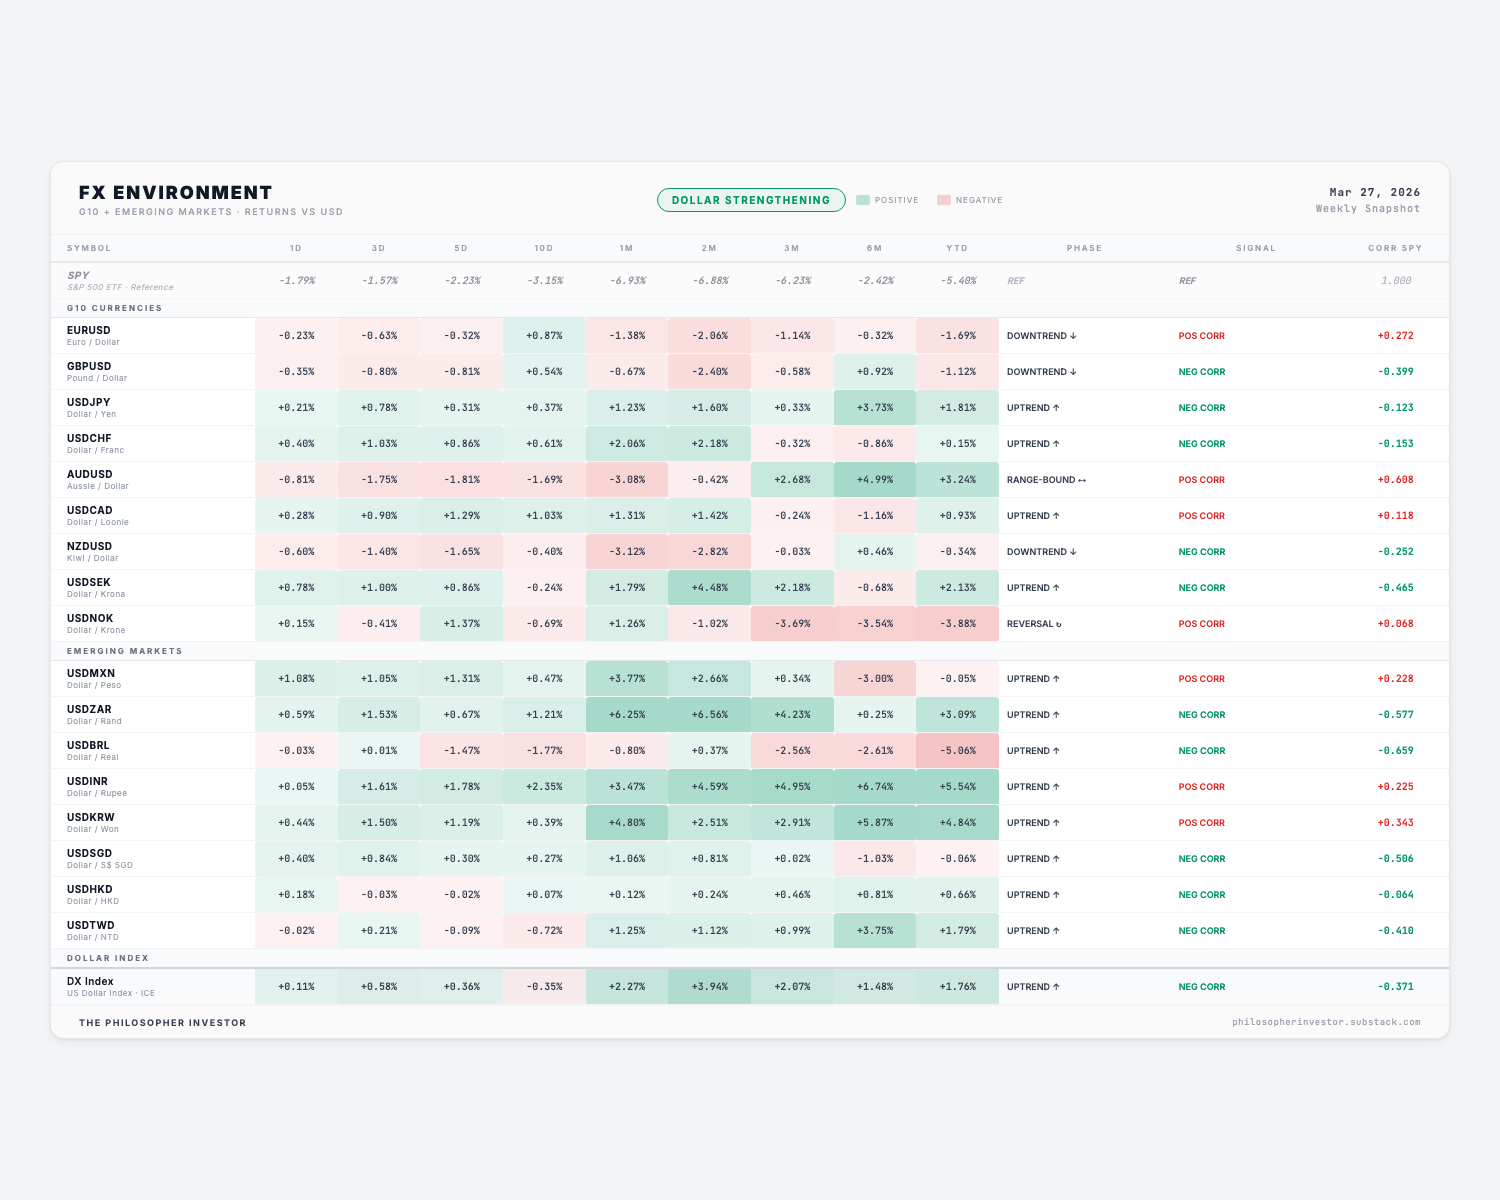
The dollar is strengthening against almost everything. USDJPY in uptrend. USDCHF in uptrend. USDCAD in uptrend. USDMXN in uptrend. USDINR in uptrend. USDKRW in uptrend. Broad dollar strength driven by two forces: flight to safety and rate differential. If the Fed cannot cut while others do, the yield advantage pulls capital into the dollar.
European currencies weakening as the energy shock hits their economies harder.
The emerging market signal is where the real stress shows. USDZAR (South Africa) up +3.09% YTD. USDINR (India) up +5.54% YTD. USDKRW (Korea) up +4.84% YTD. Higher oil prices crush their current accounts. A strong dollar makes their dollar-denominated debt more expensive. Double squeeze.
One outlier: AUDUSD. The most equity-correlated major currency. If SPY bounces, AUD bounces with it. Watch this as a confirmation signal.
Another: USDNOK (Norwegian Krone) just flipped to REVERSAL after being in uptrend. Norway is an oil producer. When oil rises, the Krone strengthens. If USDNOK continues falling, it confirms the energy trade has legs.
🧠 My Take
Five weeks of red. SPY at $634, down -7% from peak. VIX at 31.05, highest close in a year. Only Energy working because oil at $113 and a shipping choke point is disrupted.
The dashboards are telling me the worst of the decline already happened. Breadth went from 70 to 15 in four weeks. That is the crash. What we are in now is the aftermath. The question is not “how much further can we fall?” The question is: is the selling pressure accelerating or decelerating?
For the first time in five weeks: decelerating. McClellan Oscillator bounced from -176 to -23. A/D ratio improved from 0.21 to 0.54. High-Low Index recovered from 27.7% to 33.9%. Both diverging pairs narrowing instead of widening. None of this is bullish. All of it is “less bearish.” That is a meaningful distinction when VIX is at 31.
VIX at 31 is the regime marker. Last time VIX closed above 31 was the April 2025 tariff war. That episode ended with Trump pausing tariffs and the S&P rallying +9.5% in one session. Historically, VIX has not remained above 31 for very long. It either spikes higher into full panic or it reverses. If next week tips it over, we are in the April 2025 playbook. If it normalizes, we get the dead cat bounce first.
The gold signal. Falling price with exploding vol has appeared only a handful of times in the last five years. Each time, gold was within two weeks of a major move. It does not tell you the direction. It tells you the next move will be violent.
I am not adding positions. VIX above 27 is my rule. VIX at 31 makes it even clearer. Half-size posture remains. Stops are set. The portfolio has two solid green positions in a market where almost nothing is green. The risk/reward for aggressive positioning does not justify the downside until breadth recovers above 25 or VIX closes below 25 consistently.
Scenario matrix for March 28 to April 6:
Most likely (35%): Grind continues. Breadth stays 10-20. VIX 28-32. Markets chop sideways waiting for the April 6 deadline. Energy leads, everything else bleeds. Quarter-end window dressing creates a small mechanical bid Monday and Tuesday (fund managers buying winners and selling losers to clean up quarterly reports). Do not mistake it for real demand.
Second (30%): Dead cat bounce. VIX drops to 25-28. SPY bounces to $650-660. Breadth lifts to 20-30. Headlines calm. Looks like a bottom. It is not. Funds repositioning at quarter-end and short covering ahead of April 6. The move is technical, not fundamental.
Possible (25%): April 6 resolution. Some form of deal, extension, or diplomatic signal. Oil drops below $100. VIX collapses to 20-22. Breadth snaps above 30 in days. Everything I am watching becomes obvious in hindsight. This is the scenario I am holding dry powder for. The bounce will be fast. Anyone who hesitates will miss it.
Unlikely (10%): Escalation. April 6 passes with no deal. Military action resumes. Oil spikes above $120. VIX breaks 35. Breadth falls below 10. True capitulation. Paradoxically, this is where the best 6-month buying opportunities would emerge. But you need cash to take them.
🔎 Options Flow — Smart Money Positioning
I track large, aggressive options trades called “sweeps.” These are orders that hit multiple exchanges at once to get filled fast. When someone sweeps, they are in a hurry. They know something, or they think they do.
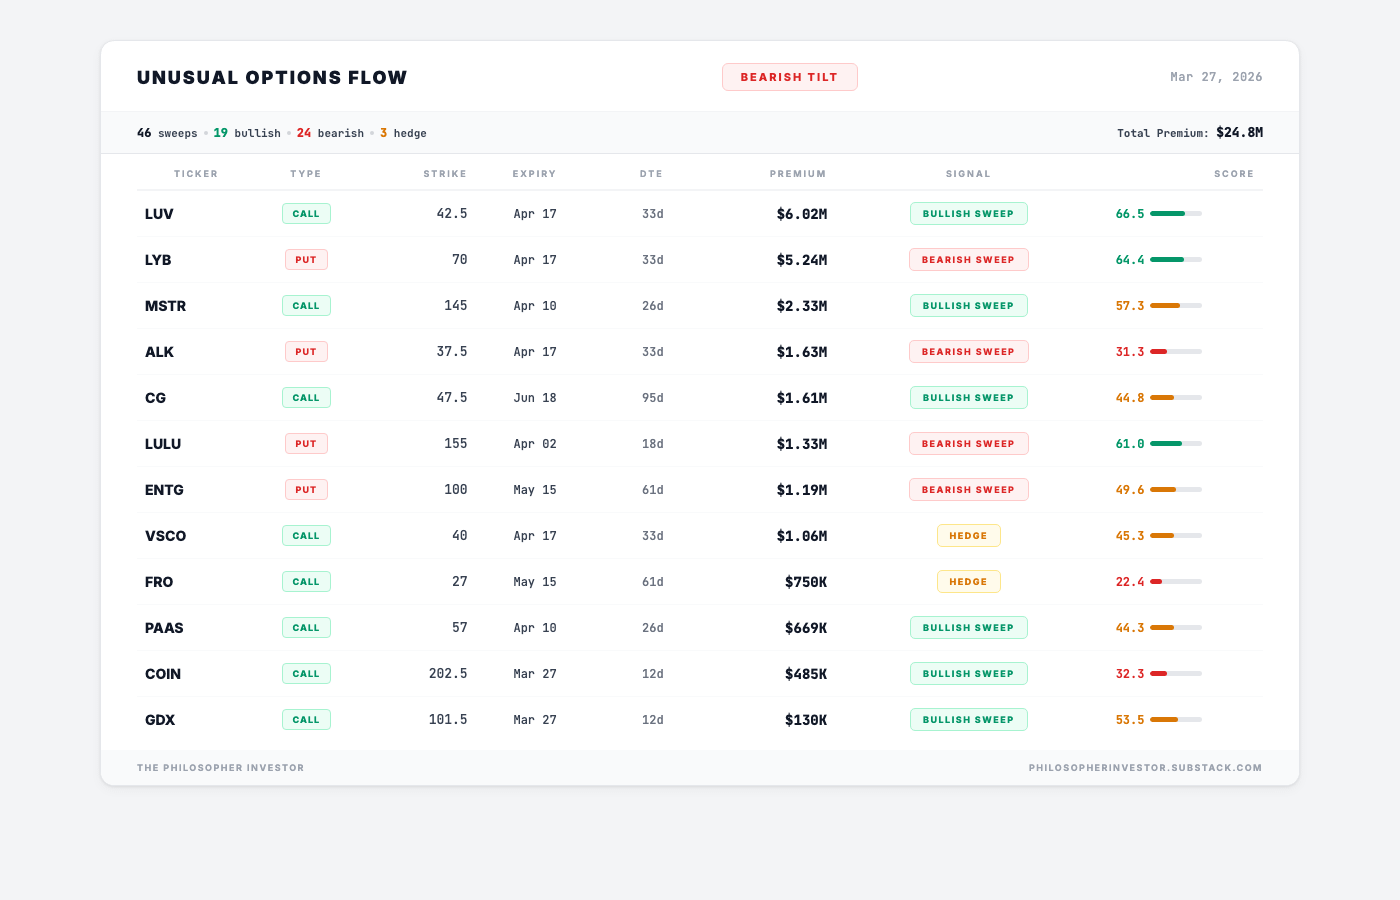
46 sweeps. 19 bullish. 24 bearish. 3 hedge. Total premium: $24.8M.
Overall tilt: BEARISH. More put sweeps than call sweeps.
The $6M Southwest Airlines (LUV) call sweep. Largest bet of the week. $6.02 million in April 17 calls at the $42.50 strike, score 66.5. Aggressive: LUV closed Friday at $37.36, putting these calls 14% out of the money. The buyer needs a significant move just to break even. Domestic airline, no international fuel hedging complexity. If oil stabilizes or April 6 produces a deal, domestic travel re-rates first. As of Friday, this bet is underwater. Bold conviction or expensive mistake. April 17 will tell us.
The $5.24M LyondellBasell (LYB) put sweep. $5.24 million in April 17 puts at $70. Chemicals company with direct oil feedstock exposure. Pure bear bet. Tariff + oil cost squeeze play.
MSTR $145 calls ($2.33M, bullish Bitcoin proxy). ALK $37.5 puts ($1.63M, bearish airlines). CG (Carlyle) $47.5 calls ($1.61M, bullish, 95 days out). LULU $155 puts ($1.33M, bearish high-end retail). ENTG $100 puts ($1.19M, bearish semis, 61 days). PAAS $57 calls ($669K, bullish silver miners).
The sentiment dashboard shows a split personality. SPY’s volume put/call ratio is 0.13, extremely bullish (retail buying calls on the dip). GLD has an OI PCR of 3.65. For every call outstanding on gold, nearly four puts. Options on gold miners have never been this expensive.
The read: The options market is having an argument with itself. The daily activity is aggressively bullish, traders buying calls on every dip, betting the bounce is coming. The accumulated positioning tells the opposite story: protection being built quietly over weeks, concentrated in tech and gold
Polymarket: Recession probability at 36.0% (up from 21% in February). Probability of 2+ Fed rate cuts in 2026 at 37.1%. Zero cuts at 38.6%. The market is pricing a Fed that cannot cut (inflation above 4%) and is afraid to hike (economy weakening). Worst position for a central bank.
🔥 Trade of the Week: JEF (Jefferies Financial Group)
The investment bank the market left for dead. My screener disagrees.
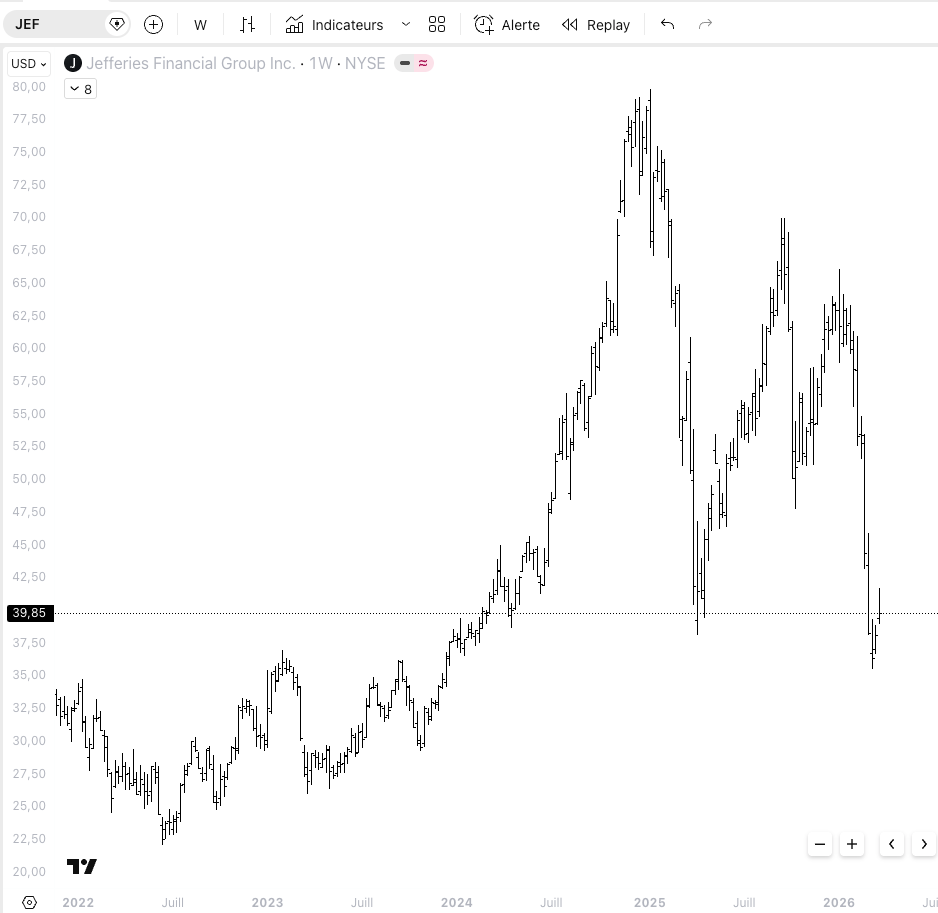
When the market sells everything, it sells the good businesses too. Jefferies is a mid-cap investment bank and capital markets firm. M&A advisory, trading, equity underwriting. The kind of business that prints money when deal flow picks up and suffers when it slows down. The stock ran from $27 in 2022 to almost $80 at its all-time high as capital markets roared back. Then the correction hit. JEF gave back nearly half that move in four months. Now trading at $40.28, down -48% from its all-time high, sitting right on the $39.85 horizontal support that has held since 2023.
The market is pricing JEF like the deals are never coming back. At 8.2x forward earnings, this is the cheapest stock in the entire Capital Markets sector. Analyst consensus target: $59.33, a +47% upside from here. Revenue still growing at +5.7% year over year. $1.5 billion in cash. Short interest at just 2.7% of float, so this is not a crowded trade. The fundamentals do not justify the price. The panic does.
Why my screener is screaming. The bottom fishing signal has fired 15 times in March alone. On March 12, the RSI hit 12.4. The stock was at $38.71 that day. It bounced to $42-43 before pulling back to $40.28, right back to the $39.85 support line.
Look at the weekly chart. The dotted line at $39.85 is the horizontal support that held through all of 2023 and 2024. JEF is sitting right on it. Not above it, not below it. On it. That is the cleanest entry I have seen in weeks. Below that, the 52-week low at $35.53 is the line in the sand. If that breaks, the thesis is wrong and we move on.
The upside is where this gets interesting. The $48 zone was resistance before the crash and becomes the first target. Beyond that, the analyst consensus at $55-59 is achievable if capital markets activity normalizes in H2 2026.
M&A fees and trading revenue are cyclical. When VIX normalizes and deal flow returns, the investment banks are the first to re-rate. JEF with a beta of 1.5 will move fast in both directions. That is the risk and the opportunity.
Entry: $39.50-40.50 (current zone, right at the $39.85 horizontal support)
Stop Loss: $35, below the 52-week low at $35.53 (-12% risk from entry)
Target 1: $48, horizontal resistance (+20%)
Target 2: $55-59, analyst consensus zone (+40-47%)
Risk/Reward: 1:3 minimum
Position sizing: VIX at 31, breadth at 15. Not the environment for large bets. 1.5-2% of portfolio max. The setup is high conviction, but the market backdrop is hostile and beta 1.5 means this stock will move hard if the correction deepens. Size accordingly.
🎯 Portfolio Performance
I share entry levels, stops, and targets. Position sizes are yours to decide based on your own risk tolerance.
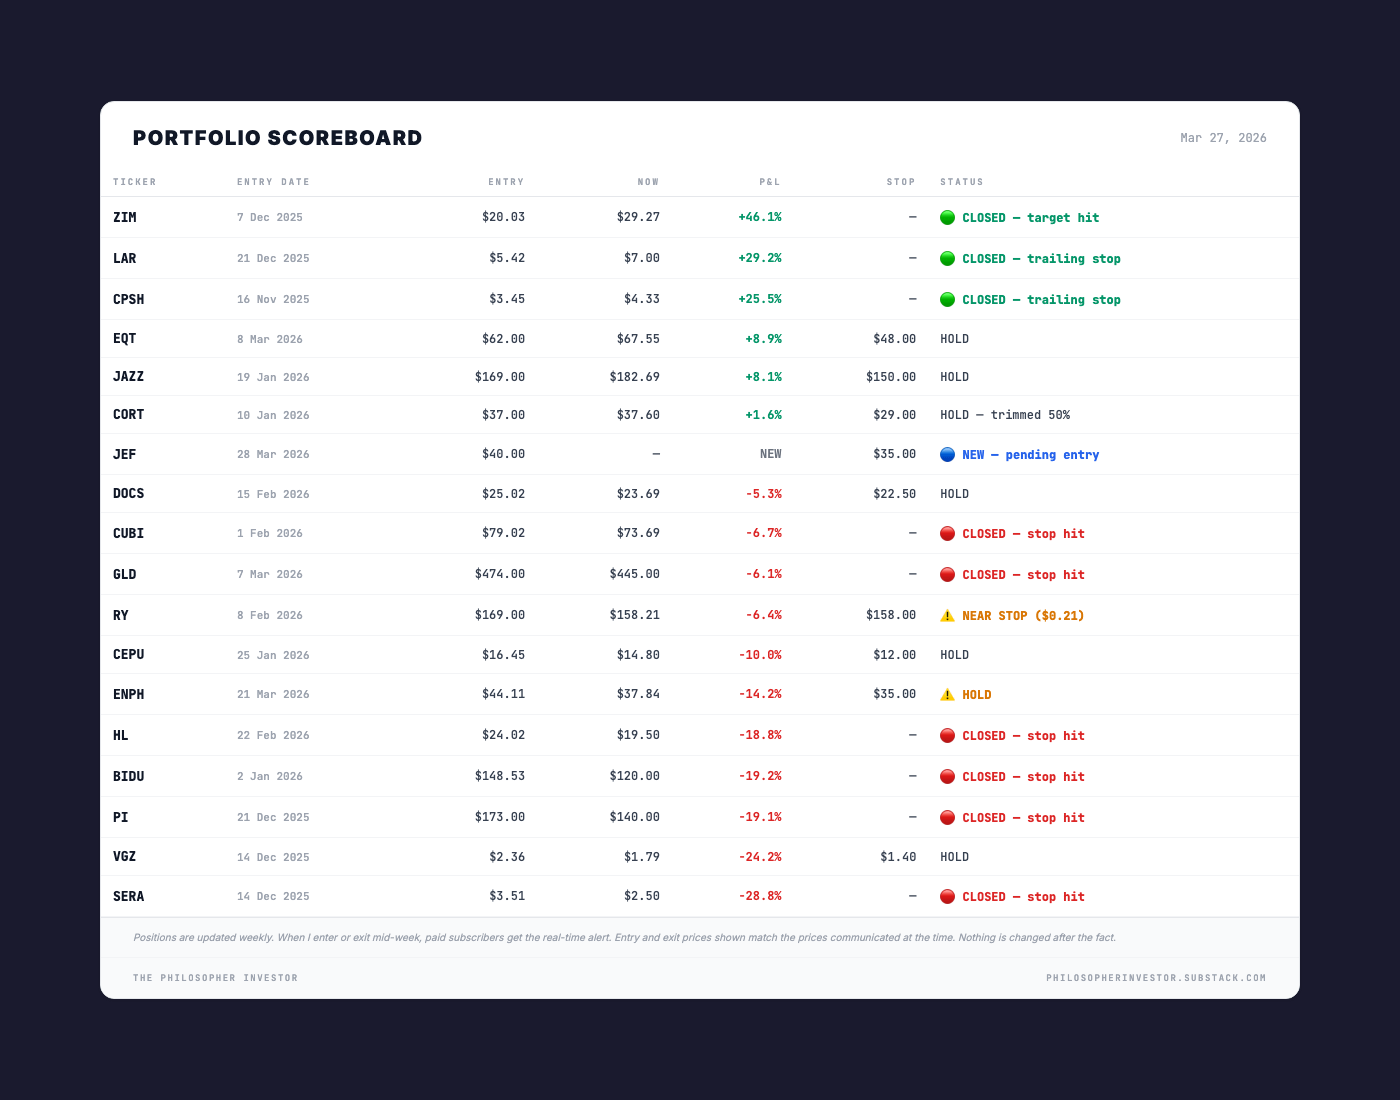
What happened this week:
ENPH was added last week at $44.11 and just lost -14.2% in a single week. Solar got swept up in the broader tech and rate-sensitive selloff. The thesis on Enphase is intact but the timing has been terrible. If it closes below $35 next week, we are out. No negotiation.
RY (Royal Bank of Canada) at $158.21 with a stop at $158. Twenty-one cents above the stop. Inches from being stopped out. Financials have the second-worst breadth on the board at 16.40%. This will almost certainly trigger on Monday unless something changes dramatically over the weekend.
The bright side: EQT at +8.9% and JAZZ at +8.1% are green in a market where barely anything is green. EQT is the energy play. Largest US natural gas producer, directly benefiting from the Hormuz premium. JAZZ is a healthcare name that does not care about tariffs or oil. These are the positions that survive corrections.
CORT at +1.6% is quietly doing its job. After trimming 50% weeks ago, the remaining half is slightly green at $37.60. Stop at $29. No action needed.
What are you watching this week? Reply to this email. I read every one.
See you next week.

Disclaimer
This newsletter is for educational and informational purposes only. It is not financial advice.
The content reflects personal opinions shared publicly as a journal. Trading stocks, options, futures, or any financial instrument involves significant risk. You can lose your entire investment. There is no guarantee of profit.
The author is not a registered investment advisor, broker, or financial professional with any regulatory authority including the SEC or CFTC. Always consult a licensed financial advisor before making any investment decisions.
By reading this newsletter, you accept full responsibility for your own trading and investment choices. Past performance does not guarantee future results. Markets are unpredictable.
Screenshots are courtesy of TradingView, VixCentral, and other platforms with which the author has no affiliation. Information shared may contain errors or become outdated quickly.
This content is the intellectual property of the author. Copying or redistributing without permission is prohibited.
By continuing to read, you acknowledge and accept these terms.
Read the desk every week
Market analysis in plain English, plus the app that scans the whole US market for you.
Become a member Read the original on Substack ↗