Oil $2.31 from stagflation. Here's the only trade.
Market Recap — March 8th 2026
2026-03-08 · 13 min read · Originally published on Substack ↗
TL;DR
Regime shift: VIX 29.49 in backwardation. Breadth collapsed -13pts to 54. Every sector red. RISK-OFF confirmed.
Oil: WTI +28% to $90.90. Brent at $92.69, just $2.31 from the $95 stagflation trigger.
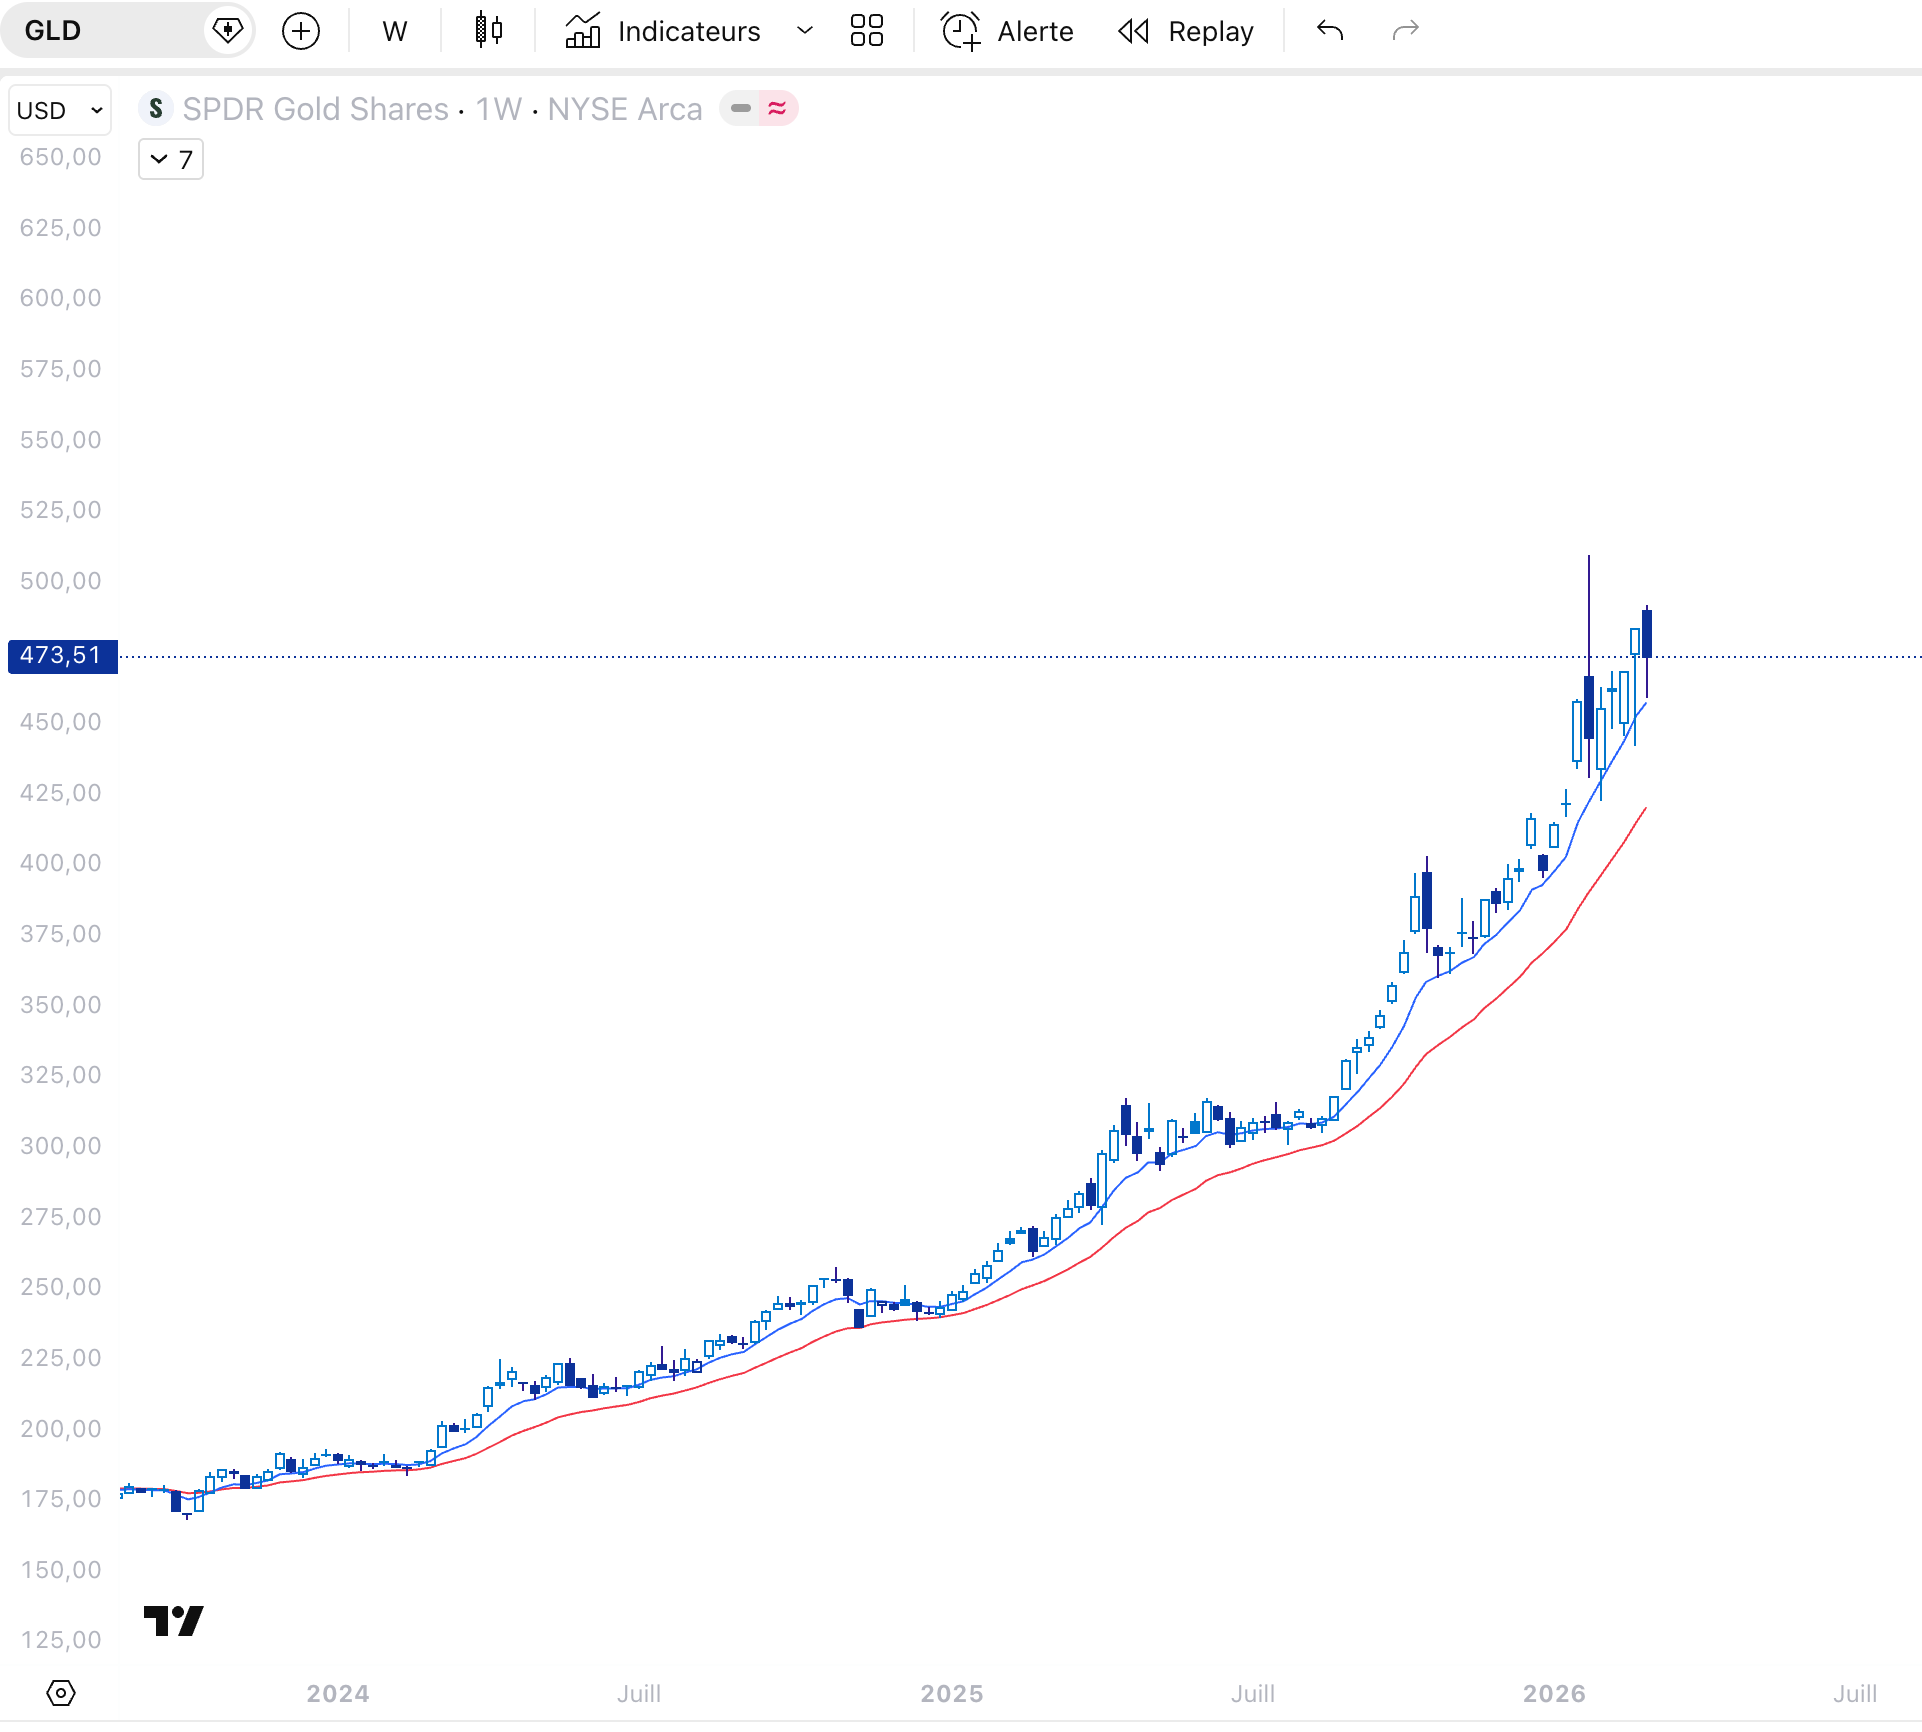
Trade: GLD. 4th consecutive week every quant signal agrees. Gold is the one.

Hello my friends,
The bombs fell. And the market responded exactly the way the data said it would.
WTI surged +28% to $90.90. Brent hit $92.69. The VIX exploded +37.5% from 21.44 to 29.49 and the term structure inverted for the first time since the 2023 banking crisis. Breadth collapsed 13 points in a single day. Every sector finished red. There was nowhere to hide.
The war in the Gulf is no longer a risk scenario. It is the baseline assumption. And everything in markets right now — breadth, volatility, rotation, flows — is downstream of one question: does Hormuz stay disrupted?
To get the most out of these market recaps and understand the framework behind my observations, I encourage you to read about my methodology here.
The $95 Line
Last week I wrote that $85 Brent was where this stops being a geopolitical event and becomes an inflation event. We blew past that in one session. Brent closed at $92.69. WTI at $90.90.
The number that matters now is $95.
Why $95 specifically? It is the level where the chain reaction starts. Each dollar of oil above $90 adds roughly 0.1% to headline CPI over 3 months. Transport, chemicals, plastics, fertilizers, everything reprices. At $95 the market stops treating the oil spike as temporary and starts pricing it as structural. That changes the Fed calculus entirely. The narrative shifts from “when do we cut” to “can we cut at all.” And if the Fed cannot cut while growth is slowing from the war and energy shock, you get stagflation the worst macro scenario for equities.
There is a political dimension too. Trump launched this operation with Brent at $72. His administration wants low energy costs. Above $95, the political pressure becomes enormous. Either he de-escalates, opens the SPR, or the market forces his hand.
We are $2.31 away from that threshold.
The Hormuz disruption is real and worsening. Tanker rates spiked. Insurance premiums on Gulf shipping doubled. Ship-tracking data shows transit volumes down 40-50% since the strikes. Iran does not need to announce a blockade. They just need to create enough risk that rational actors stop sending billion-dollar vessels through a war zone. We are already there.
The Trump pattern continues: escalation during the week, de-escalation on weekends. Markets have learned to wait for Friday before reacting. Monday opens carry all the risk now. If there is a weekend de-escalation, oil gaps down and the VIX normalizes. If there is not, $95 is the next stop. And then we have a very different conversation.
Market Verdict
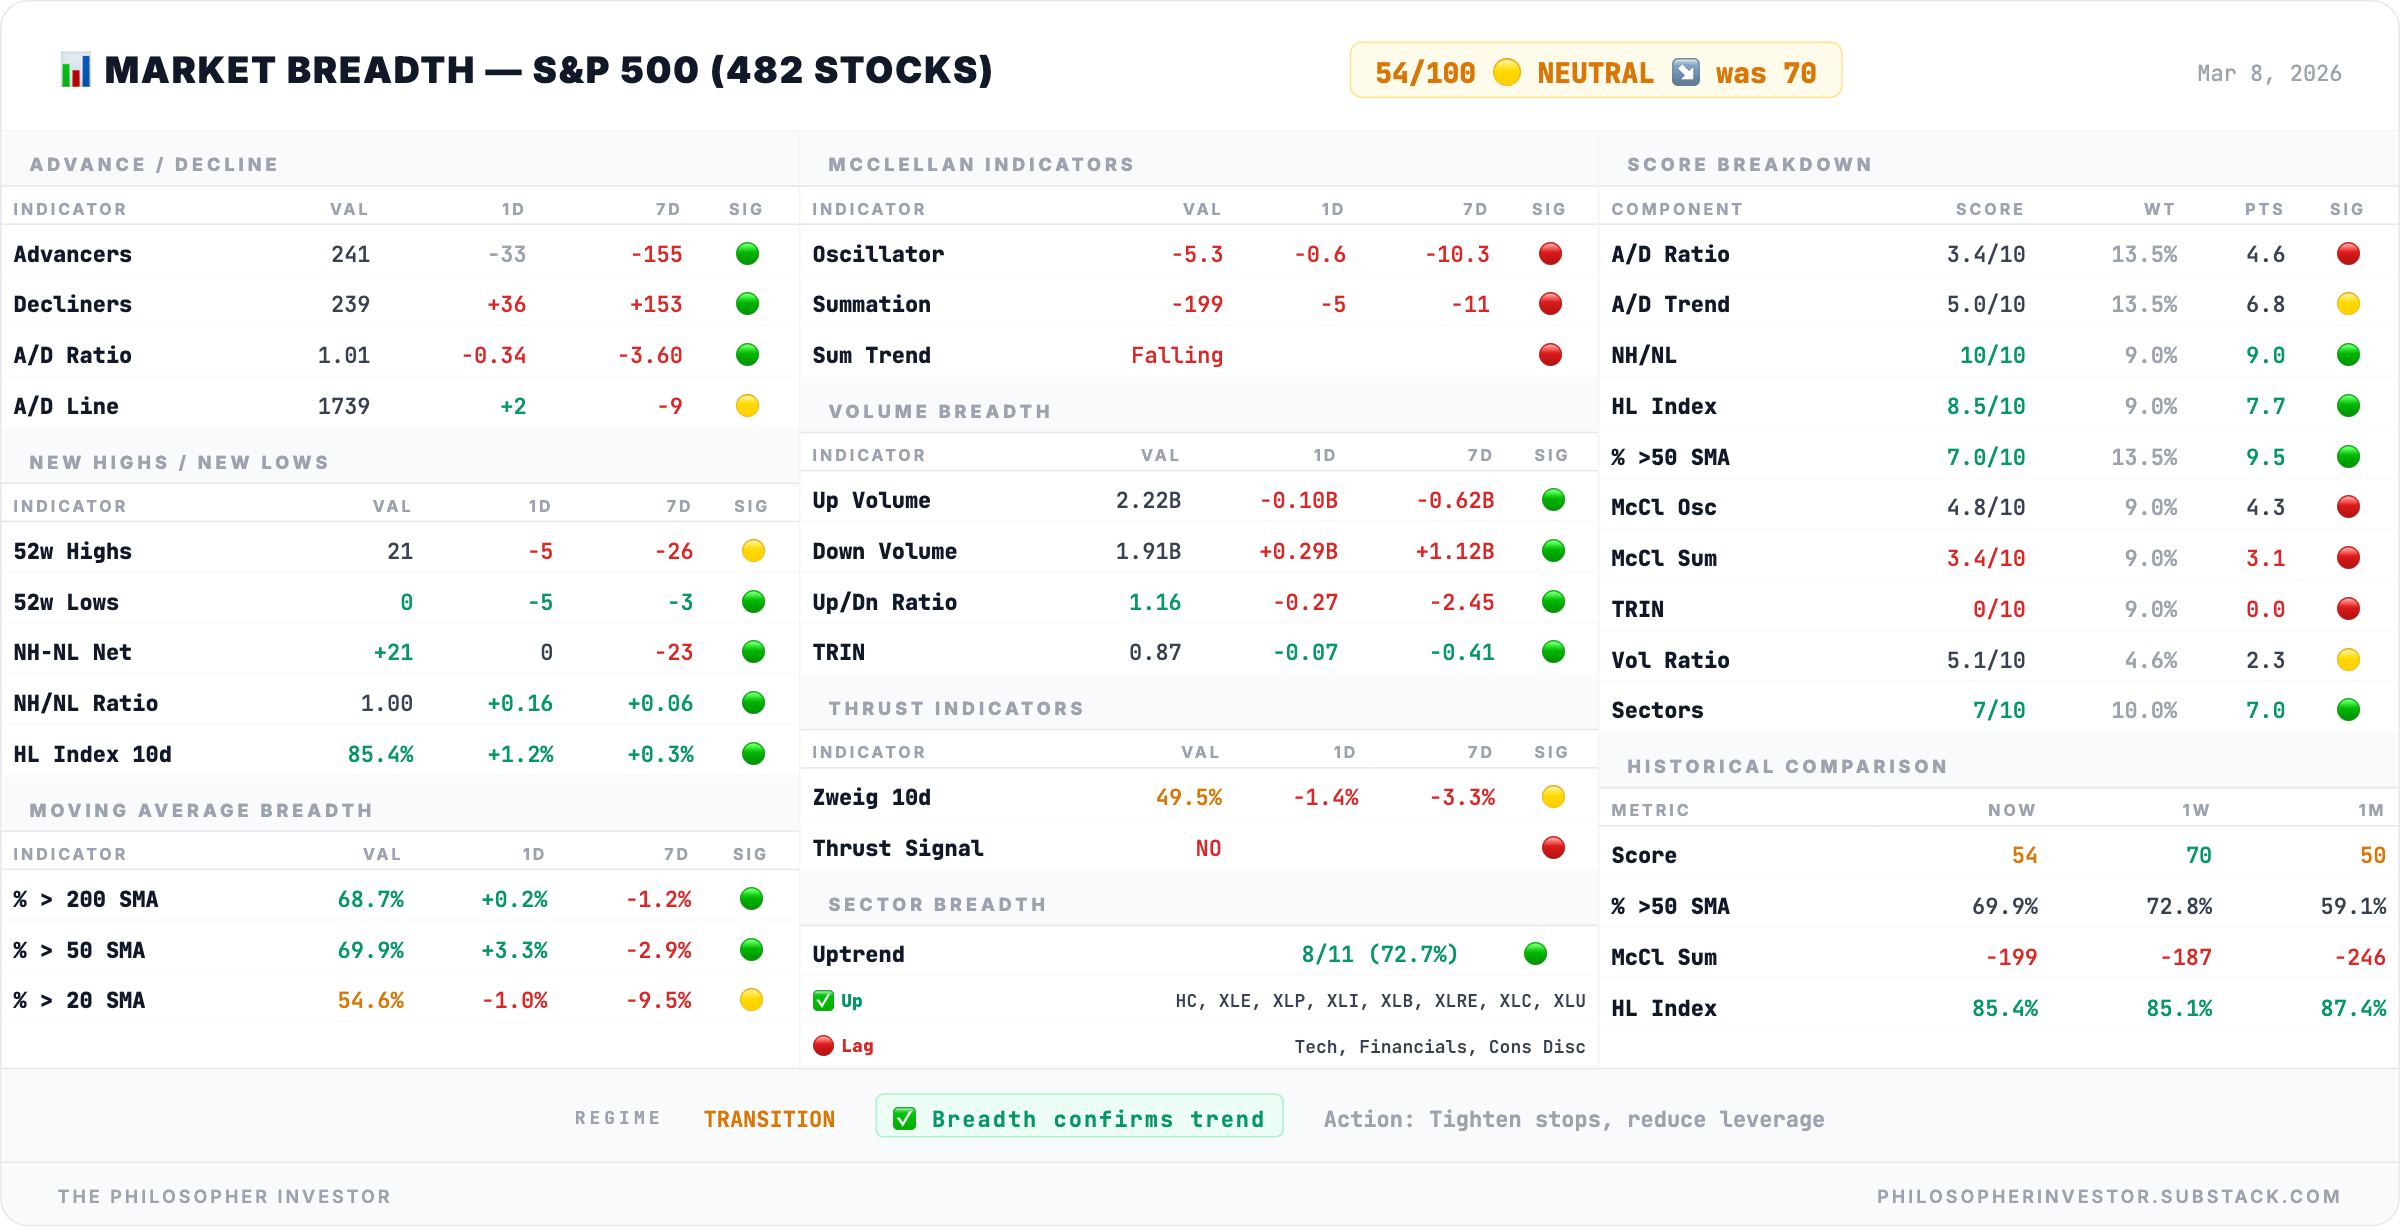
Breadth Score: 54/100 — Neutral ✅.
The advance/decline ratio (how many stocks went up vs down) collapsed from 3.98 to 1.01. Last week, nearly 4 stocks rose for every 1 that fell. This week, the market was perfectly split. Buyers and sellers in exact equilibrium. The McClellan Oscillator (a momentum indicator that measures whether buying or selling pressure is accelerating) dropped to -35. Selling pressure is building.
But here is the number that kept me from hitting the panic button: zero new lows. Despite the VIX at 29.5 and breadth at 54, not a single stock made a new 52-week low. New Highs collapsed from 62 Monday to 18 by Friday, but no new lows appeared. The High-Low Index (percentage of stocks making new highs vs new lows over the past 10 days) remains at 85.4%. Stocks are declining, not breaking. This is more consistent with a correction than a crash.
The paradox from last week, breadth rising while vol exploded, has resolved in vol’s favor. Breadth dropped from 67 to 54 with a 3-day lag, confirming the historical pattern: volatility leads, breadth follows.
🚨 Sector Update: All Red. No Shelter.
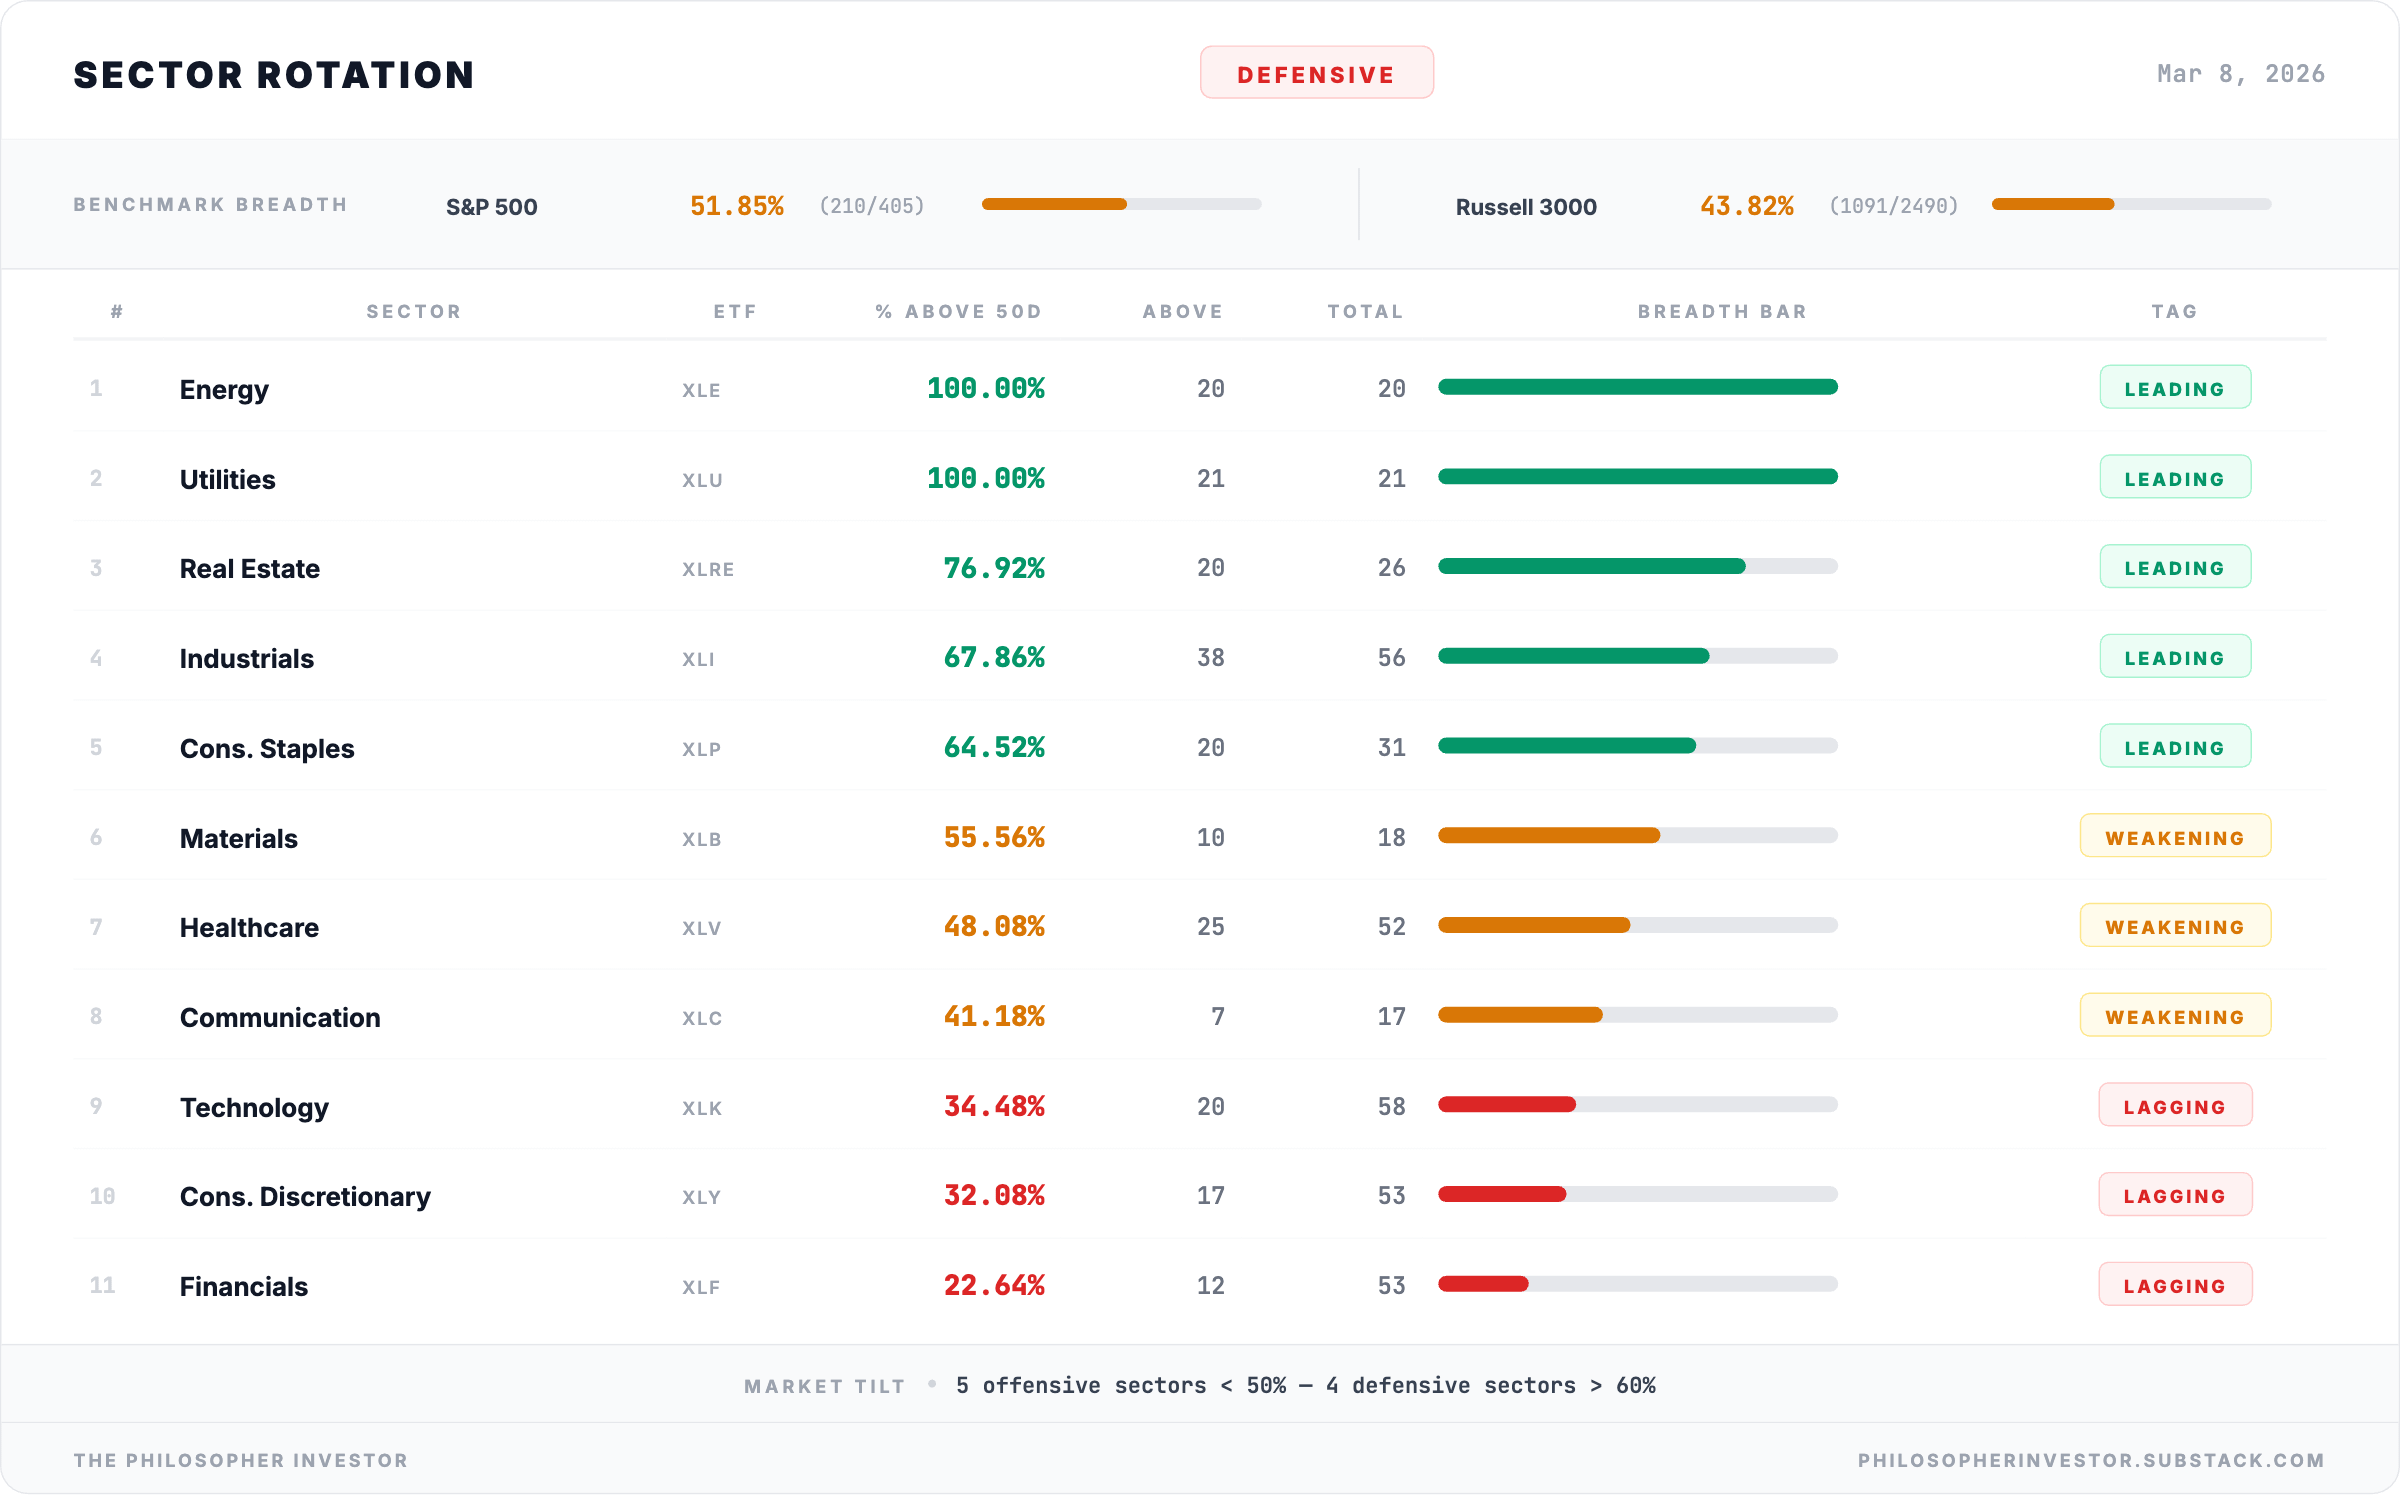
Every sector finished negative this week. There is no rotation to hide in.
Materials (XLB) -6.4% and Industrials (XLI) -5.0% hit hardest. Cyclicals leading down. Communication Services (XLC) -0.4% and Energy (XLE) -0.8% held up best, but “best” still means red. Even Utilities (XLU) down at -1.3%. When defensives sell too, that is not rotation. That is broad de-risking. The only safe sector this week was cash.
This is a significant change from last week. On March 1, I described a violent rotation: utilities and energy up, financials and tech down. That rotation has been overwhelmed by the macro shock. When oil goes +28% in a week, correlations converge. Everything sells. The market stops discriminating and starts liquidating.
XLF dropped 23 points in a single week. That is the largest sectoral degradation in the entire pipeline. From “mixed” to the weakest sector in the market in 7 days. More than 3 out of 4 bank stocks are now below their 50-day moving average.
When banks break while rates stay elevated, it means balance sheet stress. Credit risk. TLT up +1.6% this week confirms the flight to quality.
Communication (XLC) also fell from 47% to 35.3%. Three sectors — XLK, XLC, XLF — are now below 40%. These are over half the S&P 500 by weight.
The top is all real economy: utilities, energy, materials, staples. The bottom is all growth and finance. It is a regime change in sector leadership.
🔍 Divergence Score: 27/100 — LOW
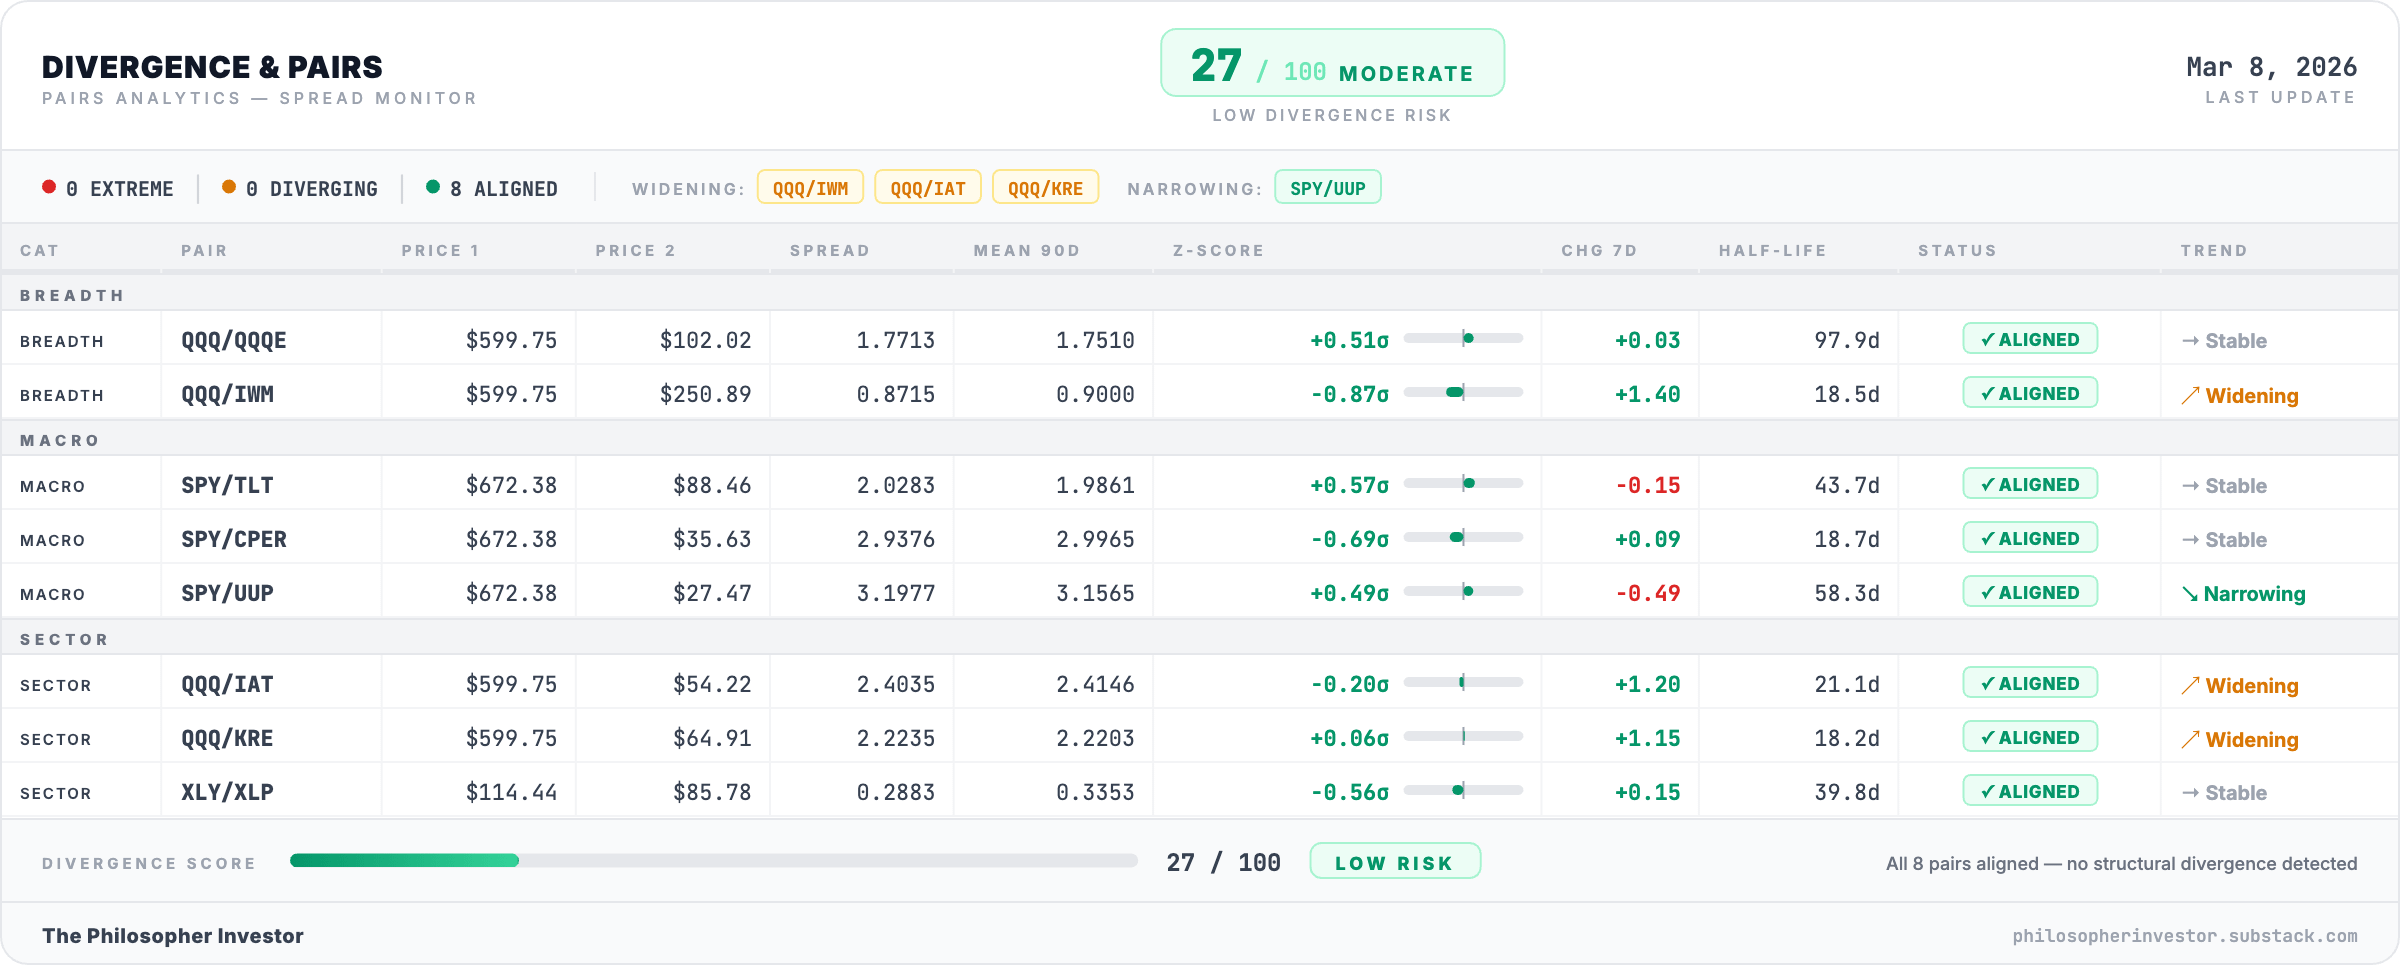
Paradoxically low. The market is well aligned, aligned to drop together. No sector is diverging from the trend. When divergence is low during a decline, it confirms a broad regime shift rather than an isolated sector problem. The dollar rising. SPY falling. Oil spiking. BTC crashing. Everything is moving in the same direction: risk-off.
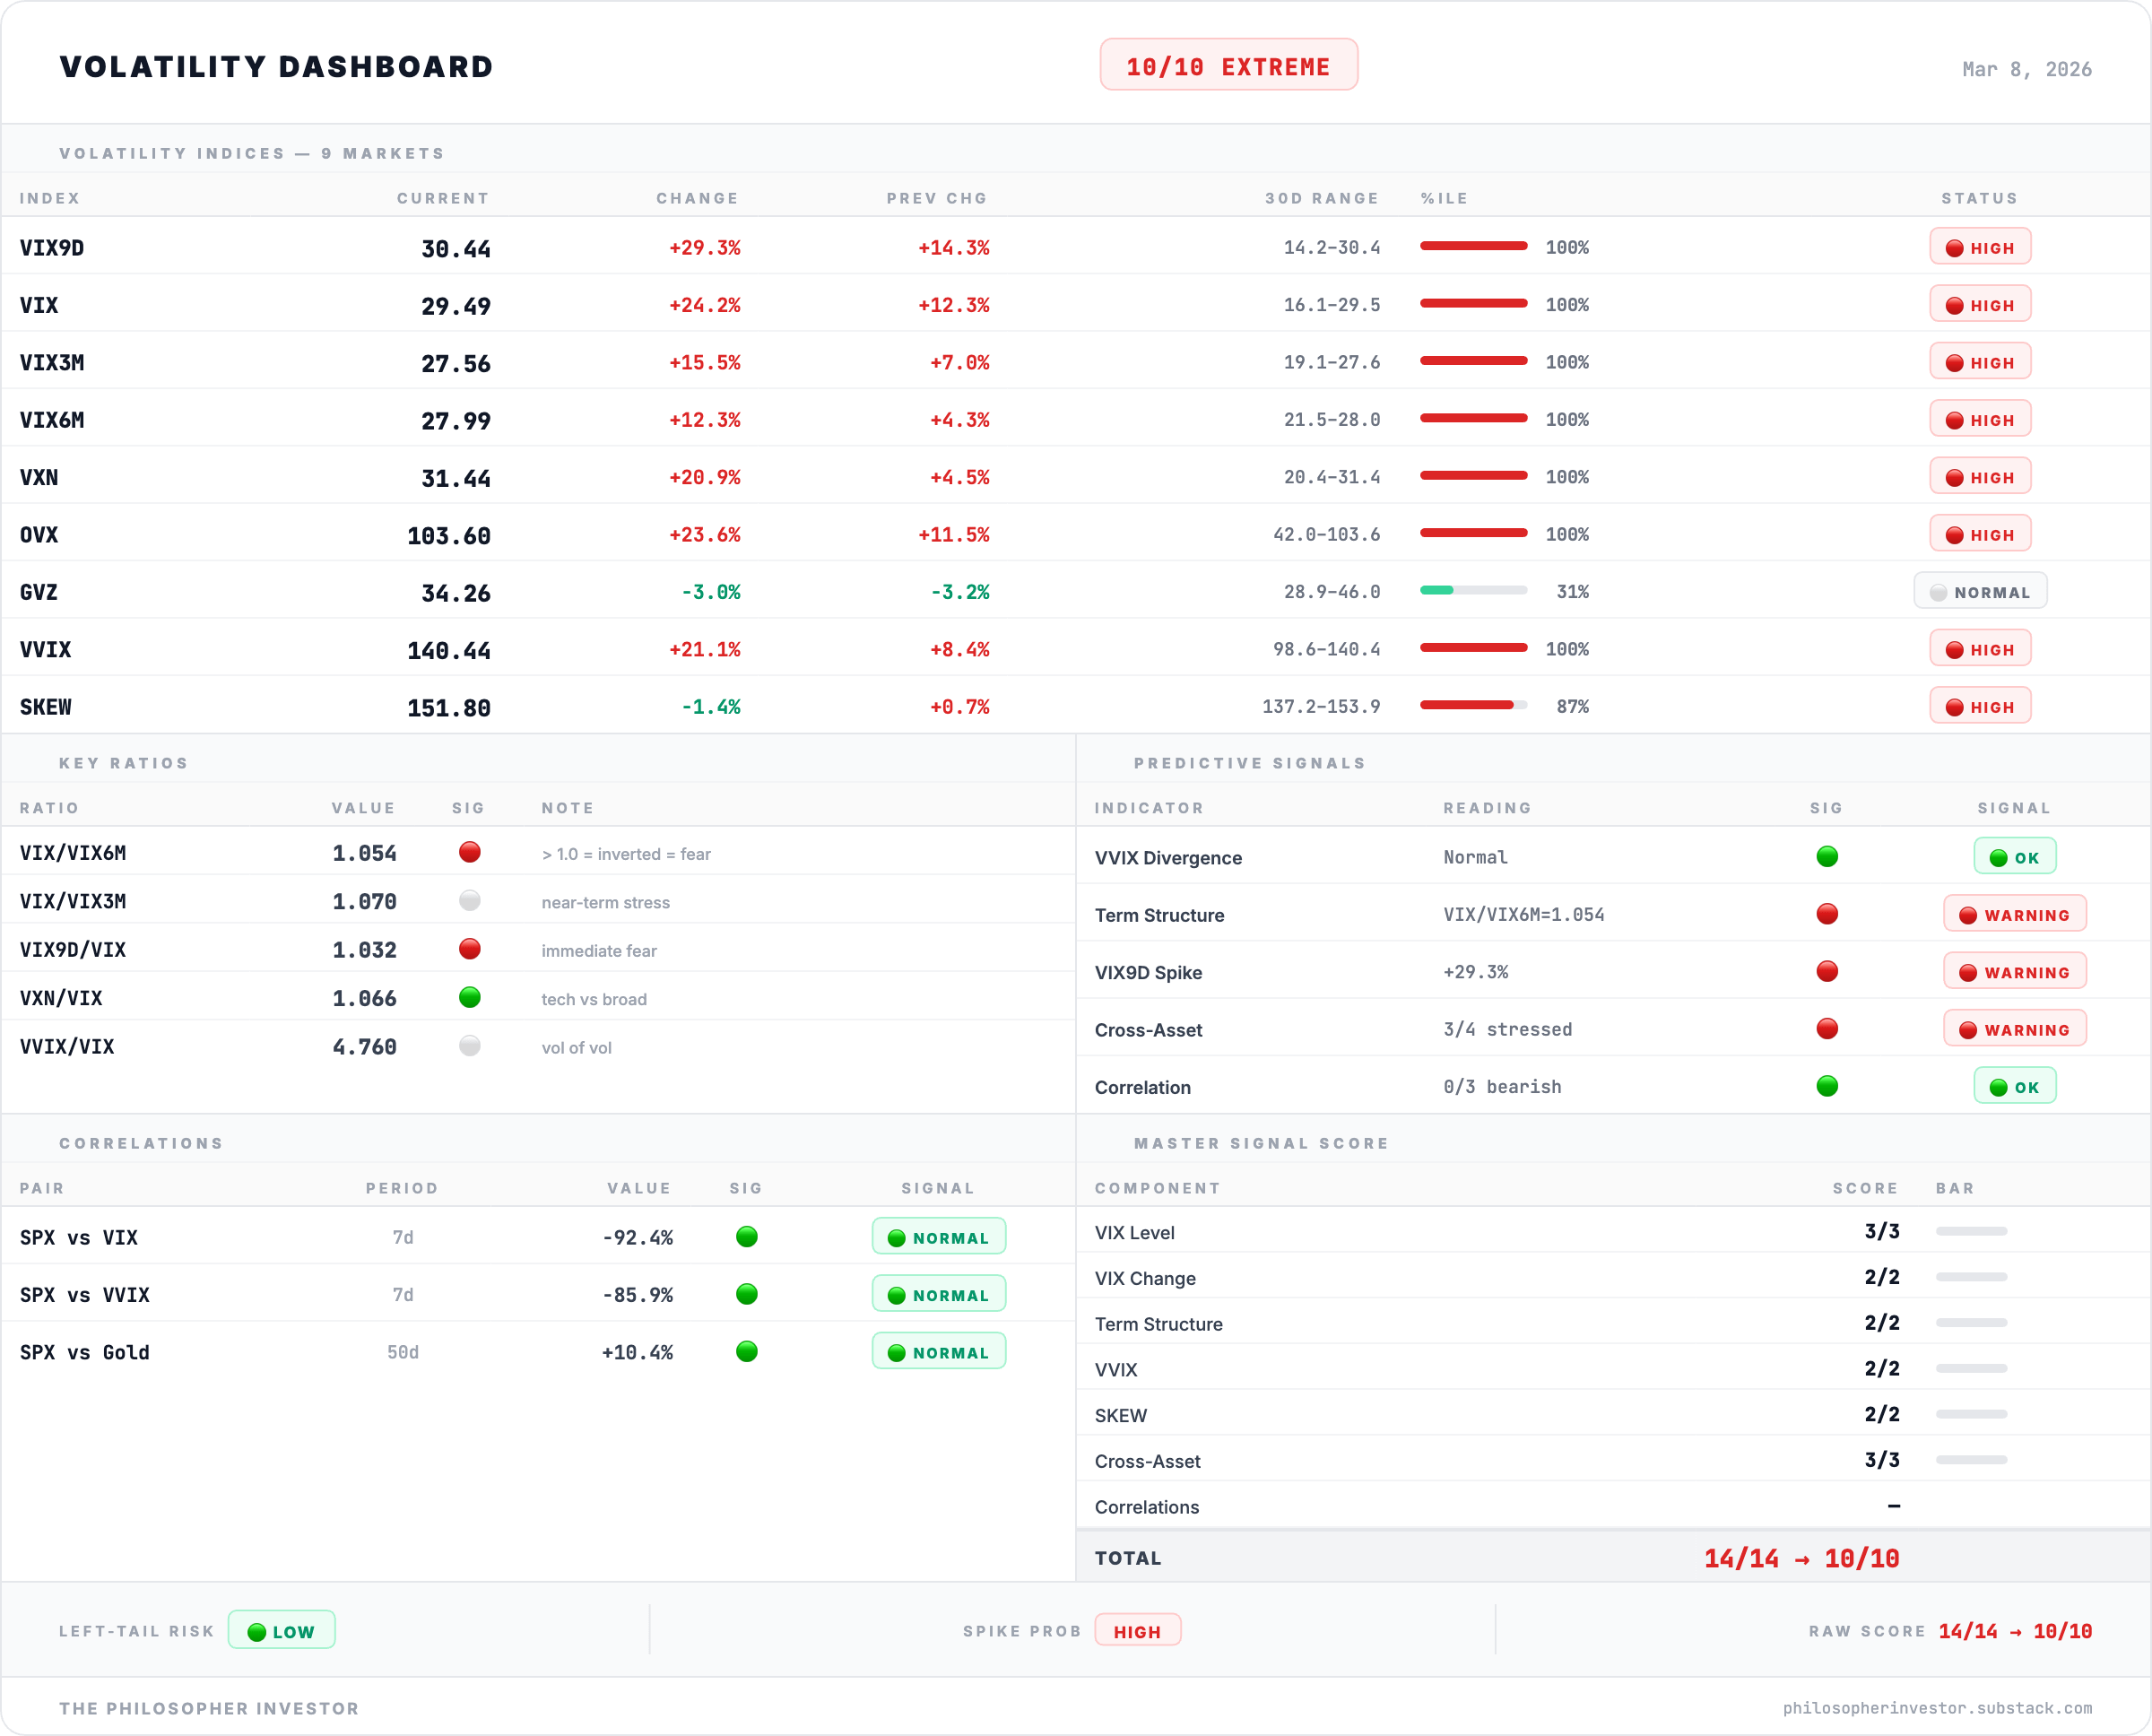
📉 Volatility: VIX 19.86. Score 5/10 MODERATE.
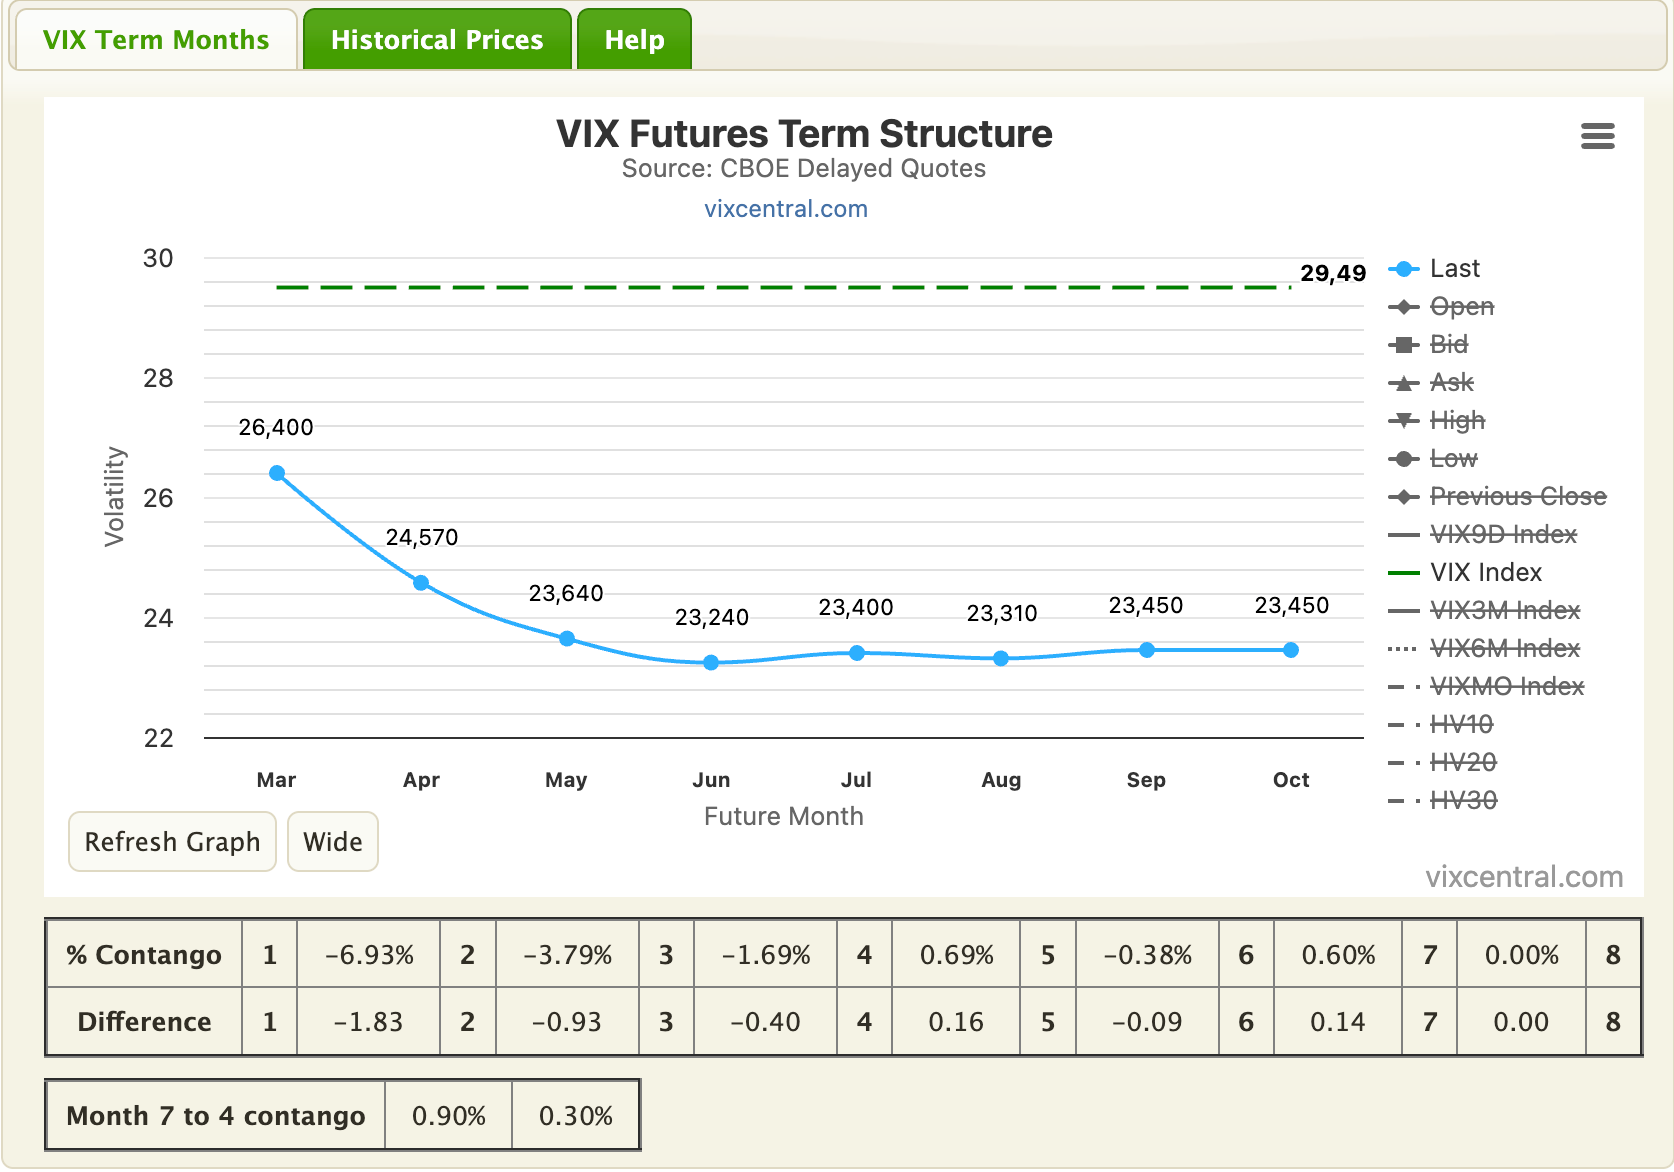
The VIX (the market’s fear gauge) hit 29.49 and the term structure inverted. This deserves its own section because the vol picture changed completely in five days.
The VIX/VIX6M ratio hit 1.05. This ratio compares what the market is willing to pay for protection over the next 30 days vs the next 6 months. Normally, longer-term protection costs more (called contango, like an upward-sloping insurance curve). When the ratio crosses above 1.0, short-term protection becomes MORE expensive than long-term. That is called backwardation. It means the market is scared right now, not about the future. It is the textbook definition of panic.
Historically, 70% of contango-to-backwardation flips resolve with a local bottom within 1-2 weeks. The other 30% lead to prolonged drawdowns lasting 4-8 weeks (2020 Covid, 2022 rate shock). You do not bet on the 70%. You prepare for the 30%. Right now, the setup looks more like the 70% scenario because supports are holding and zero new lows. But I am not adding risk until I see confirmation.
The SKEW index at 152. SKEW measures how much traders are paying for crash protection specifically (deep out-of-the-money puts). At 152, they are paying extreme premiums. The options market has not been this scared of a tail event since January. Traders are not hedging a 5% correction. They are hedging a 15% crash. When fear gets this specific, the worst is usually close to priced in. It is a historical observation.
Gold volatility (GVZ) at 34.3. Institutions are macro hedging through gold. Oil volatility (OVX) hit the 100th percentile, meaning oil options have never been more expensive relative to their own history. The oil options market saw this coming.
Nasdaq volatility vs broad market volatility (VXN/VIX) at 1.07. Nasdaq vol running only 7% above the broad market. The gap has narrowed significantly from 1.24 last week. This selloff is no longer tech-specific. It is everything. When this ratio compresses toward 1.0, it means the stress has generalized. No corner of the market is safe.
The read: fear is real but not yet panic. Backwardation is mild at 1.05, not extreme at 1.20+. Supports are holding. Zero new lows. This suggests a fear spike rather than a structural panic. A de-escalation resets the curve. An escalation deepens the inversion.
💱 FX Signal: RISK-OFF
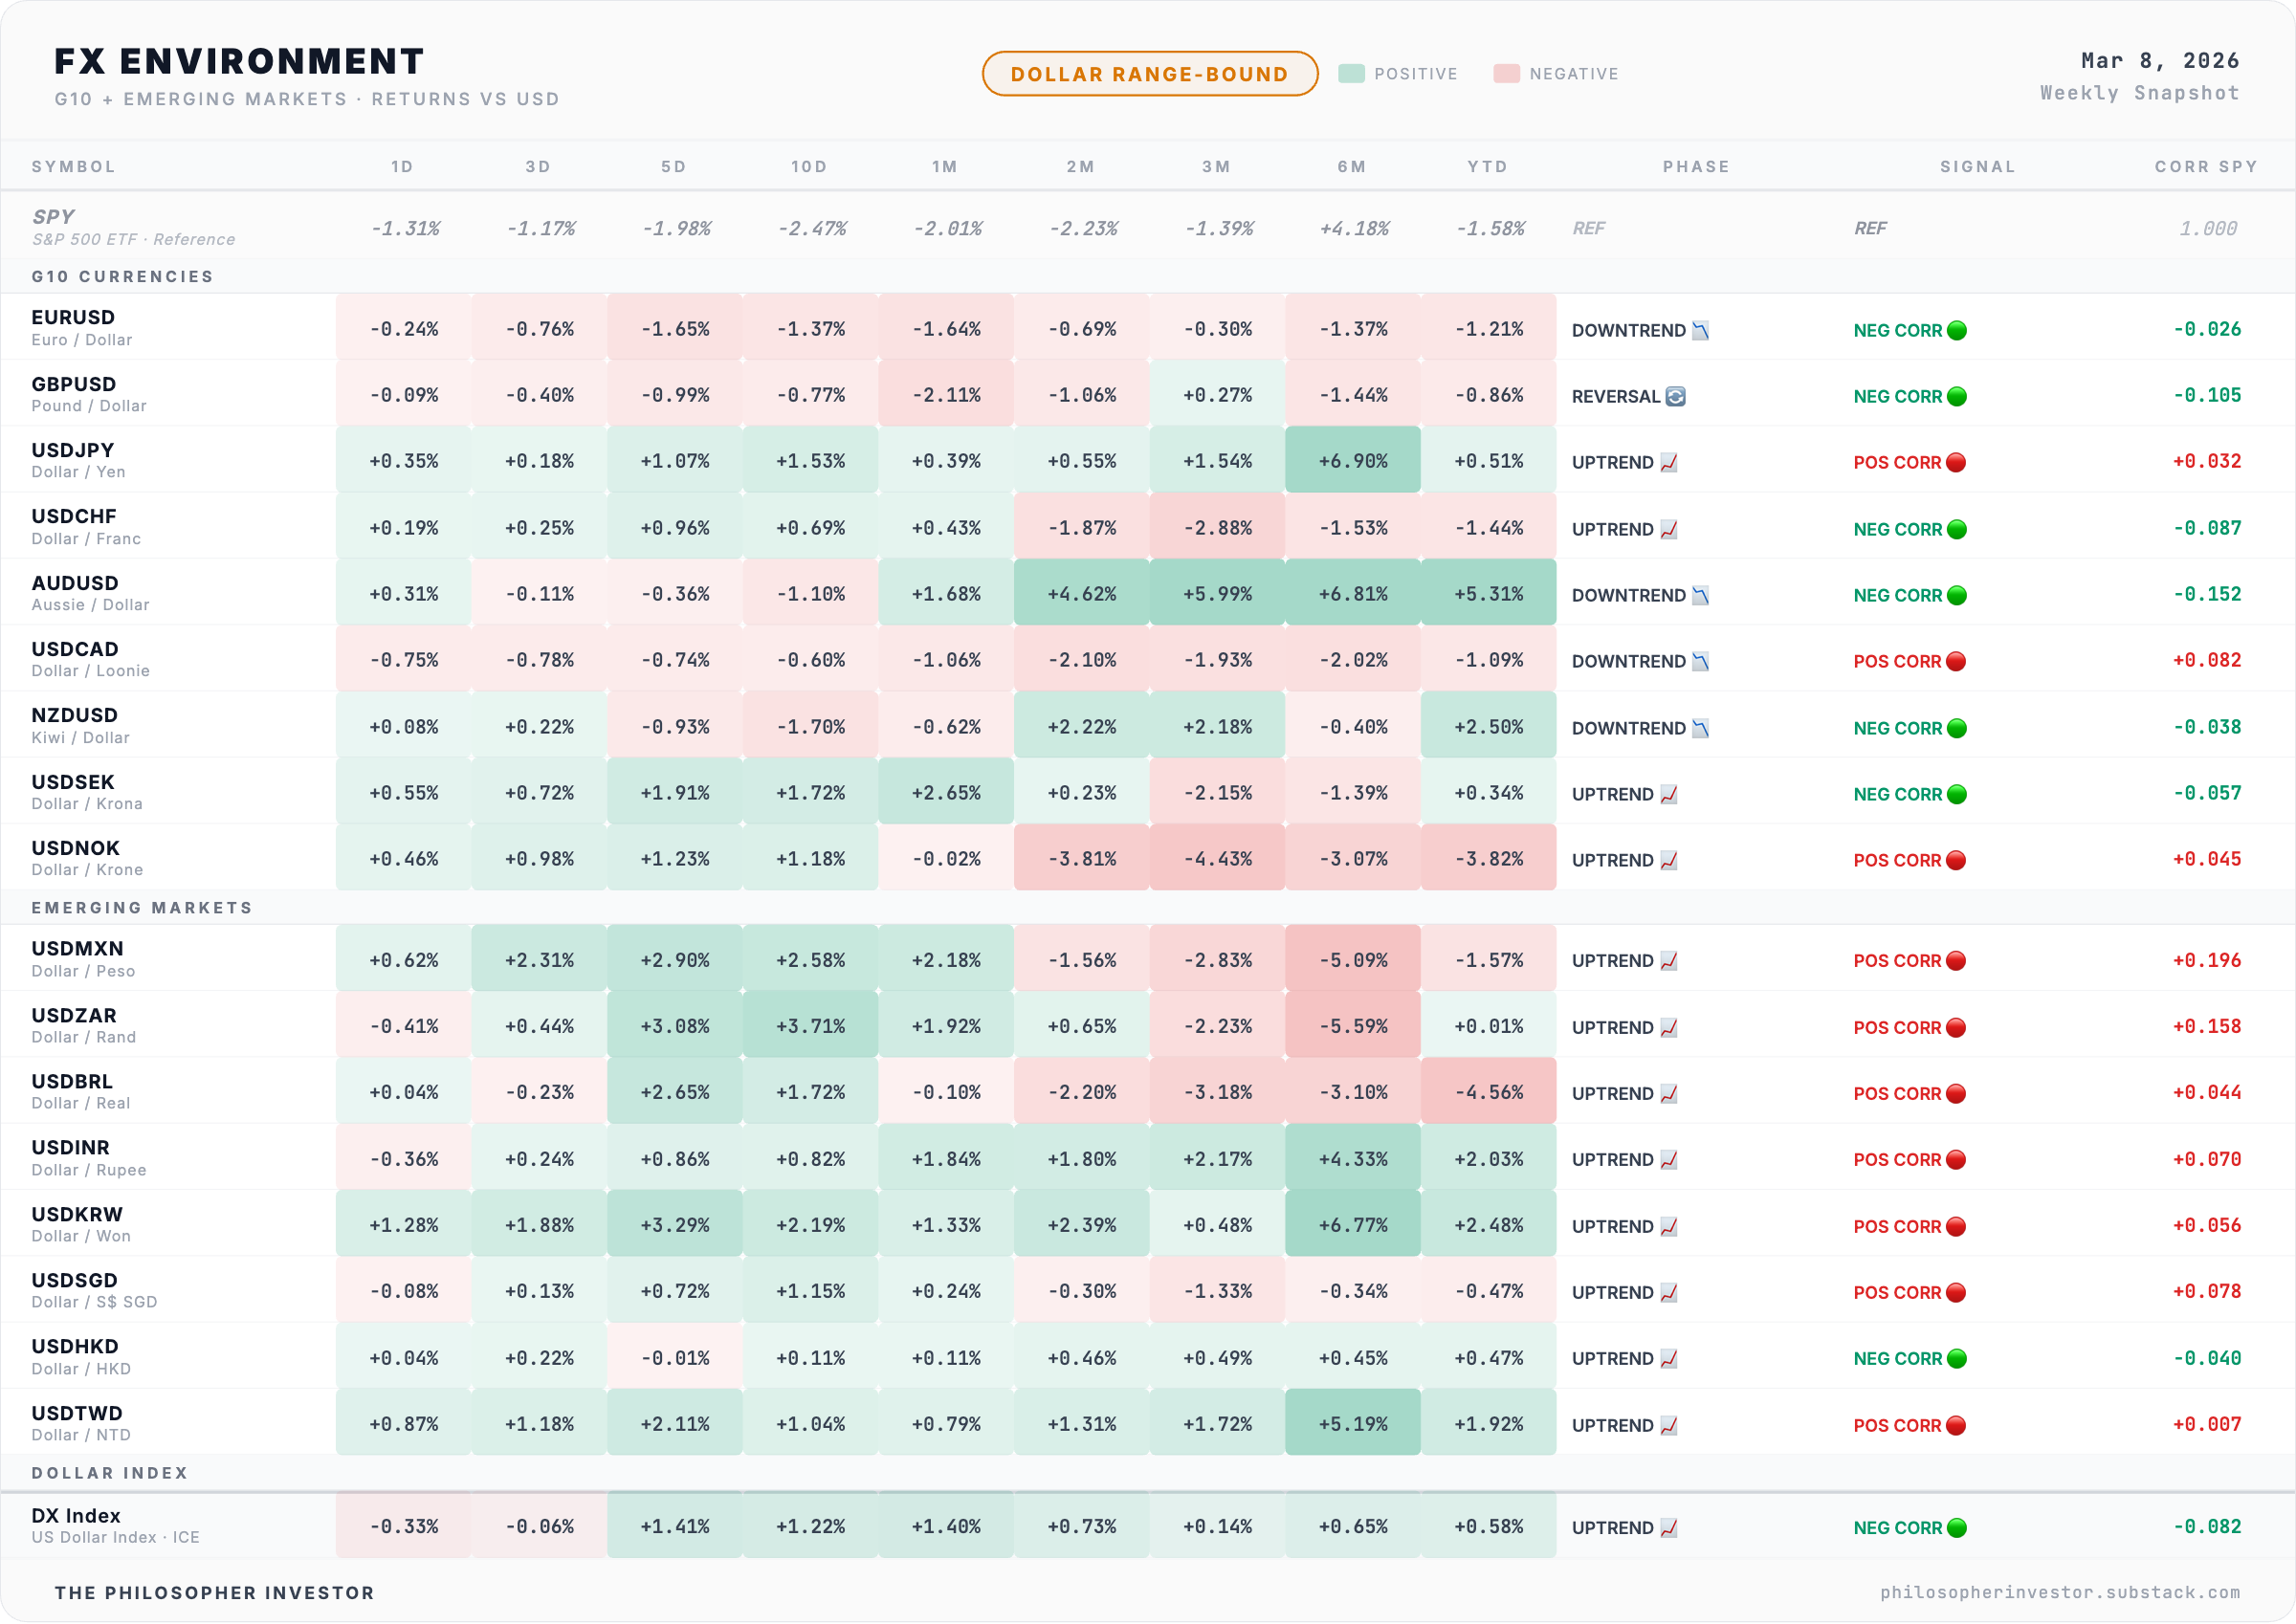
Currencies are one of the most reliable real-time indicators of global risk appetite. Here is why: when investors get scared, they move money into “safe” currencies (US dollar, Japanese yen, Swiss franc). When they feel confident, they move into “risky” currencies (Australian dollar, Mexican peso, Brazilian real) that offer higher yields but more volatility.
This week, all three safe-haven currencies are rising. All risky currencies are falling. Three out of four global regions are flashing caution. Only Europe is the exception.
The dollar is strengthening. That is a double-edged signal. A strong dollar is good for US purchasing power but bad for two groups: American companies that sell overseas (their foreign revenue is worth less when converted back to dollars) and emerging markets (many of their debts are denominated in dollars, so a stronger dollar makes those debts more expensive to service).
The FX market moves $7.5 trillion per day. It is the largest, most liquid market in the world. When currency traders, who are overwhelmingly institutional, all move to safety at the same time, it confirms what every other signal is saying.
🧠 My Take
The triple trigger I set last week, VIX > 26, ratio > 1.0, breadth < 55, has activated. The conditional hedge from last week’s premium memo is live. If you followed the playbook, you were prepared. If you did not, Monday is your chance.
But I am not calling a crash. The data does not support it yet. Zero new lows. High-Low Index at 85.4%. Bottom triggers steady at 15 (in a real crash, they explode above 50). The advance/decline ratio at 1.01, not deeply negative. This looks like an orderly correction amplified by a geopolitical shock, not a systemic breakdown.
The most telling signal is what smart money is doing: nothing. Zero high-conviction insider buys on Form 4 (the SEC filing that tracks insider transactions) this week. When the VIX spikes to 29.5 and insiders do not step in, they expect more to come.
Scenario matrix for March 10-14:
Scenario E, Relief Rally (30%): Weekend de-escalation, VIX drops below 26, breadth stabilizes above 50. SPY retests $680. Most likely if Trump announces progress on Iran.
Scenario F, Grind Down (25%): VIX stays above 28, no new lows. Grinding lower toward the 50-day moving average at $660-665. No panic but persistent selling. Oil stays above $85.
Scenario H, Crash Risk (30%): VIX stays elevated, breadth breaks 45, new lows appear. SPY tests the 200-day moving average at $645-650. Requires weekend escalation: Iran, tariffs, or crypto contagion.
Scenario G, Capitulation (15%): VIX drops but breadth collapses below 45. New lows emerge. Slow death. Least likely given zero new lows today.
🔥 Trade of the Week: Gold
Gold is the only trade where every signal in my pipeline agrees. Four weeks in a row now.
This is not a new call. I have been building the gold thesis for weeks. But the convergence this week is the strongest I have seen, and this time the screener data backs it up with hard numbers.
Why gold, why now.
My Dual Momentum model (which ranks assets by price momentum across multiple timeframes) has GLD (gold ETF) ranked #1 across all horizons: 1-month, 3-month, 6-month, 12-month returns all positive and accelerating. Zero US equities in the top 3. It is GLD, DBC (commodities ETF), and EFA (international equities ETF). This is the 4th consecutive week with zero US allocation.
VRP (Volatility Risk Premium, the gap between what the market expects and what actually happens) at extreme levels. Implied vol running 40% above realized on gold. Gold volatility (GVZ) at 34.3, elevated and trending higher. This is not fear vol. This is directional vol. Gold is moving because it is being bought, not because it is being hedged.
Every sector finished red this week. Money has nowhere to hide except gold and cash. Oil +28% with VIX in backwardation. BTC collapsing (so much for “digital gold”). The dollar strengthening is a headwind, but in every historical instance where the VIX inverted and oil spiked simultaneously, gold overwhelmed the dollar drag. Fear beats currency mechanics.
What the options flow is telling us.
GLD options: put/call volume ratio at 0.38 (ultra bullish, meaning nearly 3 calls traded for every put). GEX (Gamma Exposure, a measure of how options dealers are positioned) at +$434M. When GEX is this positive, dealers are “long gamma,” which means they buy dips and sell rips automatically. It acts like a shock absorber. GLD has a floor under it right now.
GDX (gold miners ETF) options: two BULLISH SWEEPS flagged on March 4 and 6. $1.2M and $558K in call premium, strikes $106-$109, expiring March 13. That is $1.8M in short-dated call bets from institutional traders. When someone sweeps the ask on calls (pays whatever price to get filled immediately) with a week to expiry, they expect a move and they expect it fast.
Whale activity on 13F filings (quarterly institutional holdings reports): NEM (Newmont, the world’s largest gold miner) saw one fund increase its position by +496%. GDX accumulation up +208%. VGZ (Vista Gold) up +65%. Smart money has been building gold positions quietly for weeks.
The critical divergence.
GLD dropped -3.6% this week. Gold miners dropped -12%. Miners sold off 3x harder than the metal itself. This is a liquidity-driven selloff, not a fundamental one. Miners have real earnings leverage to gold prices. Historically, when this gap between gold and miners gets this wide, the miners snap back violently to close the spread. That is where the real opportunity is.
5 ways to play this (from conservative to aggressive):
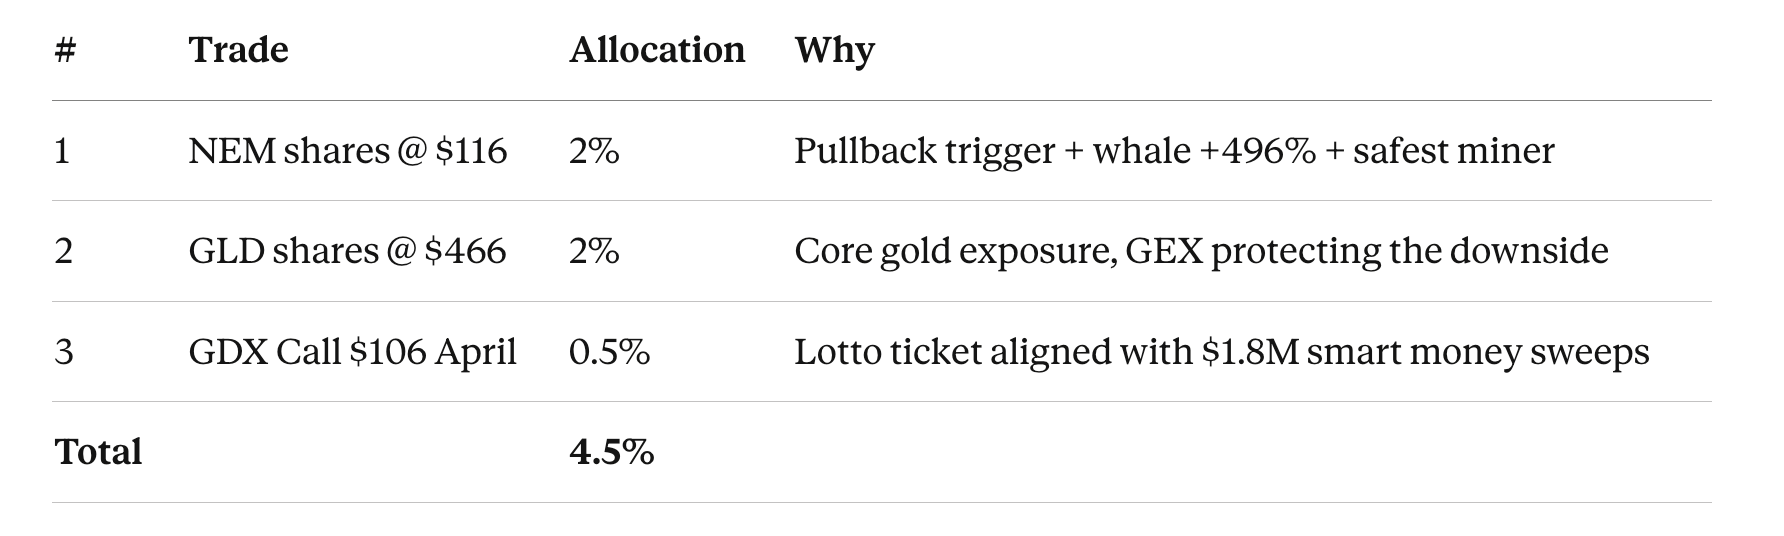
Play 1: GLD shares (Conservative). The simplest expression. Buy gold, hold gold. No time decay, no premium to pay, and the GEX at +$434M means dealers are stabilizing the downside.
Play 2: GDX shares (Aggressive, miners catch-up). The mean reversion play. Miners are down -12% vs gold -3.6%. The two bullish sweeps ($1.8M in call premium) and whale accumulation (+208%) confirm smart money conviction. GDX has negative GEX (-$1.4M), which means when it bounces, dealers amplify the move instead of dampening it. Sharper moves both ways. Entry: $100-102. Stop: $94. Target 1: $110 (+8%, return to 20-day moving average). Target 2: $120 (+18%, return to recent highs). Size: 2-3% of portfolio.
Play 3: NEM shares (Conviction, best single miner). Newmont is the highest quality name in the space. $127B market cap, pays a dividend, beta of 0.39 (moves less than the broad market). My pullback screener scored it 80/100, the highest among miners. One whale fund increased its position by +496%. Currently sitting right at the 38.2% Fibonacci retracement (a classic buy-the-dip level in an uptrend). Entry: $116. Stop: $108 (below the 50% retracement). Target: $135-140 (return to recent highs, +16-21%). Size: 2% of portfolio.
Play 4: GLD calls (Moderate leverage). GLD implied volatility at 33.7% is reasonable. You are not overpaying for options here. Buy the $470 strike call with 45-60 days to expiry (April or May). This gives you 5-7x leverage on the gold move with time to let the thesis play out. Entry: ~$12-15 per contract. Stop: -50% of the premium paid. Target: GLD at $500 = call worth ~$32-35 (+120%). Size: 1-2% of portfolio.
Play 5: GDX calls (Speculative, lotto ticket). GDX implied volatility at 54.2% is elevated, you are paying a premium. But the institutional sweeps targeted exactly these strikes ($106, $109). If the smart money is right, the payout is explosive. If GDX sits sideways, time decay eats the position quickly. Binary. Entry: ~$2-4 per contract, $106-$110 strike, April expiry. Stop: -60% of premium. Target: GDX at $115 = call worth ~$10 (+250%). Size: 0.5-1% max.
My combo
3 scenarios for gold over the next 4-6 weeks:
Scenario A, Bull (40% probability). Hormuz persists, inflation stays sticky, the Fed is trapped, central banks keep buying. GLD to $520-550 (+12-18%). GDX to $140-150 (+37-47%). NEM to $160-170 (+38-47%). Best play: GDX shares or calls for max leverage.
Scenario B, Base case (45% probability). Hormuz calms down, VIX drops below 20, partial risk-on returns. GLD ranges $460-500 (+0-7%). GDX rebounds to $110-115 (+8-13%). NEM rebounds to $125-130 (+8-12%). Best play: GLD or NEM shares. Avoid options, the range kills premium.
Scenario C, Liquidation (15% probability). Margin calls force selling across all assets (the 2020 playbook). Gold dips to $430-440 before bouncing. GDX plunges to $85-90. NEM to $100-105. Best play: wait with cash. If this happens, it is the entry of the year on GDX and NEM.
What I’m Watching
Iran / Oil: $95 Brent is the stagflation trigger. We are $2.31 away. Watch Hormuz transit data and tanker rates daily. If weekend de-escalation happens, oil gaps down hard. If not, $95 by midweek.
VIX: Backwardation above 1.15 = deep panic = possible bottom signal. Below 1.0 = de-escalation trade. The VIX/VIX6M ratio is the single most important number next week.
MSTR: $25M in calls expiring March 13. Binary by Wednesday. $145 strike is the line. BTC at $67K, MSTR at $133.53. Requires BTC bounce above $75K for calls to gain value.
SPY: Testing $672. Next level: $660-$665 (50-day moving average). Last line: $645-$650 (200-day moving average).
Insiders: Zero high-conviction buys this week. Smart money is waiting. So am I.
Screeners: 41 pullback triggers, 15 bottom signals, zero blowoff tops across 2,537 stocks. Signals unchanged despite a +37.5% VIX spike. In a real crash, bottom triggers explode above 50. They held at 15. Correction, not crash.
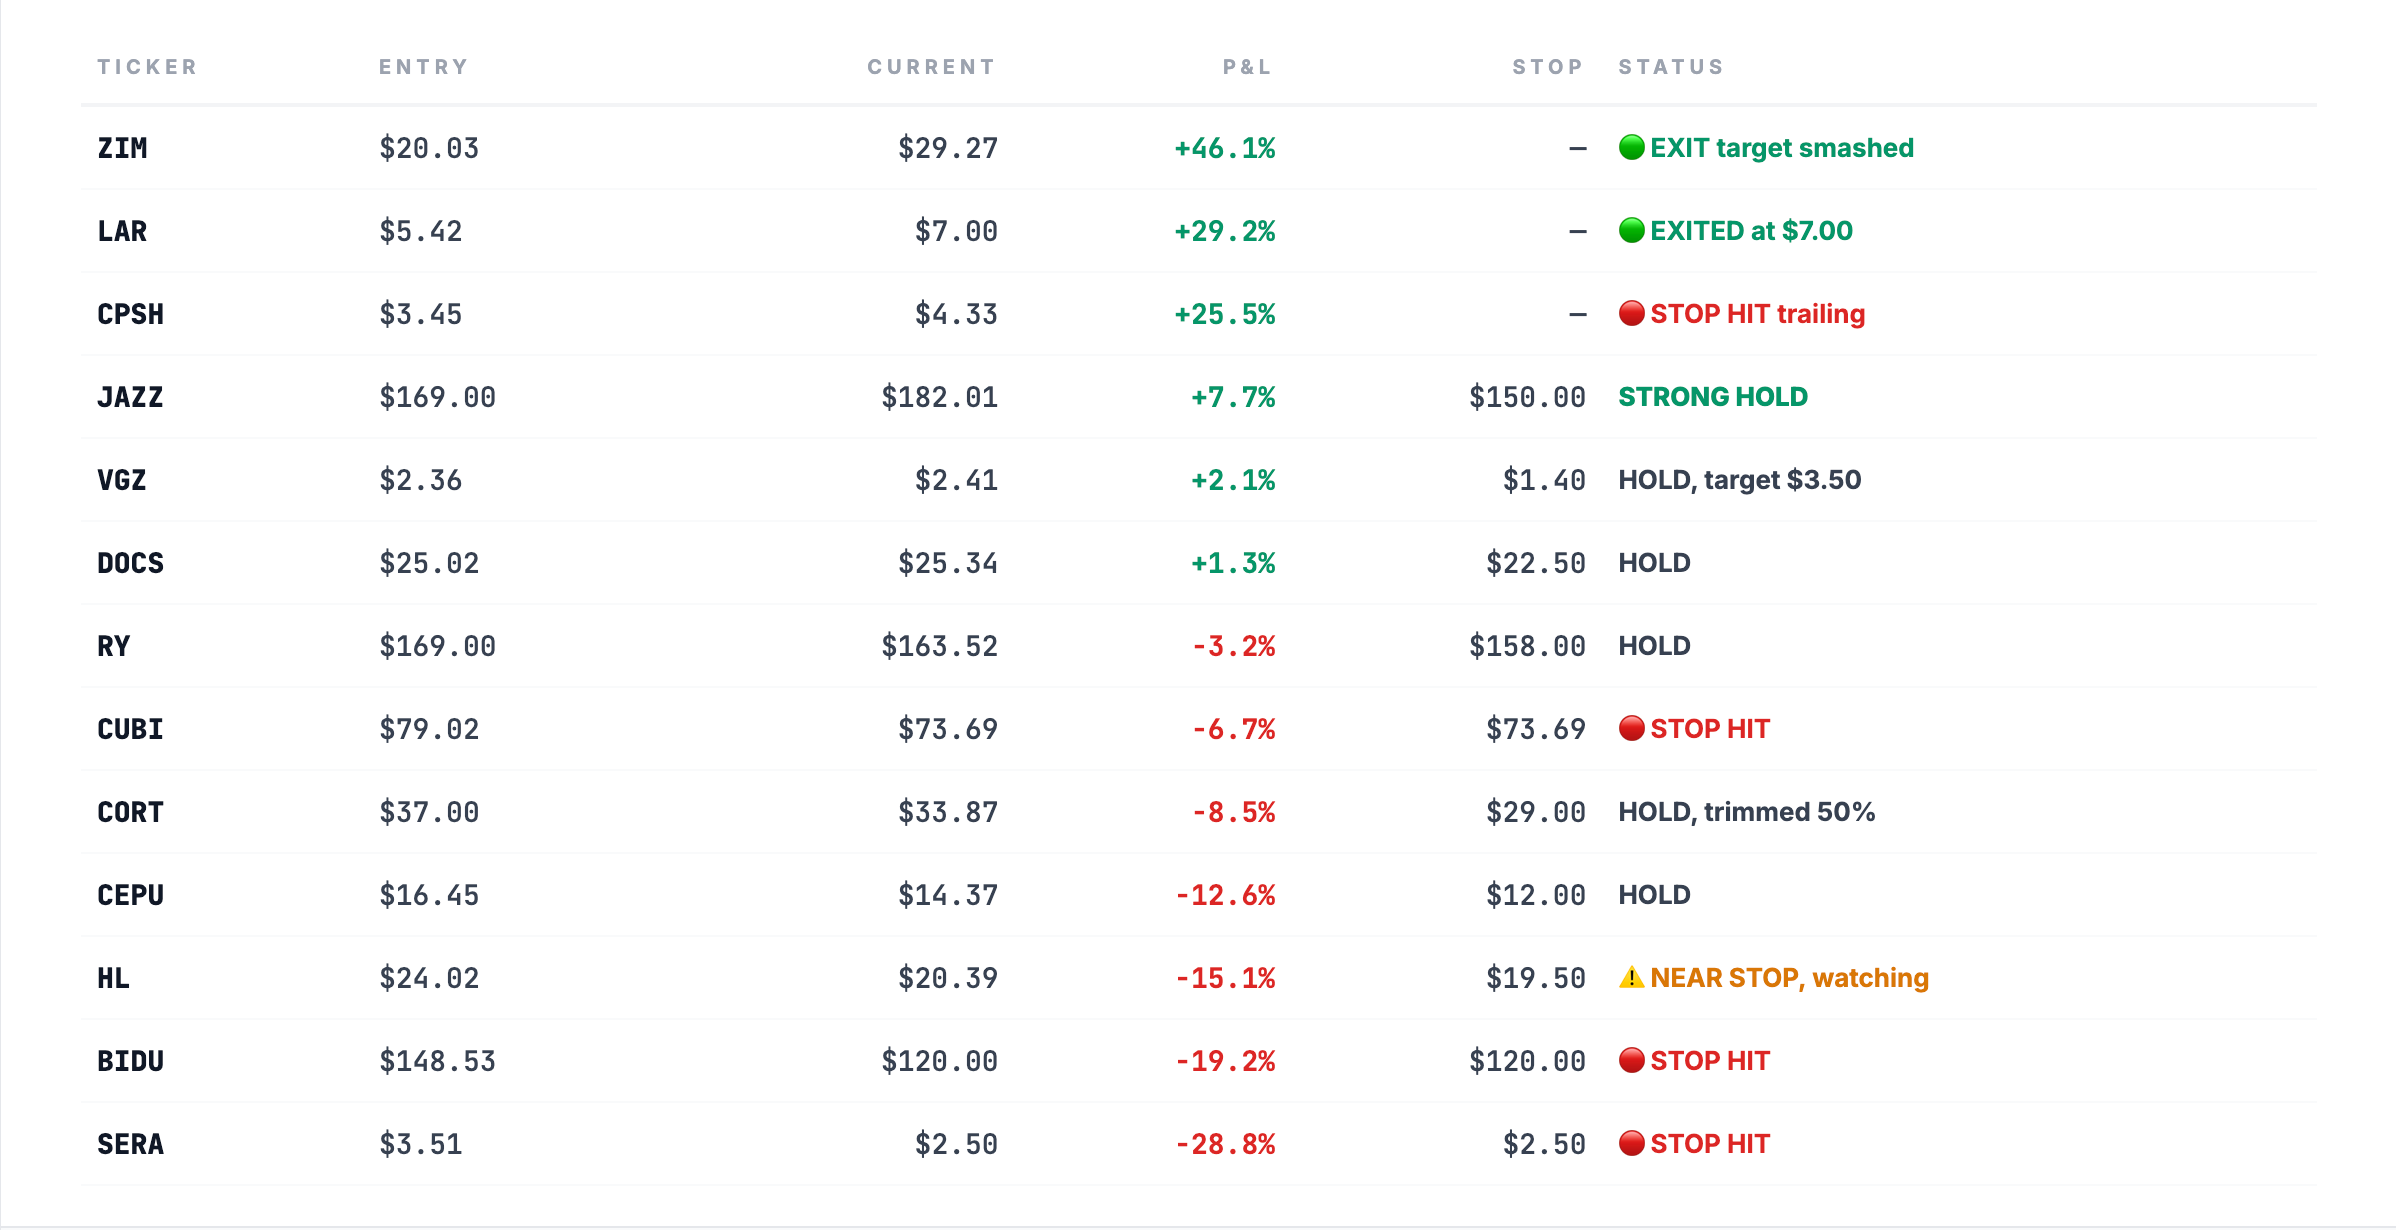
🎯 Portfolio performance
What are you watching this week? Reply to this email. I read every one.
See you next week.

Disclaimer
This newsletter is for educational and informational purposes only. It is not financial advice.
The content reflects personal opinions shared publicly as a journal. Trading stocks, options, futures, or any financial instrument involves significant risk. You can lose your entire investment. There is no guarantee of profit.
The author is not a registered investment advisor, broker, or financial professional with any regulatory authority including the SEC or CFTC. Always consult a licensed financial advisor before making any investment decisions.
By reading this newsletter, you accept full responsibility for your own trading and investment choices. Past performance does not guarantee future results. Markets are unpredictable.
Screenshots are courtesy of TradingView, VixCentral, and other platforms with which the author has no affiliation. Information shared may contain errors or become outdated quickly.
This content is the intellectual property of the author. Copying or redistributing without permission is prohibited.
By continuing to read, you acknowledge and accept these terms.
Read the desk every week
Market analysis in plain English, plus the app that scans the whole US market for you.
Become a member Read the original on Substack ↗