The Bond Market Doesn't Believe This Rally
Market Recap — April 26th 2026
2026-04-26 · 7 min read · Originally published on Substack ↗
TL;DR
Two macro pairs broke this week. Mega-caps pulling away from the rest of the Nasdaq (+2.12σ). Equities ripping while long bonds refuse to follow (+2.33σ). The bond market doesn't believe the rally.
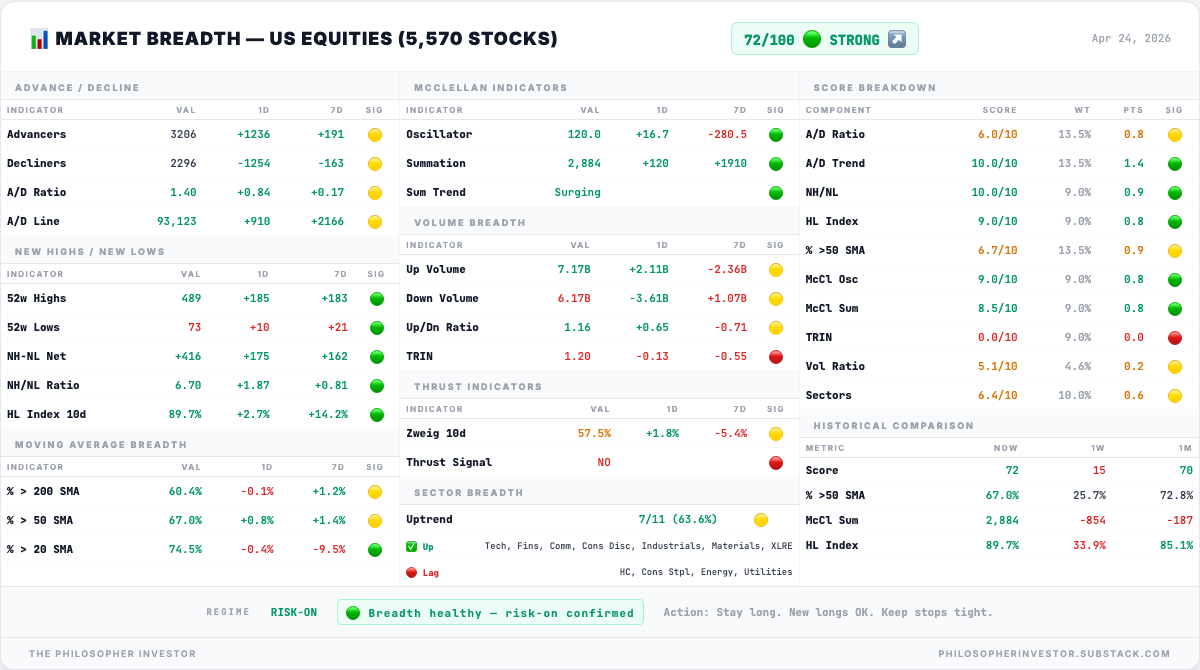
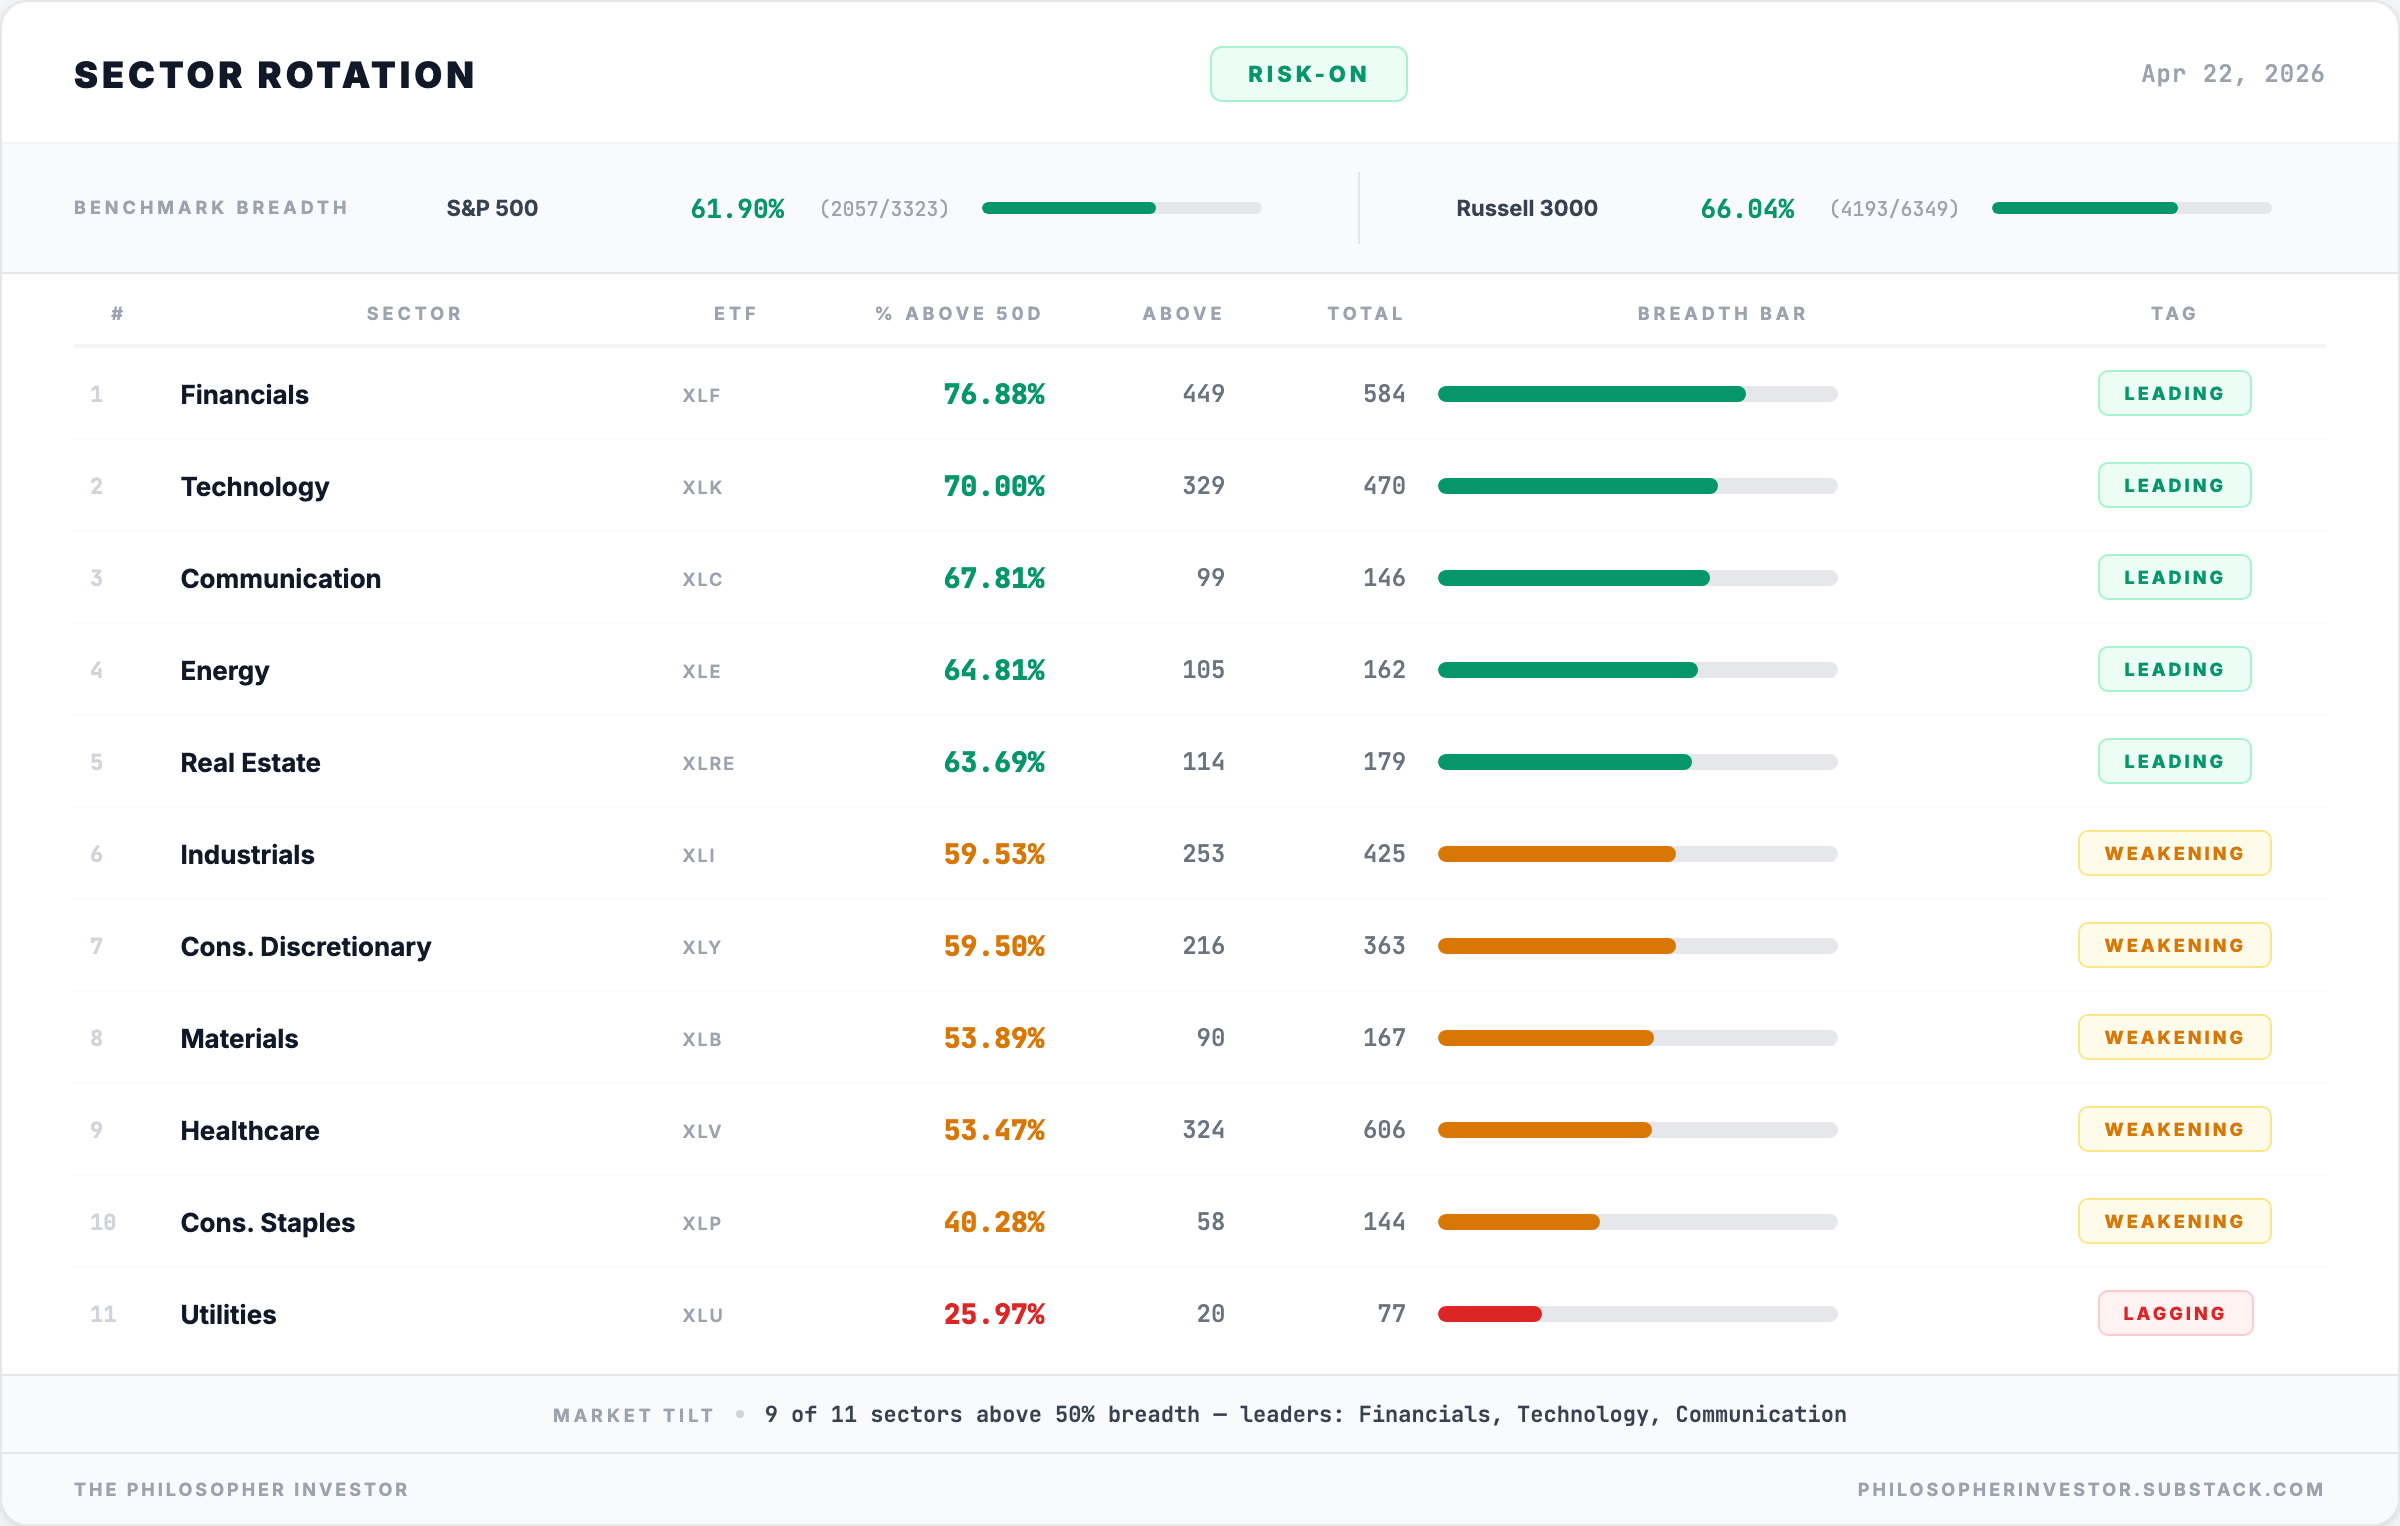
Internal participation held. Nine of eleven sectors closed above 50% breadth.
Catalyst week starts early next week. BoJ decision Tuesday morning, FOMC Wednesday afternoon, Amazon Wednesday after the close. Three important decisions inside 72 hours.
This setup is familiar. Stocks rally hard while bonds refuse to follow, usually one to two weeks before a Fed meeting. The bond market is waiting to hear what Powell says before pricing rates.

Market Health
📊 Breadth Score: 72/100
Market is healthy.
Three-quarters of stocks above their 20-day average, two-thirds above their 50-day. Momentum indicators surging. New highs beating new lows 6 to 1. Every indicator on the dashboard points the same direction.
The leaders are cyclicals: the sectors that win when the economy is strong, like Tech and Financials. The laggards are defensives: the safe-haven sectors investors hide in when they get nervous, like Healthcare and Utilities. Cyclicals leading while defensives lag is the textbook signal of confidence.
Energy is the one exception. It lags too, but moves on Hormuz news rather than on a flight to safety.
When defensives lag and participation stays this broad, money is hunting for returns, not hiding. That is what a confirmed risk-on regime looks like.
📉 Volatility
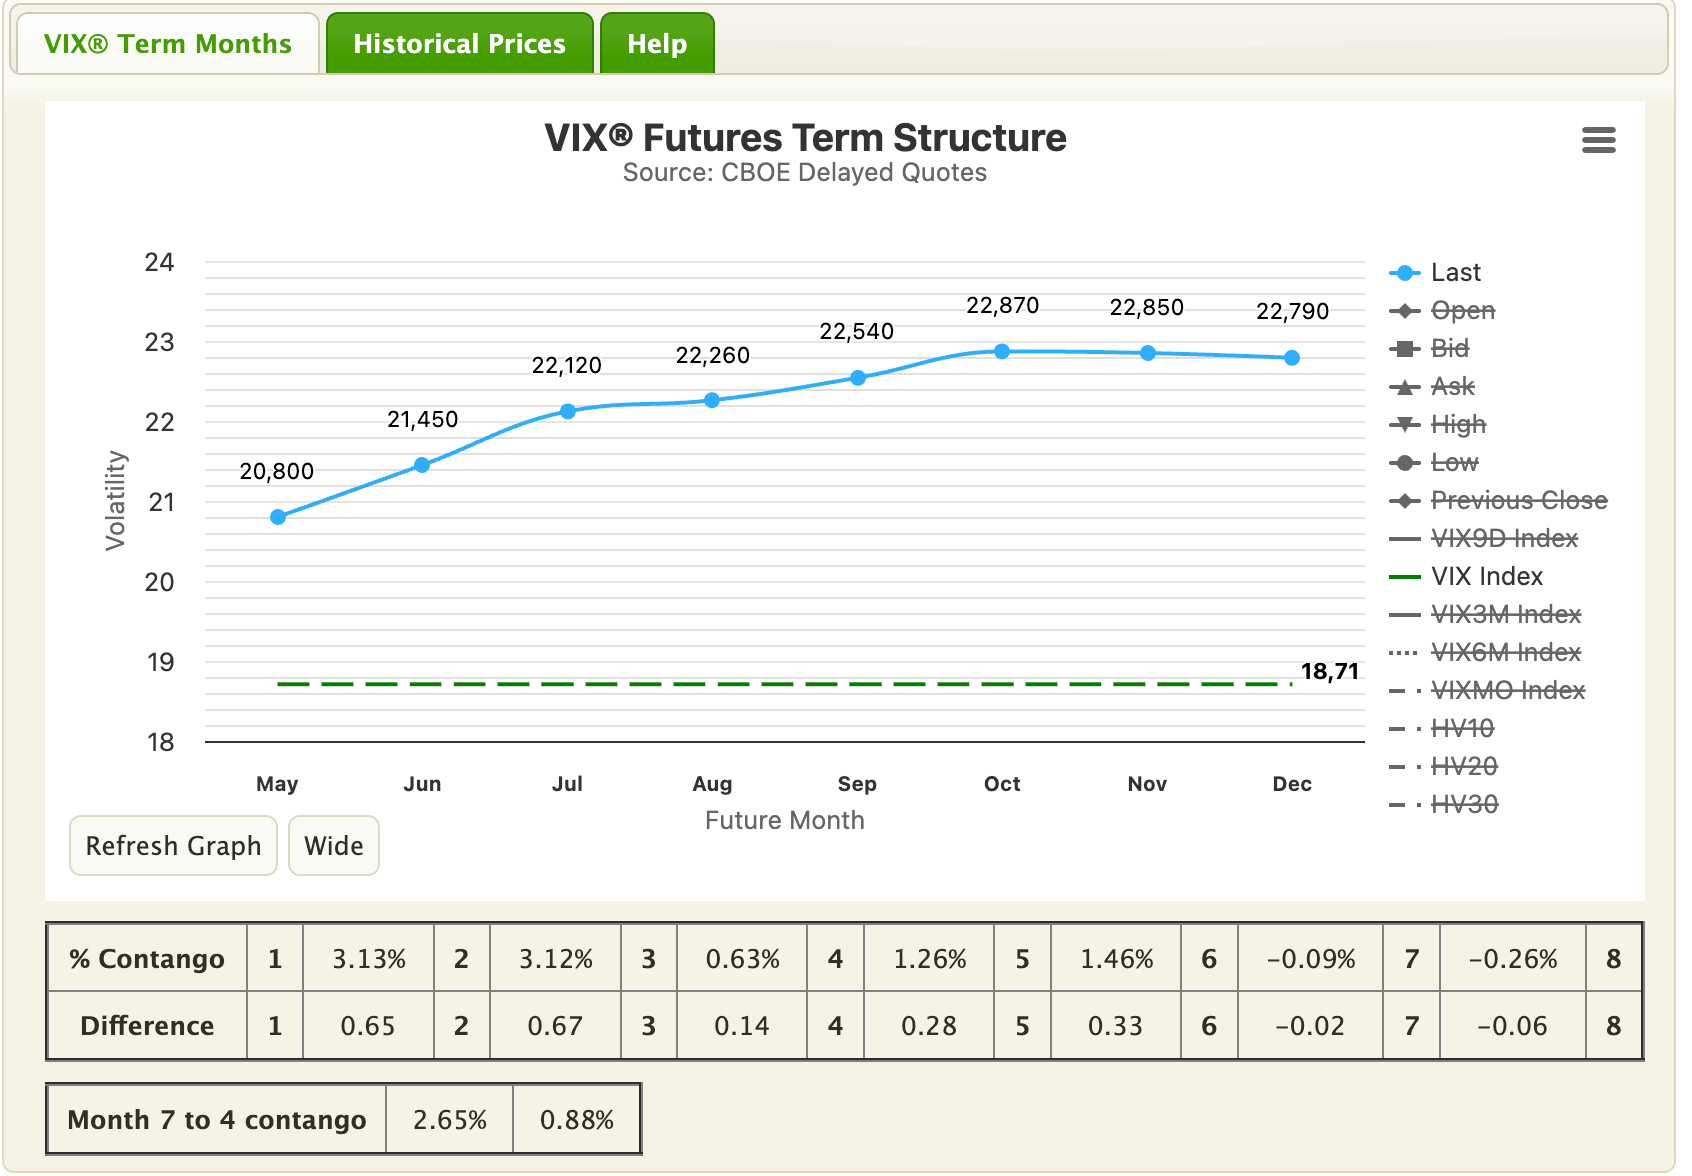
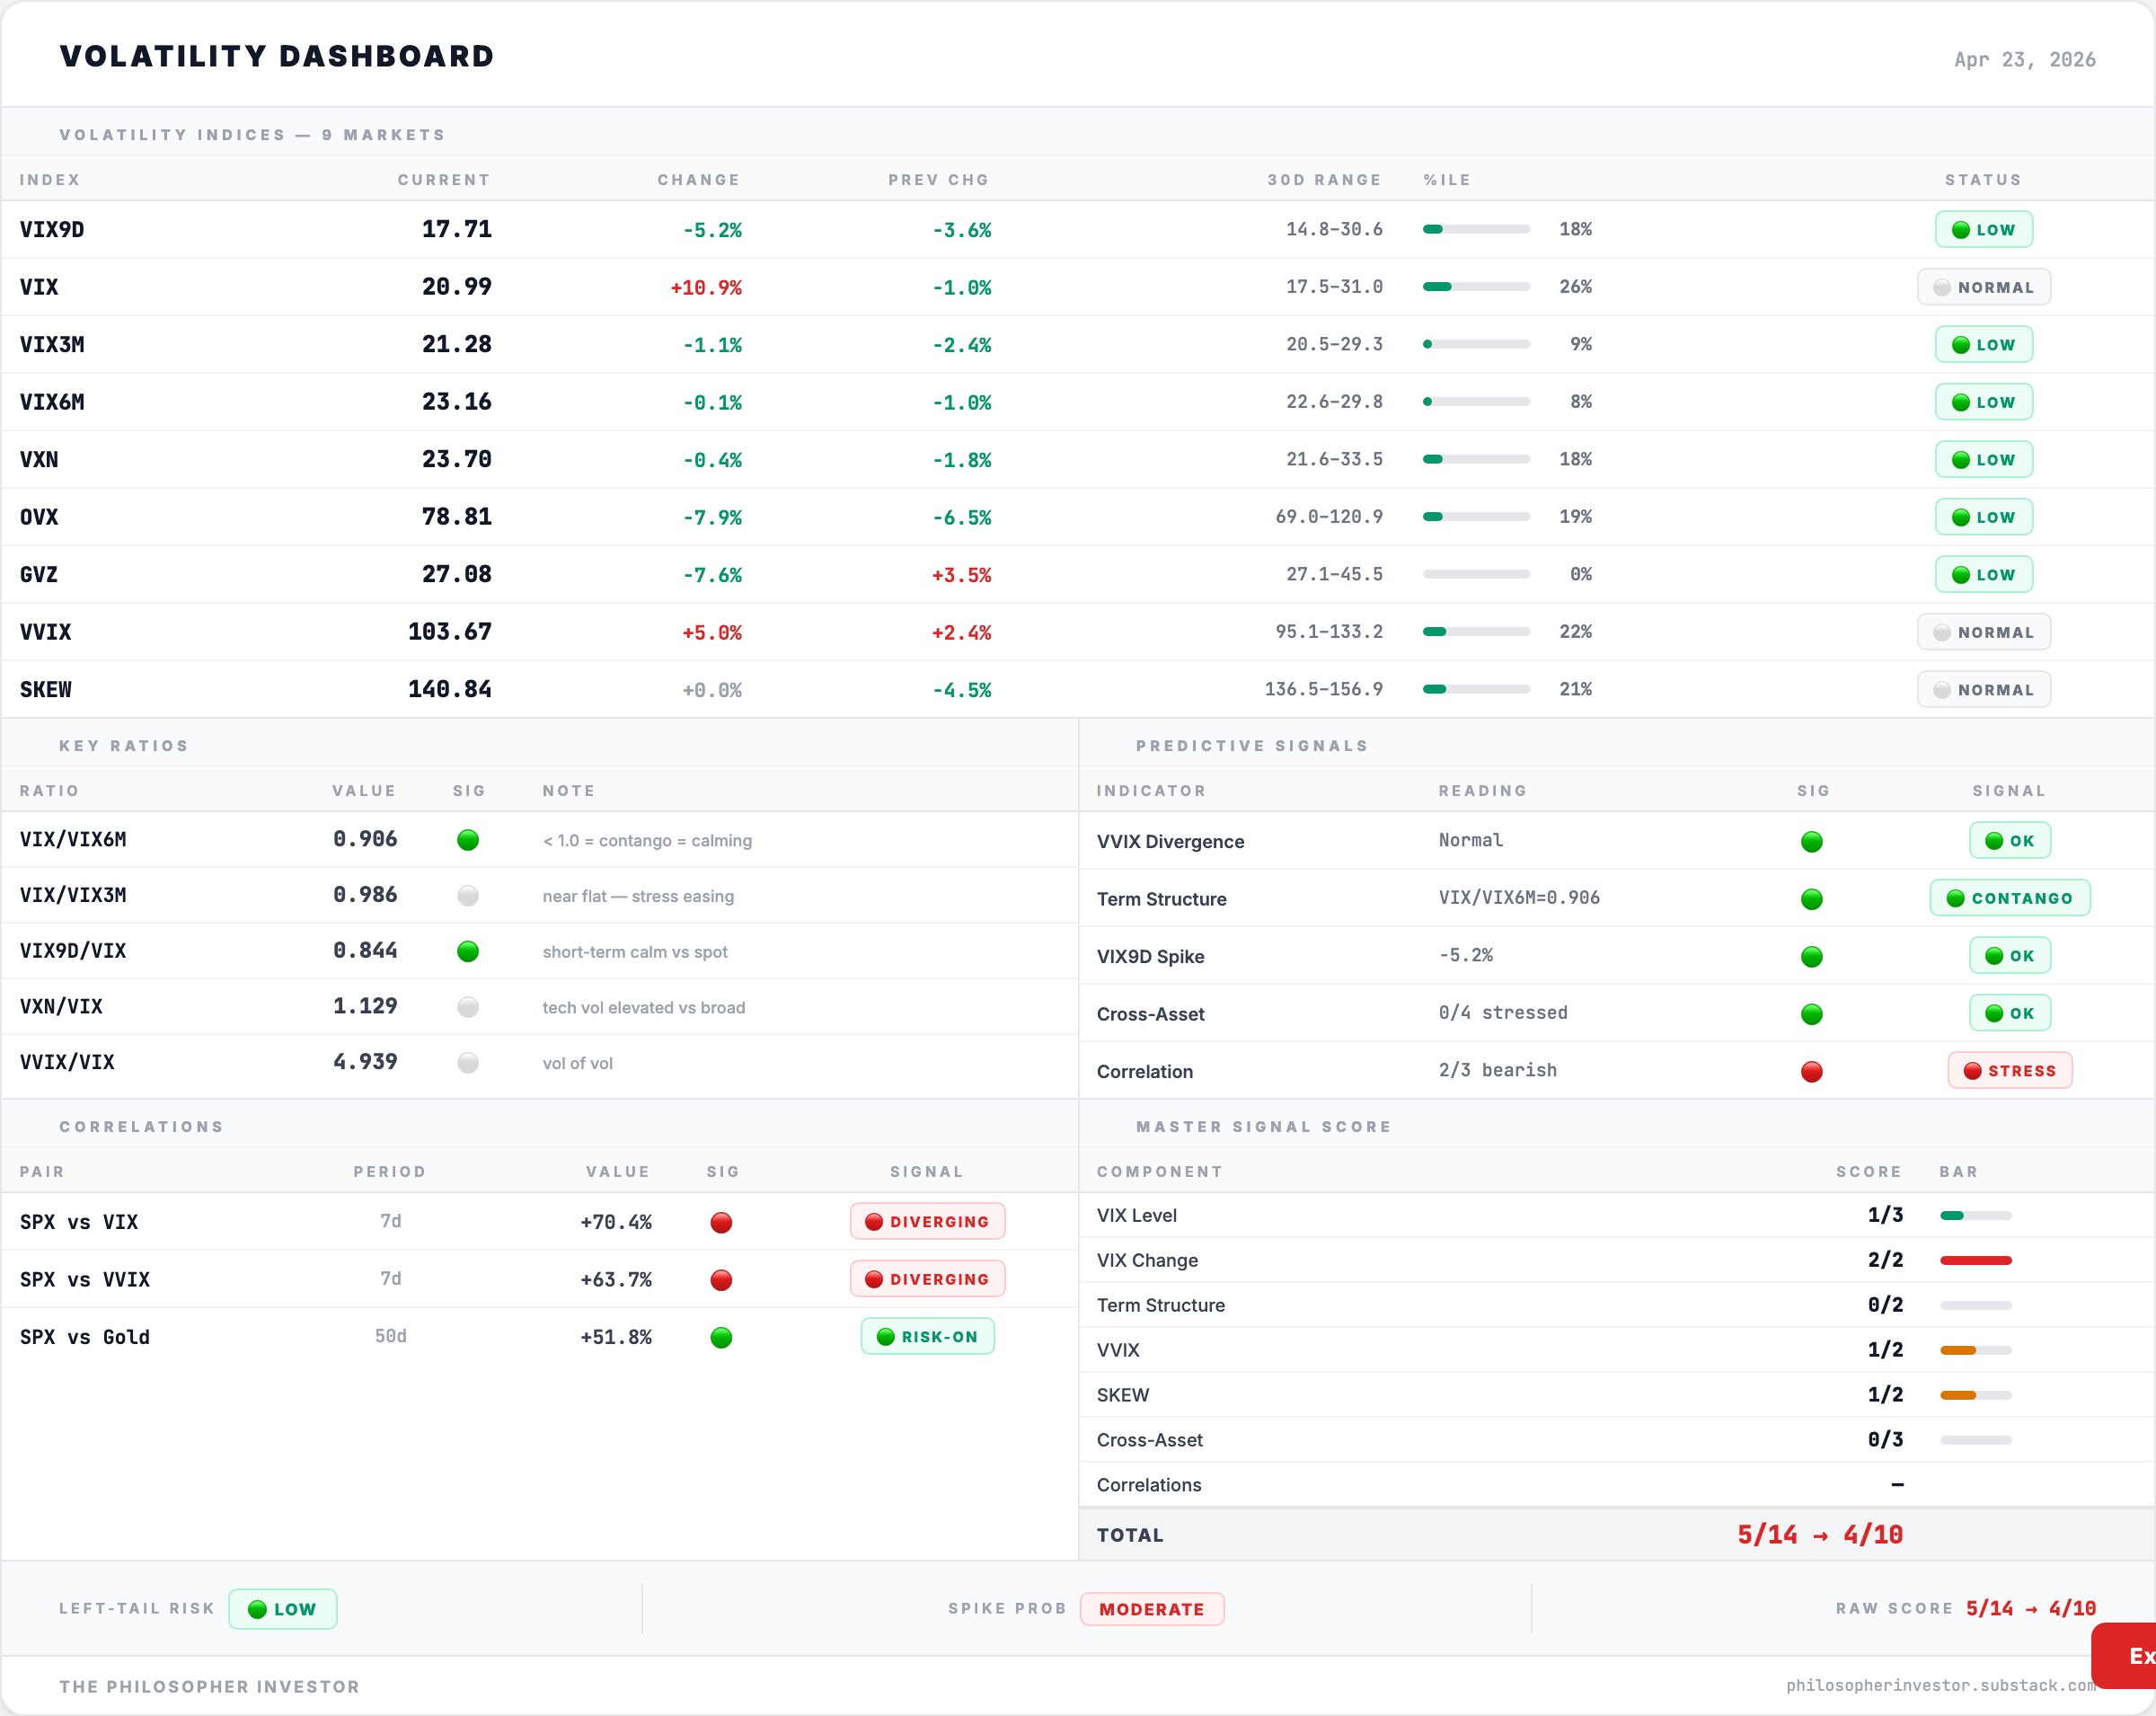
The fear gauge is calm. VIX closed Friday at 18.70, after spiking to 20.99 mid-week. The volatility curve is in CONTANGO (short-term volatility cheaper than long-term, which is the normal shape when markets are calm).
What was the spike? Traders bought insurance ahead of next week’s catalyst stack: BoJ Tuesday, Fed Wednesday, Amazon Wednesday after the close. They paid those premiums during the week, the spike landed Wednesday, and by Friday everyone was back to position. Calendar-driven hedging, the kind that fades after the events.
SKEW sits at 140, in line with recent averages. SKEW measures how expensive crash protection has become relative to standard market protection. The reading on its own is unremarkable.
The vol curve says "I want optionality through Wednesday, and I'll pay for it." Hedgers paid. The market is positioning for a busy week. The combo to watch is SKEW pushing higher alongside VVIX (the volatility of the VIX itself, the panic gauge's own panic gauge) in the same week. That flips the calm reading. Not yet.
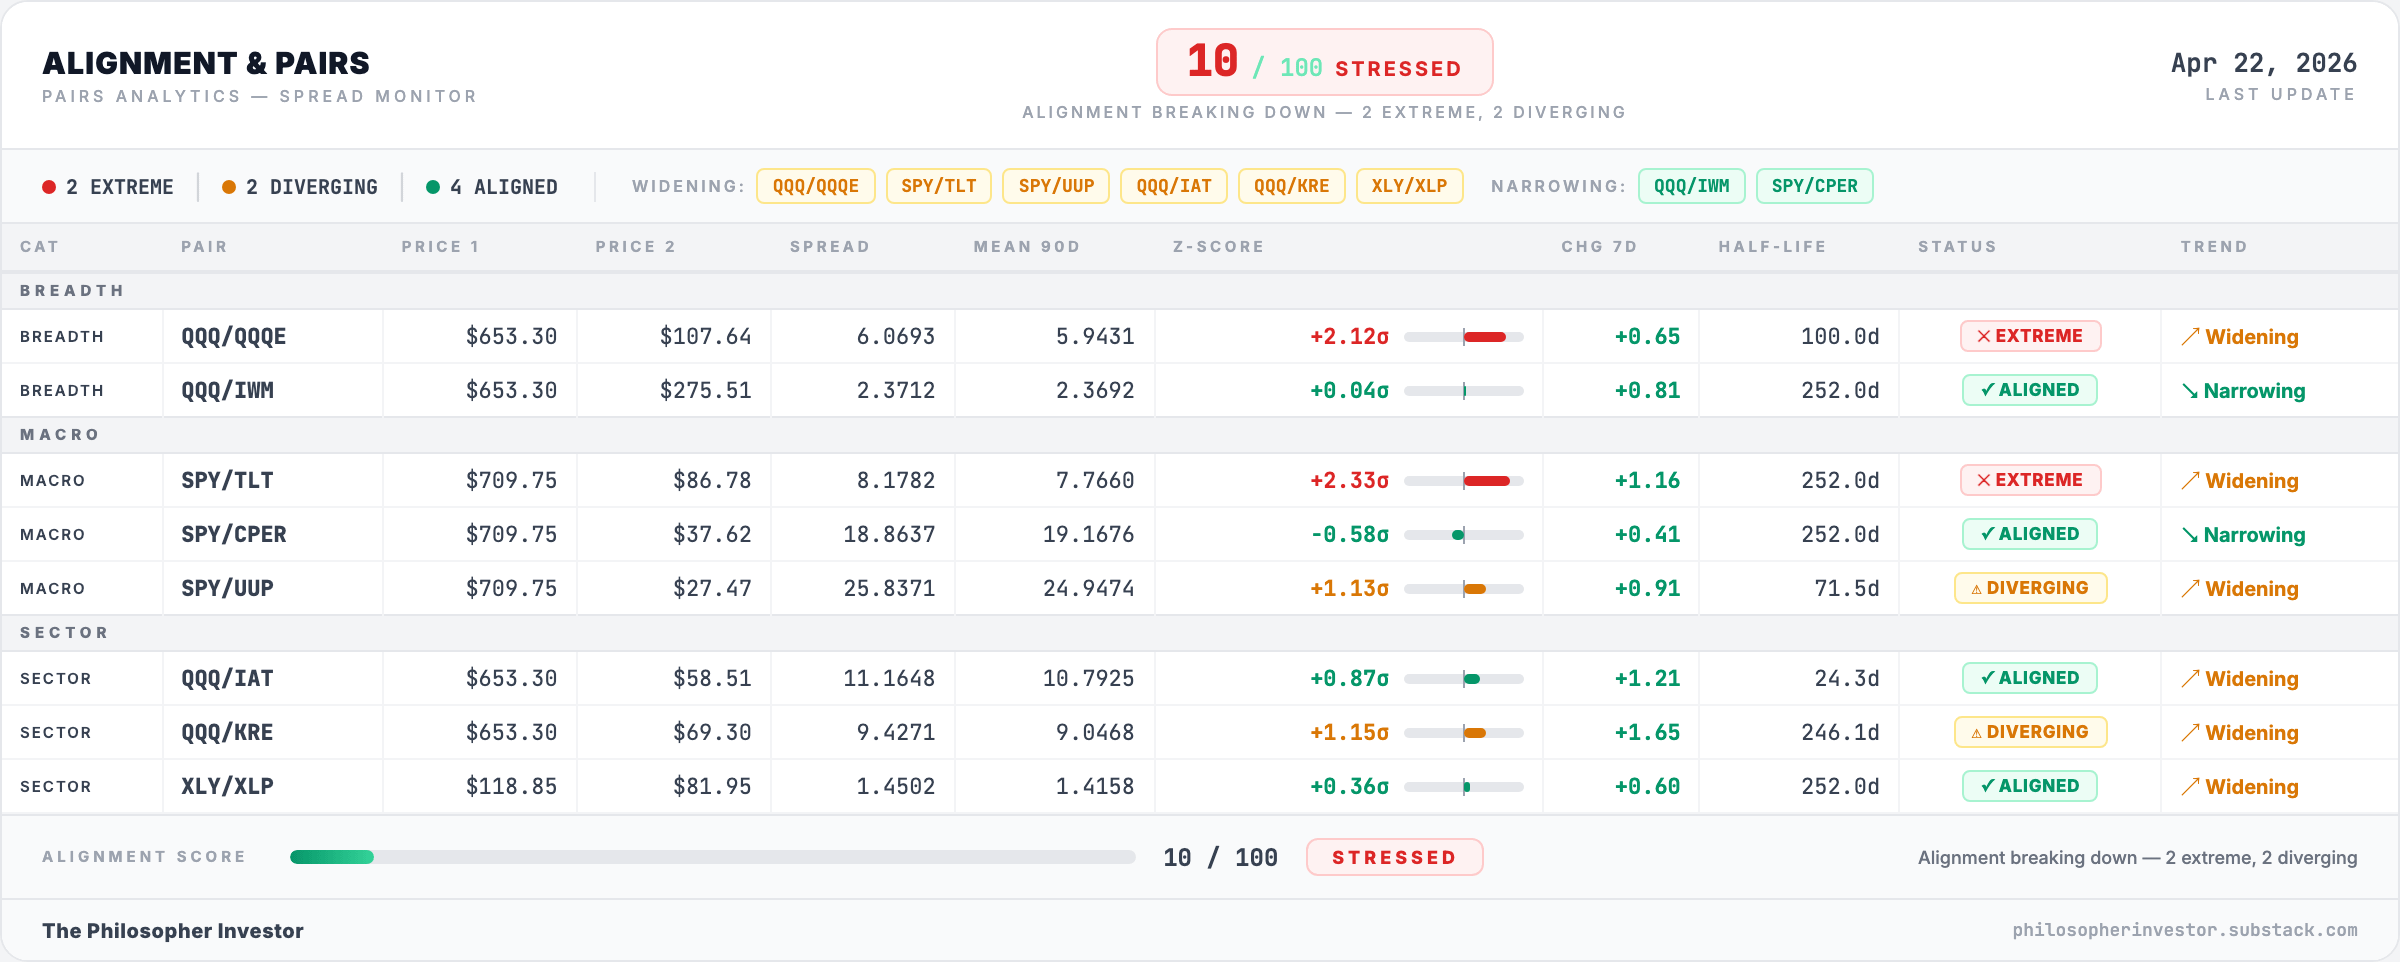
🔍 Alignment Score 10/100
Markets usually move in predictable relationships with each other. When several break at the same time, something is off.
When stocks rally, bonds usually fall (money rotates from safety into risk). When mega-cap tech rallies, the rest of the Nasdaq usually follows (they’re in the same index). The pairs score tracks how many of these usual relationships are still holding. This week’s score is 10 out of 100. Multiple relationships are breaking.
Two pairs broke hard this week:
Stocks vs long bonds: equities are ripping while bonds refuse to follow. The widest gap in months.
Mega-caps vs the rest of Nasdaq: the biggest tech names are pulling away from the average Nasdaq stock at the fastest pace in months.
Two more are diverging but less violently: stocks vs the dollar, and tech vs regional banks. Both widening.
The pair that matters most is stocks vs bonds. With the Fed meeting Wednesday and CPI still hot at 3.3%, the bond market has every reason to refuse the rally. Until that gap narrows, the rally has a credibility ceiling.
💱 FX
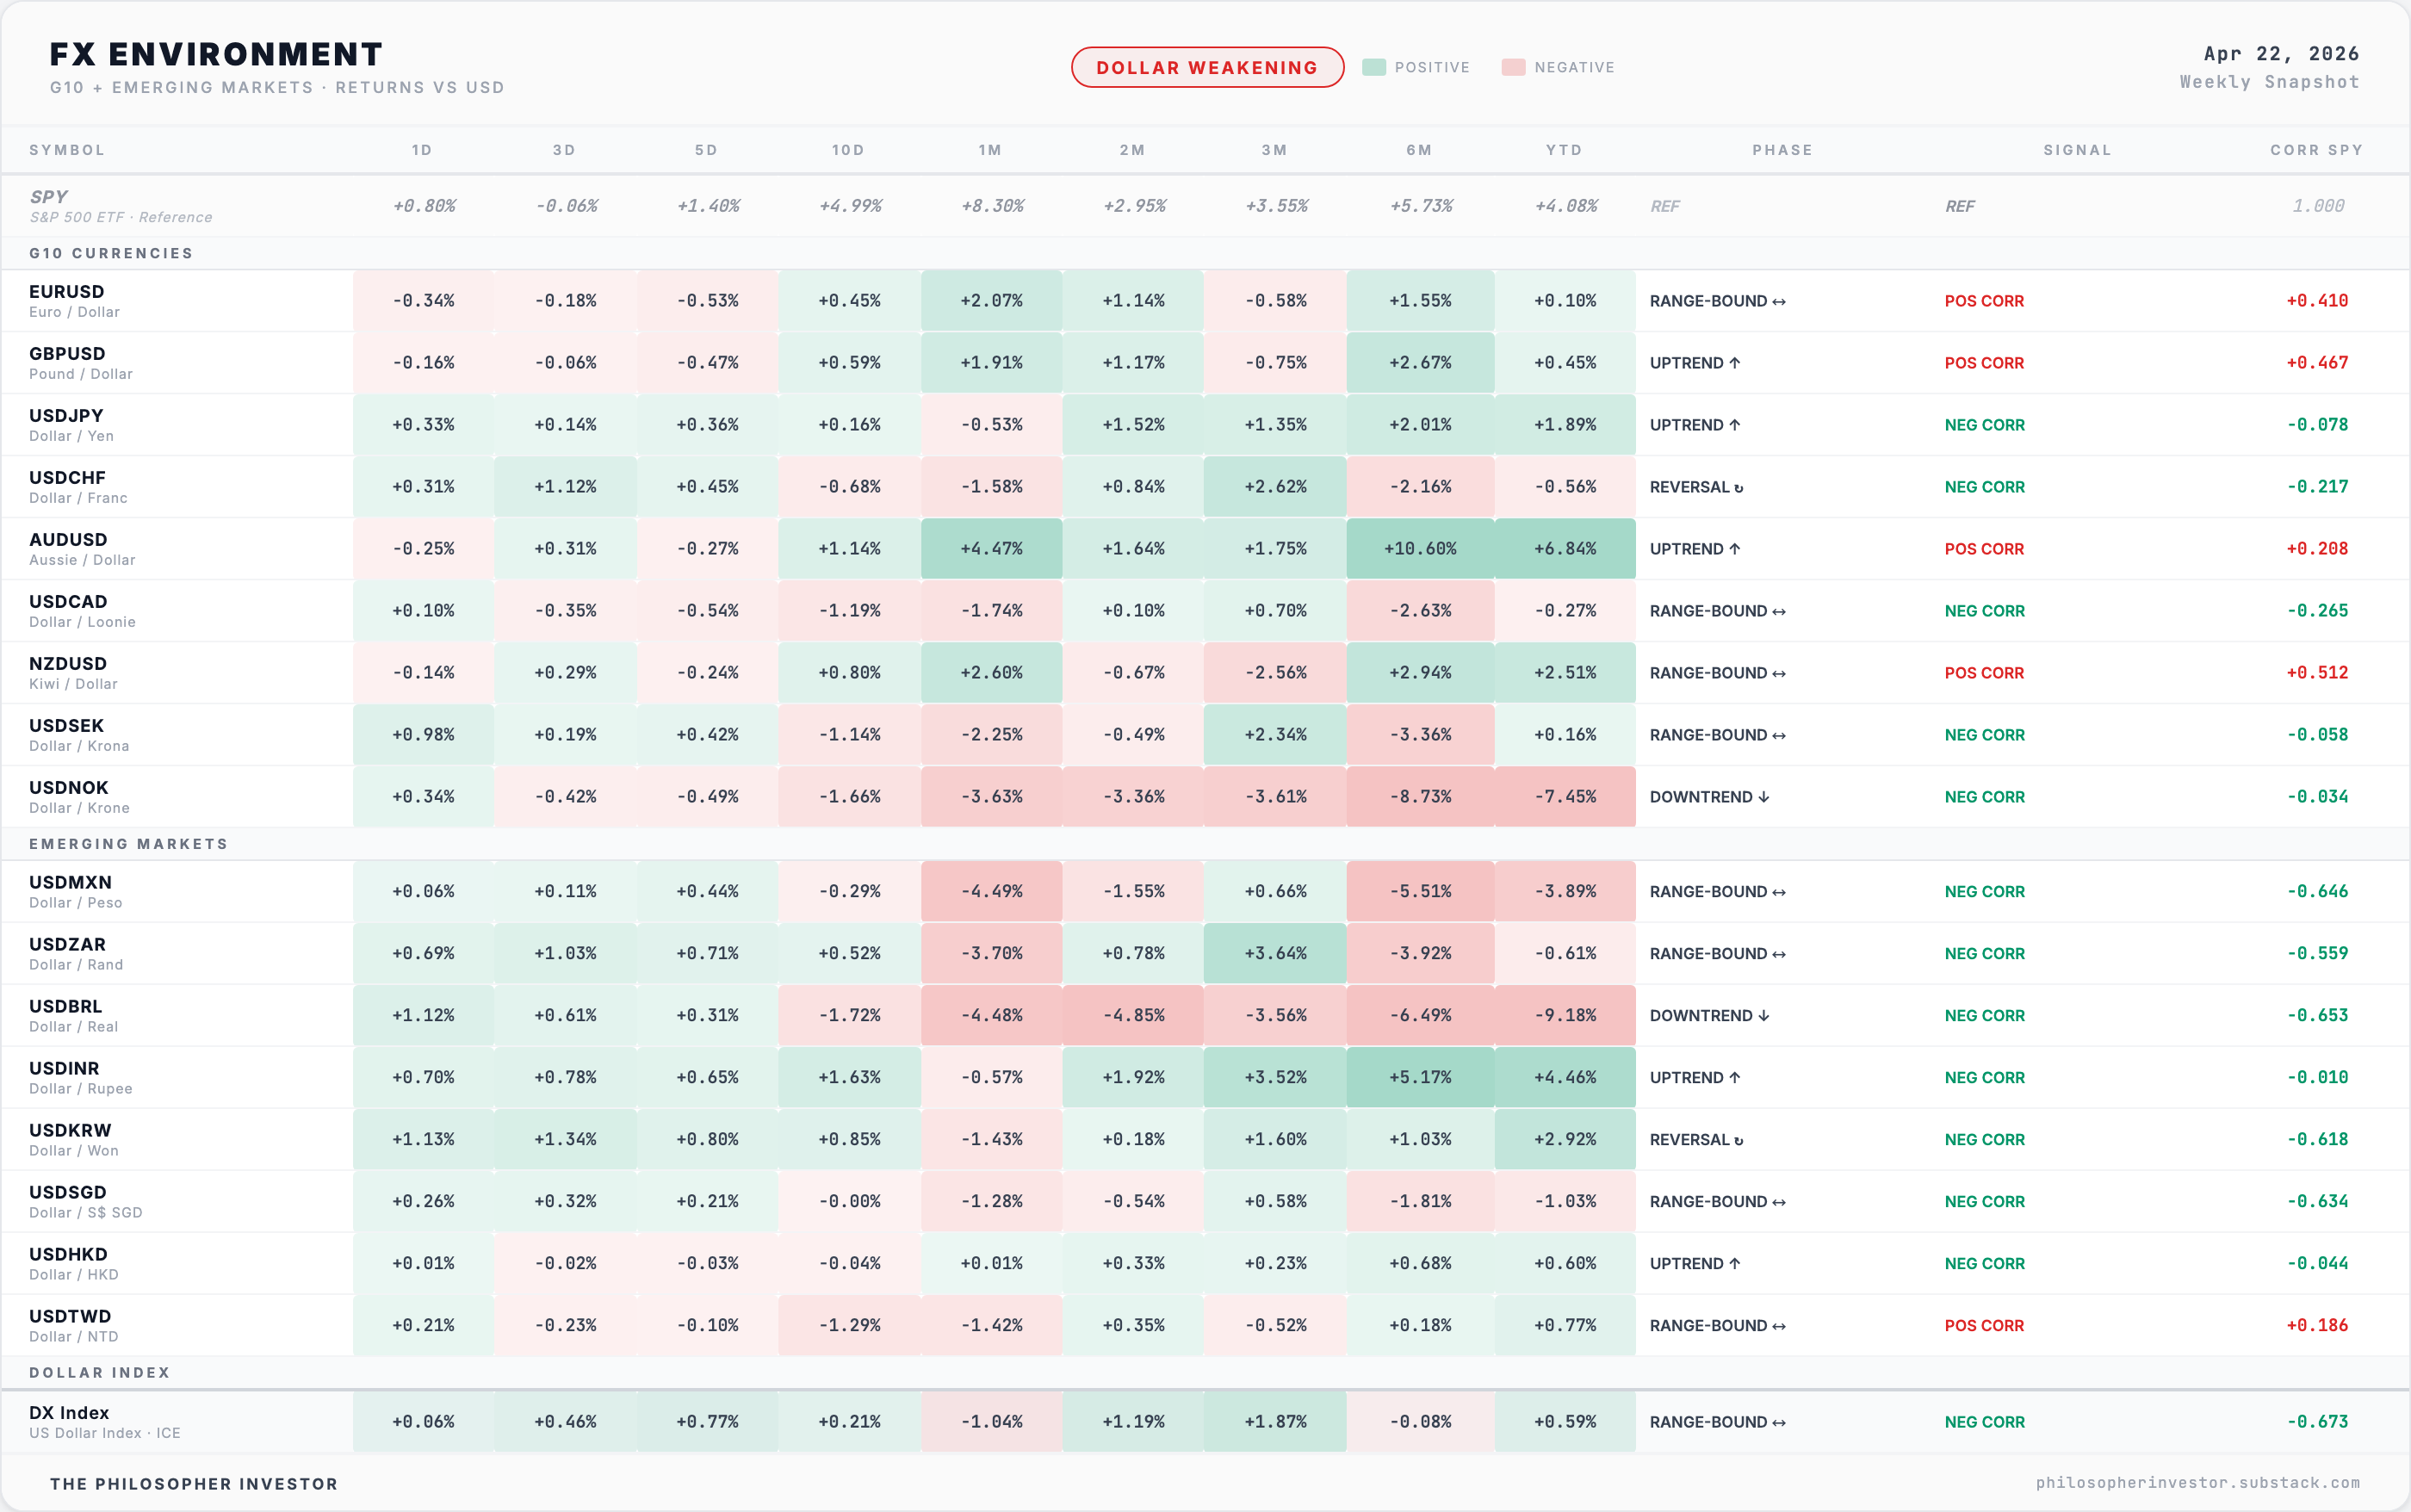
The yen is the most important chart in the world this week.
USD/JPY (the dollar against the yen) sits at 158. Why this matters: hedge funds around the world borrow yen at much lower rates than the US and use that money to buy higher-yielding assets like US stocks, tech, and emerging markets. The trade is called the “carry trade.” It’s estimated at trillions of dollars globally.
The carry trade works as long as the yen stays weak. The Bank of Japan meets Monday-Tuesday. Any signal of a rate hike strengthens the yen fast and forces the unwind.
We saw this scenario in August 2024: VIX went from 23 to 65 intraday after a hawkish BoJ surprise hit a market positioned for cuts. The carry unwind was the trigger.
🚨 Sector Rotation
Internal participation is broad and accelerating. The rally has most sectors participating, with momentum building.
The speed matters. Twenty sessions ago, only 10% of stocks per sector were in a strong uptrend.
Today it’s 36%. Financials went from near zero to two-thirds of its stocks trending strong in 20 days. Industrials and Tech right behind.
Cyclicals lead. Defensives lag. Money is choosing growth over safety.
Energy is the one collapsing sector. The biggest energy stocks are rallying on Hormuz news, lifting the index. Underneath, fewer and fewer Energy stocks are still in uptrends each week. The rally concentrates in a handful of mega-cap names while the rest of the sector rolls under. Single-catalyst trade. When Hormuz resolves, the sector goes with it.
Healthcare is the quiet upside. Most Healthcare stocks still trade below their 50-day average, but more and more are entering uptrends each week. The pattern is Energy’s reversed: weak on the surface, strengthening underneath. That combination usually means a bottom is forming. Watch for prices to catch up.
Discretionary (XLY) holds; Staples (XLP) is weak. Investors pile into Discretionary stocks (Tesla, Amazon, Nike) when they expect consumers to feel rich and upgrade their spending. They go to Staples (P&G, Coca-Cola, Walmart) when they expect a slowdown, because people keep buying toothpaste and groceries no matter what. Today's read: money is positioned for growth.
🔥 Trade of the Week: Lululemon (LULU)
Why LULU this week
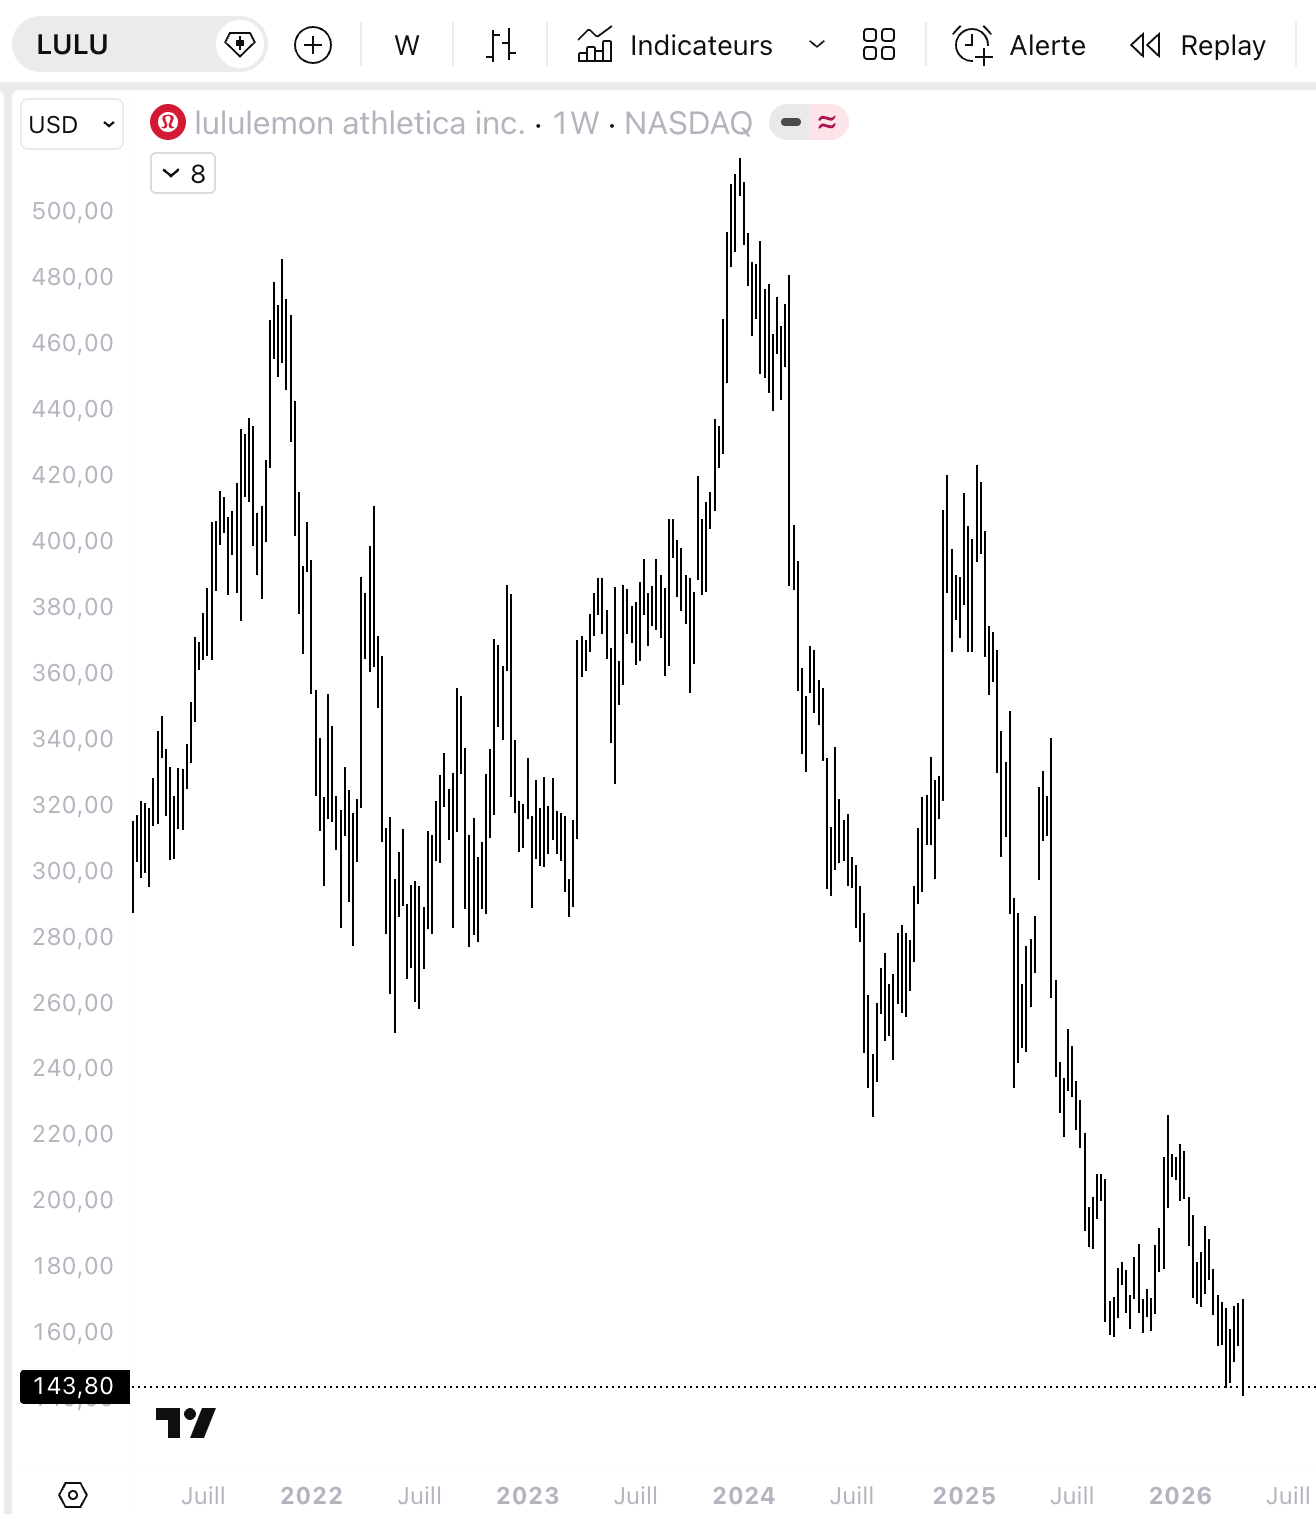
Consumer Discretionary holds in the rotation. LULU just made a fresh capitulation low at $143.80 on the new CEO announcement. That is the level worth watching.
Thesis
Lululemon traded from highs above $500 in early 2024 to $143.80 today, a drawdown of roughly -72% on a brand with positive operating margins, real pricing power, and a still-growing category.
The decline accelerated in March after fiscal Q4 2025 results showed Americas comparable store sales down 3% and management guiding 2026 North American revenue down 1-3%. Fresh pressure landed in late April with the new CEO announcement, pushing the stock to a new low this week.
The fundamental concerns are real and well-known. North American comps softened from double-digit growth to flat. Inventory work-down is still ongoing. The China expansion narrative got cut by the broader China consumer slowdown. A consumer cyclical reset on top of a still-functional growth story.
Three of my screeners fired on the name this week.
Positioning rationale
The setup is asymmetric heading into the consumer earnings cluster. LULU has already absorbed the bad news, and from $143, the next leg lower would require a fresh cycle of consumer deterioration the data has not produced yet.
If consumer earnings print down, retail names pull and LULU pulls with the cluster. The downside from here is structurally limited.
If consumer earnings print mixed, the cleanest oversold names bounce hardest as positioning normalizes. LULU sits in that bucket.
If Amazon beats expectations on both its cloud business (AWS) and its retail business, that signals the consumer is still spending. The whole retail cluster reprices higher. LULU is one of the more shorted names in the consumer discretionary cluster, so short sellers get forced out fastest. The squeeze case opens wide.
Levels
Entry zone: $143 to $148
Stop: below $140
Target 1: $165
Target 2: $185
Target 3: $215
Take the entry on stabilization above $143 with volume confirmation. If LULU breaks $140 on a guide-down or sector-wide miss, the thesis is wrong and the stop is clean.
🎯 Portfolio Performance
I share entry levels, stops, and targets. I don’t take every position I flag. Position sizes are yours to decide based on your own risk tolerance. This is a model portfolio updated weekly at Friday’s close. My personal positions may differ in timing and sizing.
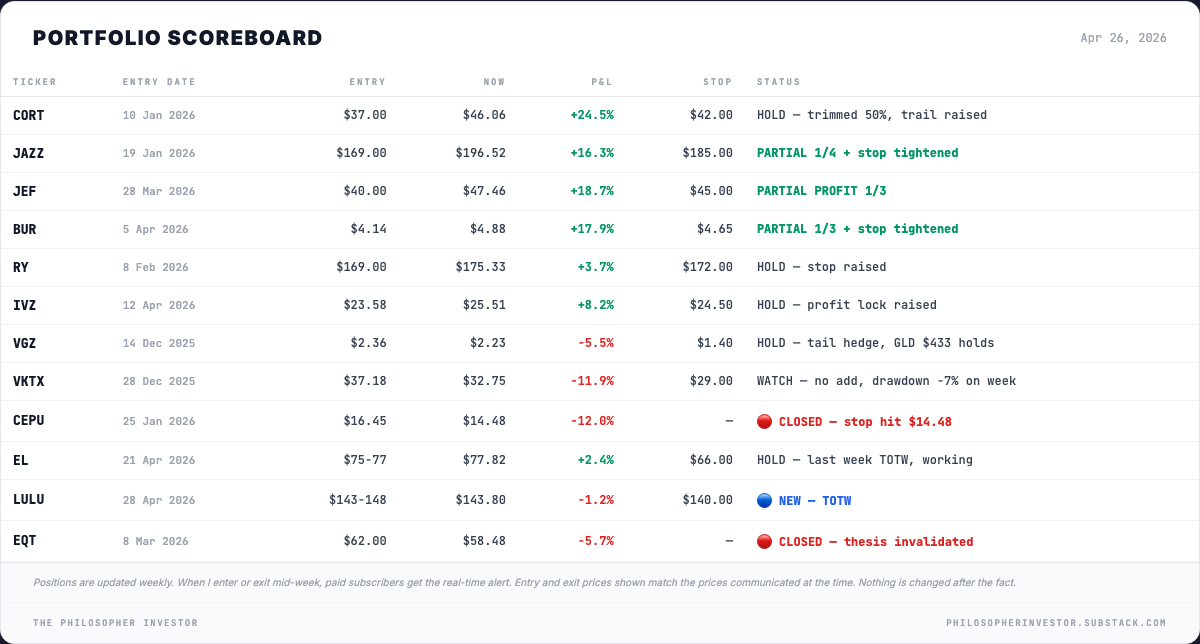
Defensive week: stops up, exposure down. Three stops raised on winners (JAZZ $185, BUR $4.65, IVZ upgraded from breakeven to a profit lock at $24.50). CEPU stopped at -12% when XLU broke its 50-day and killed the defensive thesis. VKTX pulled from the add list, drawdown widening on no specific catalyst. Rest of the book unchanged.
Closing
The breadth says rally. But either the bond market capitulates and validates the tape, or the equity tape repositions to match the macro warning the pairs are flashing.
I lean toward the second. The catalyst stack is asymmetric: BoJ Monday-Tuesday, FOMC Wednesday, Amazon after the close. Three independent triggers, each capable of cracking a market positioned for calm. Small caps amplify first.
LULU is a setup-driven exception. The downside from $143 is structurally limited regardless of what the catalysts deliver. The rest of the book stays on the trailing stops raised Friday, locking in gains if the macro warning plays out.
Daniel

Disclaimer
This newsletter is for educational and informational purposes only. It is not financial advice.
The content reflects personal opinions shared publicly as a journal. Trading stocks, options, futures, or any financial instrument involves significant risk. You can lose your entire investment. There is no guarantee of profit.
The author is not a registered investment advisor, broker, or financial professional with any regulatory authority including the SEC or CFTC. Always consult a licensed financial advisor before making any investment decisions.
By reading this newsletter, you accept full responsibility for your own trading and investment choices. Past performance does not guarantee future results. Markets are unpredictable.
Screenshots are courtesy of TradingView, VixCentral, and other platforms with which the author has no affiliation. Information shared may contain errors or become outdated quickly.
This content is the intellectual property of the author. Copying or redistributing without permission is prohibited.
By continuing to read, you acknowledge and accept these terms.
Read the desk every week
Market analysis in plain English, plus the app that scans the whole US market for you.
Become a member Read the original on Substack ↗