The Bond Market Just Caught Up to the Stock Market
Market Recap — May 17th 2026
2026-05-17 · 8 min read · Originally published on Substack ↗

Hello my friends,
Another instructive week, with Trump’s visit to China. Honestly, I expected much more from this meeting. With every major US decision-maker on the plane, every CEO of the biggest companies, Elon Musk, the whole dream team, I thought we would get something concrete. I even said in another Substack note that I was going to take calls to play it. Bad idea. A trade to forget.
The week ahead is going to be very important. Nvidia earnings on Wednesday, everyone is watching, because it will move the whole market. Iran tensions could pick up again, and the oil sector is climbing slowly.
I’m not changing my view. As I said in recent weeks, I think we are very close to a local top and a correction is coming soon. The signals are mixed. The SPX is almost at an all-time high, VIX is very low, most sectors above their 50-day moving average. But a pullback is more than possible. My position is almost 100% cash. When the pullback arrives, it will be a great opportunity to buy quality names on sale.
Let’s get prepared. Here’s the recap.
To get the most out of these market recaps and understand the framework behind my observations, I encourage you to read about my methodology here.
The Friday Session: What Actually Broke
There is more to last week than stocks. Bonds moved too. The 10-year yield gained +5% in a single session, the biggest daily move in two months. The 30-year, same story.
From there it is mechanical. When yields rise like that, every long-duration asset gets repriced (anything whose value comes from cash flows far in the future, like tech, gold, or growth names). So we had corrections across the board. Gold, semis, the whole risk side took it.
📊 Market Health
The first signal: small caps doubled the SPY move. IWM lost -2.41%, SPY lost -1.20%. In a healthy correction, small caps move in the same order of magnitude as the SPY. When they break down twice as hard, big players are reducing risk exposure starting from the most fragile end of the curve. Regional banks confirmed the reading. KRE lost -4.12% on the week.
The more disturbing observation is what did not happen on Friday. Defensive sectors did not play their safe-haven role. Staples, utilities, no bid. They all closed red. XLP and XLU are the rate-sensitive defensives that usually catch flows in a growth scare. They did not. This is the signature of a rate-driven move.
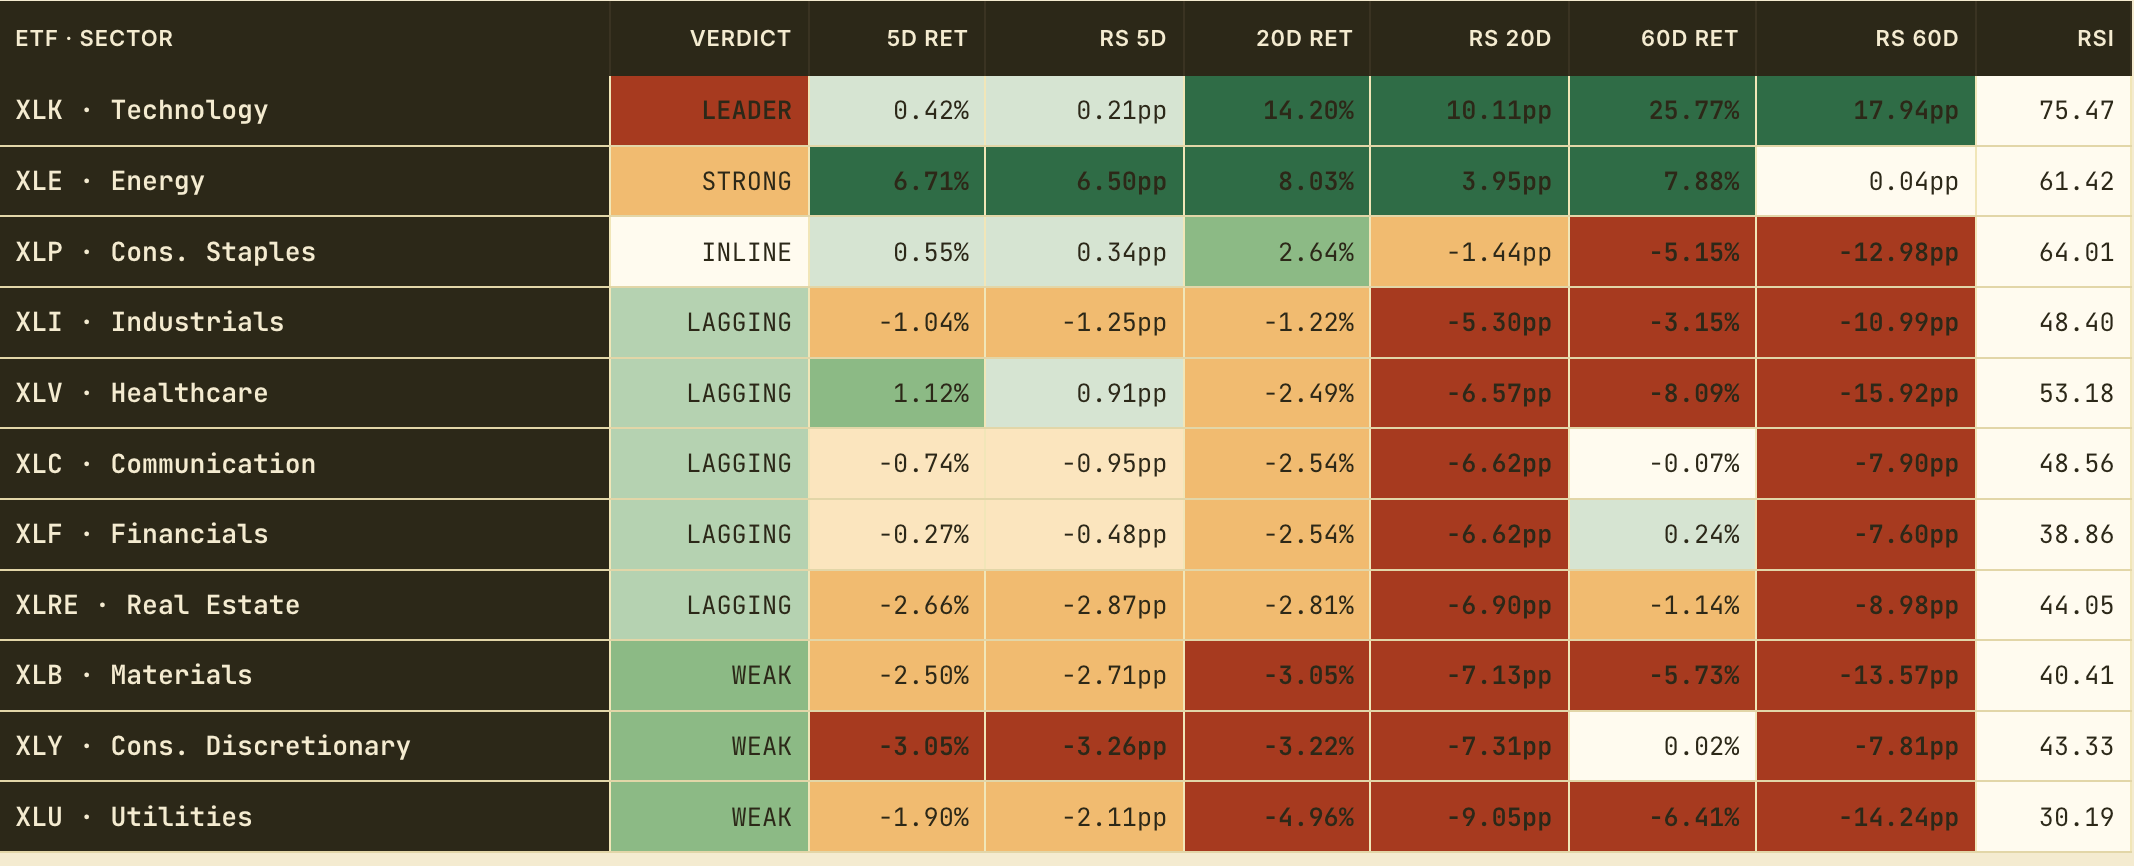
Meanwhile XLK held up at +0.42%. Pure mechanics. The mega-cap concentration in tech absorbed the move. Tech is not flashing any serious correction warning yet.
📉 Volatility
The VIX moved without exploding.
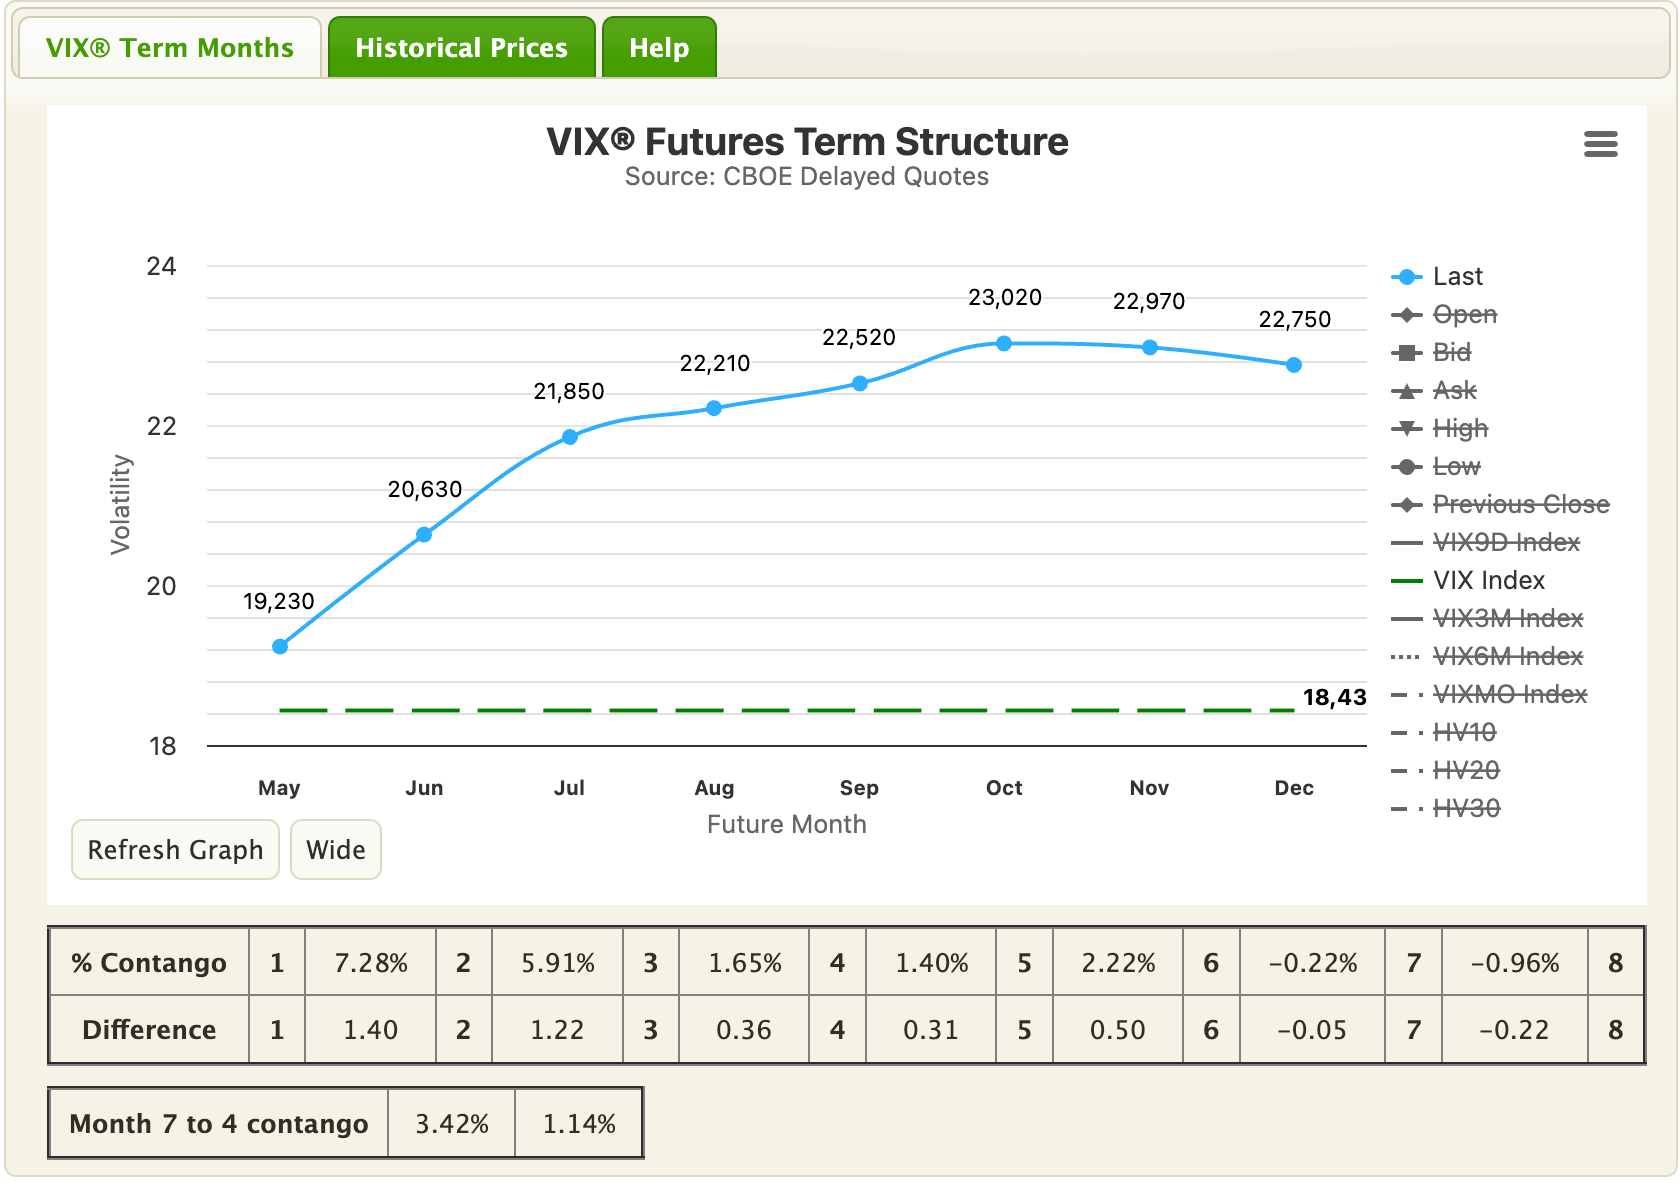
The absolute level is nothing spectacular. 18 is not high. But on Friday it jumped +6.8% in one session with no identified catalyst. That is a very big daily move. And it happened on the same day as the biggest bond sell-off in two months. The volatility market is starting to price what the rates market has already said.
The vol curve stays in contango, meaning short-term vol is cheaper than long-term vol, which is the norm. VIX3M closed at 21.36 against 18.43 for the VIX, a ratio of 1.159. Three-month implied vol is roughly 16% above spot vol. In a calm market this is normal. Near tops, this ratio compresses toward 1.00, because front-month vol gets bought faster than long-dated vol. We are not in compression yet. The front is starting to catch up to the back. For now, the hedging market is pricing a normal pullback. Not a crash. For now.
Now SKEW. This index measures the cost of puts that are very far out of the money compared to standard puts. It is the institutional crash hedge. SKEW closed above 145, up +4.6% on the session. When institutional demand for crash protection jumps hard while the session is going down, it tells you institutions were not properly hedged and rushed to catch up.
The combination to watch this week: does SKEW keep climbing, and does VVIX close higher too. VVIX measures the volatility of the VIX itself, the fear inside the fear gauge. Neither has flipped yet. Watch them very closely.
🚨 Sector Rotation
Energy made a strong comeback. XLE closed +6.71%. Everything else last week went down. Bonds, gold, tech, small caps. The whole map.
Energy outperforming during a stress phase on credit and equities is the sign of a regime change. The historical parallels matter here. Each time energy exploded while everything else stalled, the broader market followed lower within six months.
Part of this is mechanical. Geopolitical uncertainty with Iran. OPEC dynamics. You can pick whichever narrative you want. The flows stay the same. Smart money is repositioning on an inflation reset, and oil is pulling up. This lines up perfectly with what we saw on bonds.
Zoom out and the read is simple. This market is being driven by rates. Same conclusion from a different angle: defensive sectors did not play their role last week. No bid showed up.
For now there is no significant downside move on the index, because the catalyst is missing. To be honest, I see one coming. The Nvidia earnings on Wednesday. That could be the catalyst that finally tips the market lower.
📅 Key Catalysts for the Week Ahead

Wednesday May 20: Nvidia earnings after the close. Nvidia weighs around 8% of the SPX. Its numbers move more than the stock. The index moves with them, mechanically, through ETF flows and risk-parity rebalancing (the systematic strategies that adjust allocations based on volatility). Last quarter Nvidia beat estimates by +5%, but the stock fell -5.5% the next day and dragged the broader tape with it. The bar keeps rising, and even a beat is no longer enough to lift the index. A miss that dip buyers manage to absorb extends the cycle. A beat that still fails to lift the broader market is the regime signal of the year.
Wednesday May 20: Intuit earnings. Same day, secondary signal on enterprise software and AI productivity. The market reaction here will give a secondary read on whether investors still reward the AI productivity narrative in software, but the main AI capex test comes from Nvidia that same day.
💱 FX
The yen keeps weakening against the dollar, which keeps the carry trade alive. Quick reminder: this means borrowing yen at near-zero rates and buying higher-yielding US assets, like tech. The flow is significant, and it explains a large part of the mega-cap outperformance.
As long as the Bank of Japan stays silent, this carry trade will keep feeding US mega caps and pressuring the yen lower. As I have been saying in recent weeks, the day the BoJ announces a tightening, the same names that benefited from the rise will be the first to take the hit. The unwind risk sits on the same shoulders as the rally. That is the setup to keep in mind. The day it happens, it could be violent, and a significant correction will hit the very names that benefited the most from the carry, the US tech mega caps.
On the dollar side, DXY took +1.57% this week, which is logical. Global liquidity moves into cash during stress phases, and the move accelerates when rates rise sharply.
🔥 Trade of the Week:
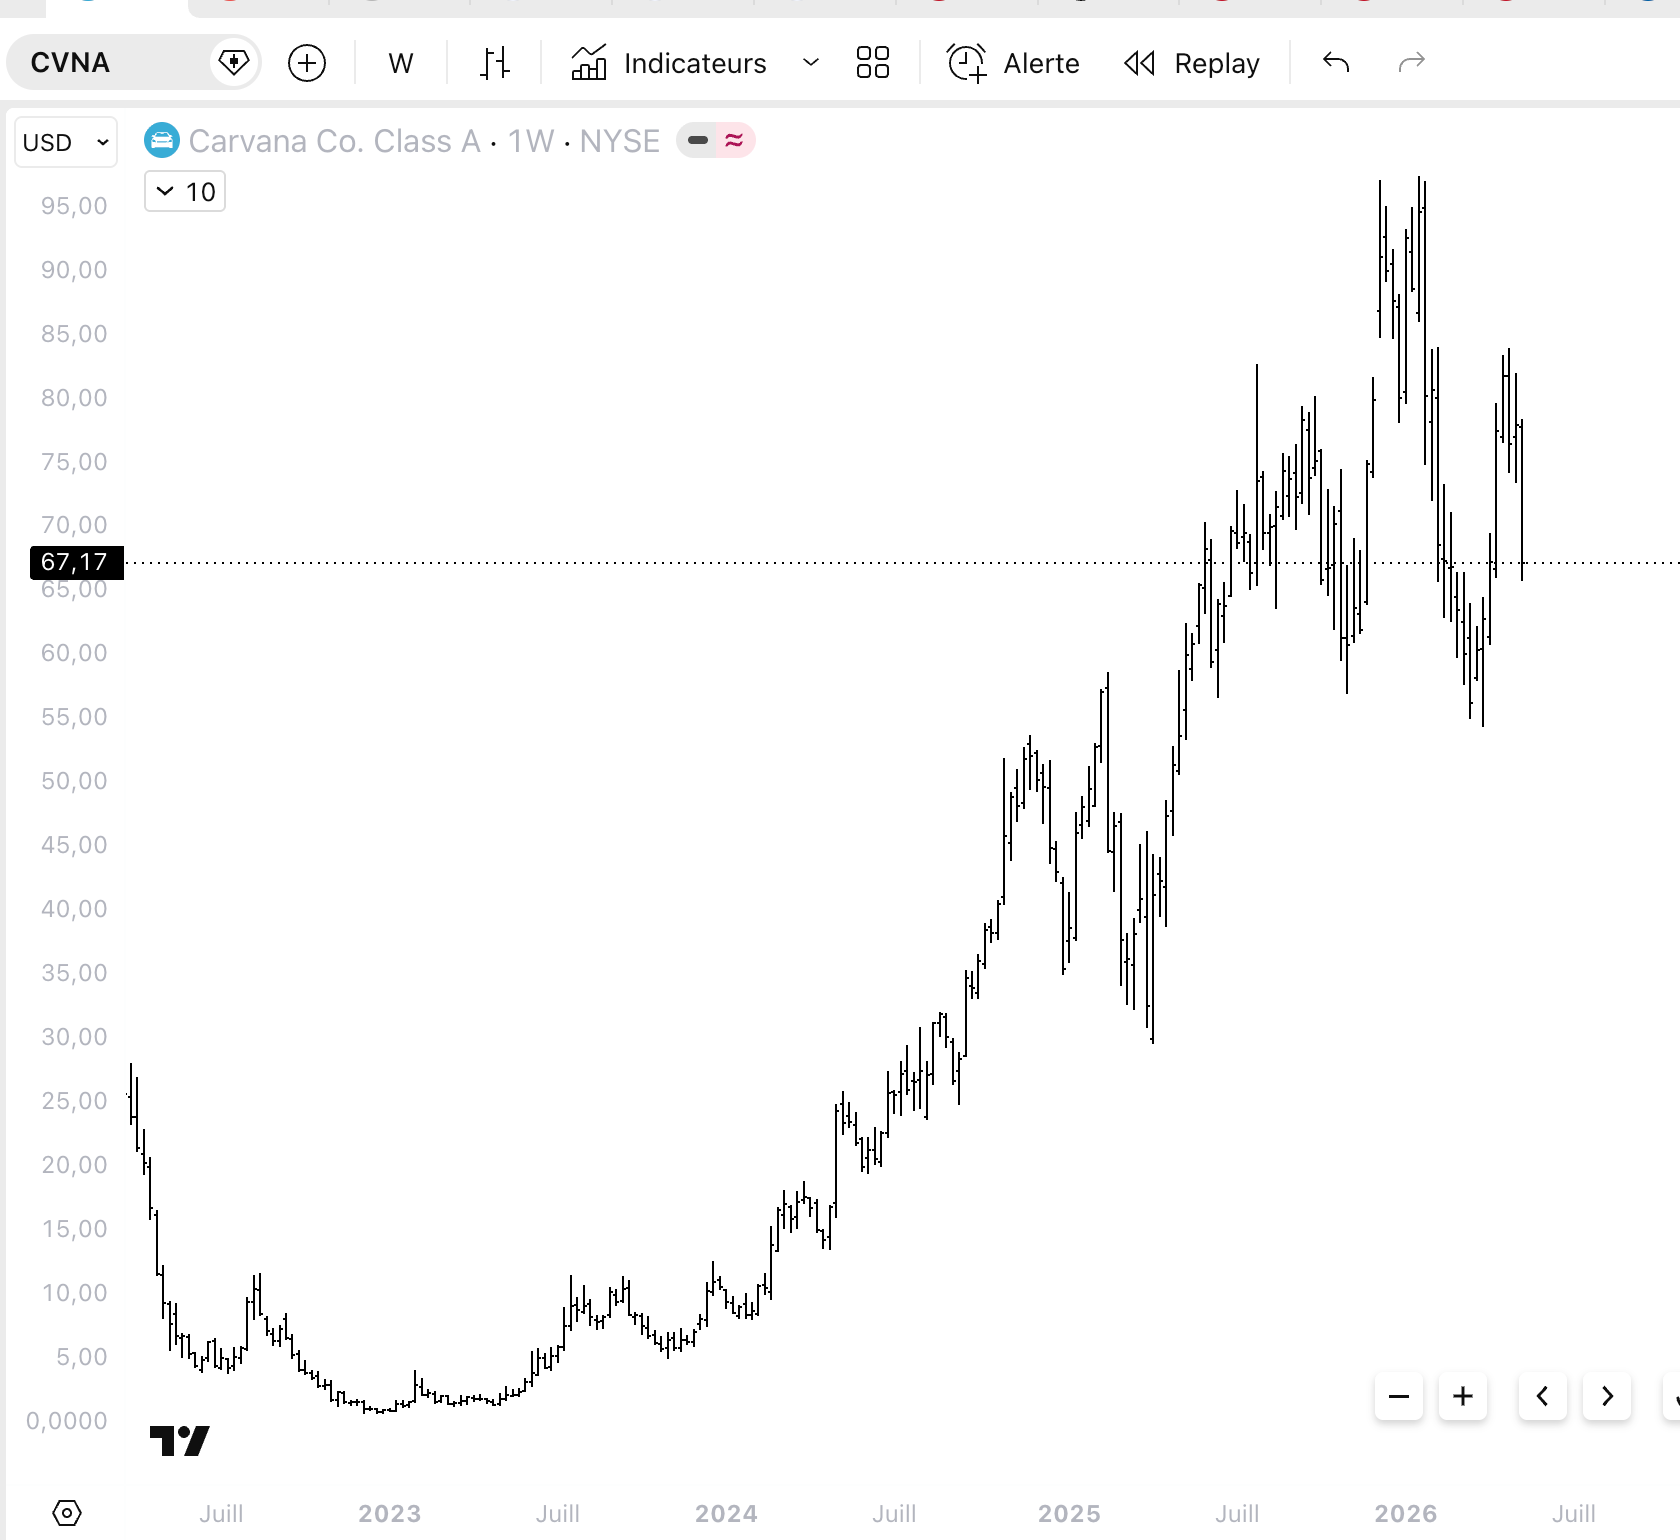
I’ll repeat myself. I still think a correction is coming on the broader market. My cash position is the highest it has ever been. That said, my screeners flagged a confluence on one name, and the setup is strong enough to warrant a trade. CVNA. The bottom signal here is significant, and even in a broader market correction the impact should be limited.
Quick context. CVNA completed a 5-for-1 forward split after shareholder approval on May 5, with the stock beginning to trade on a split-adjusted basis around May 7/8.
Friday brought 11.3M shares traded against a 7-9M average. The session printed a defined lower wick at $65.84 and a close that held back above $67 after the session low. My bottom indicators flashed on this trade.
The thesis sits in three layers.
First layer: the business has structurally turned a corner. Margin recovery on auto retail, debt restructured, free cash flow positive. The fundamental concerns that drove the 2022 to 2023 drawdown are no longer the dominant story.
Second layer: the post-split tape attracted retail momentum chasers who got flushed hard over the last seven sessions. That leaves the float in stronger hands. Institutions are absorbing the supply right at the edge of the rebound.
Third layer: in a market where positioning is long every mega cap, the names that have already corrected often diverge on down days. They bounce while the index bleeds, because their sellers are exhausted.
The trade reads two ways. If Nvidia beats and the broader market rips, CVNA can ride the move with short covering, target $75 to $78. If Nvidia misses, what is sure is that CVNA falls less than the rest. Sometimes it even rises, because the exhaustion is already done and there are simply fewer potential sellers left.
Levels.
Entry zone: $66.50 to $68.00
Stop: $63.50
Target 1: $73.50
Target 2: $77.50
Sizing: start at 1.5% of book, add +1.0% on confirmation above $70, max position 2.5%
🎯 Portfolio Performance
I took FXI calls to bet on the US president’s China visit. It was a failure. None of my screeners signaled in that direction, and I should have listened to my own framework. A trade to forget.
I also sold $BUR. Entry around $4.14, exit at $4.80, profit of +16%. Maybe the trade keeps running higher, but I prefer cash given the correction I expect in the coming weeks.
Note: This newsletter is shorter than usual. I am preparing some very interesting screeners and new things to share in the coming weeks, so please stay tuned.
See you next week,
Daniel
Disclaimer
This newsletter is for educational and informational purposes only. It is not financial advice.
The content reflects personal opinions shared publicly as a journal. Trading stocks, options, futures, or any financial instrument involves significant risk. You can lose your entire investment. There is no guarantee of profit.
The author is not a registered investment advisor, broker, or financial professional with any regulatory authority including the SEC or CFTC. Always consult a licensed financial advisor before making any investment decisions.
By reading this newsletter, you accept full responsibility for your own trading and investment choices. Past performance does not guarantee future results. Markets are unpredictable.
Screenshots are courtesy of TradingView, VixCentral, and other platforms with which the author has no affiliation. Information shared may contain errors or become outdated quickly.
This content is the intellectual property of the author. Copying or redistributing without permission is prohibited.
By continuing to read, you acknowledge and accept these terms.
Read the desk every week
Market analysis in plain English, plus the app that scans the whole US market for you.
Become a member Read the original on Substack ↗