The Market Hit New Highs. Most Stocks Didn't Move.
Market Recap — May 24th 2026
2026-05-24 · 15 min read · Originally published on Substack ↗

Hello my friends,
Still the most defensive I have been all year, and the tape this week did nothing to change my mind. The S&P pressed to new highs while the median stock sat dead, the rally is a handful of mega-cap names and a flat field behind them. USDJPY closed at 159, one candle from the 160 line where carry-unwind risk becomes live. Brent is back above $100 with the Strait of Hormuz still effectively closed and the White House signaling possible new strikes on Iran over the holiday weekend, though rumors of a US-Iran deal involving uranium stockpile surrender and Hormuz reopening are also circulating, which would flip the oil and risk picture entirely.. I think the top is near. I also think the data deserves to be read without my bias, so I will give you both.
I have been cautious for weeks. My cash position is the heaviest it has been all year. I believe, and I have said this in three of the last four letters, that we are close to a local top, that the easy money in this rally has been made, and that the smart move is to hold powder and wait for the pullback that lets me buy quality on sale. This week I am going to tell you what I believe, and then read the tape as honestly as I can, including the parts that argue against me, and let you weigh the two yourself.
The honest summary up front: the data this week did not confirm the top. It also did not refute my caution. It sharpened the exact fault line on which this whole market is balanced. The index keeps making new highs, and the average stock is not coming with it. That sentence is the entire letter. Everything below is me showing you, layer by layer, how deep that gap runs, why it matters, and, crucially, why the gap being real does not mean the crack is tomorrow.
I want to be fair about what that does and does not mean. A narrow market is a fragile market, yes. But fragile is not the same as falling. Sometimes a narrow tape is the early innings of a genuine new leadership regime, think of the first eighteen months of the internet build-out, or the first leg of the post-2023 AI trade. Fighting that narrowness because it offends your sense of “healthy breadth” is an expensive mistake. The question is not “is the market narrow.” We know it is narrow. The question is whether the narrowing is the warning or the trade.
Here’s the recap.
To get the most out of these market recaps and understand the framework behind my observations, I encourage you to read about my methodology here.
📊 Market Health
The first thing I do every weekend is count the field, the broad mass of individual stocks underneath the index. Not the index. The field. The S&P 500 is a capitalization-weighted average; a handful of trillion-dollar companies carry vastly more weight than the hundreds beneath them. That index can keep printing green long after the typical stock has rolled over and started bleeding. So I look at the median stock, and I look at participation.
The single most revealing number in this letter: the median 14-day RSI across my full universe closed the week at 51.0. Dead, flat, perfectly neutral. The Nasdaq is up eight percent in a month. The S&P is at all-time highs. And the momentum reading of the typical stock says it has gone precisely nowhere.
The distribution confirms it. Only 5.3% of stocks register as overbought; only 2.0% as oversold. In a genuinely broad bull market, that overbought figure swells to fifteen, twenty, twenty-five percent. What we have instead is a distribution pinned flat in the middle. The enthusiasm that exists on the index screen simply does not exist in the body of the market.
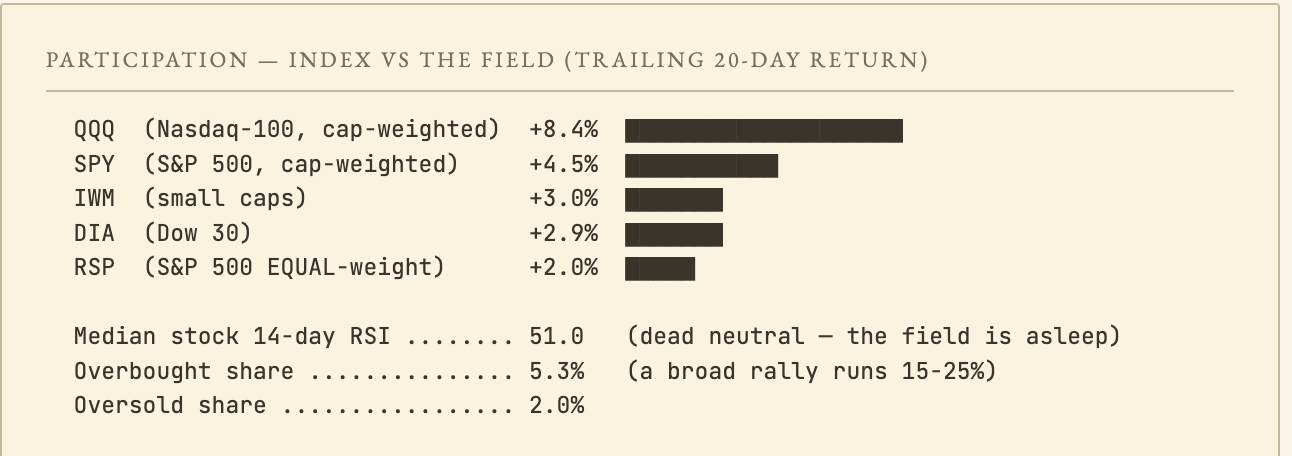
QQQ +8.4%, RSP +2.0%. That gap is not noise. It is the widest we have seen in months, and it tells you exactly how much weight a handful of mega-caps are carrying. The index is healthy. The market is narrow. Both are true at the same time.
The broader breadth panel confirms it:
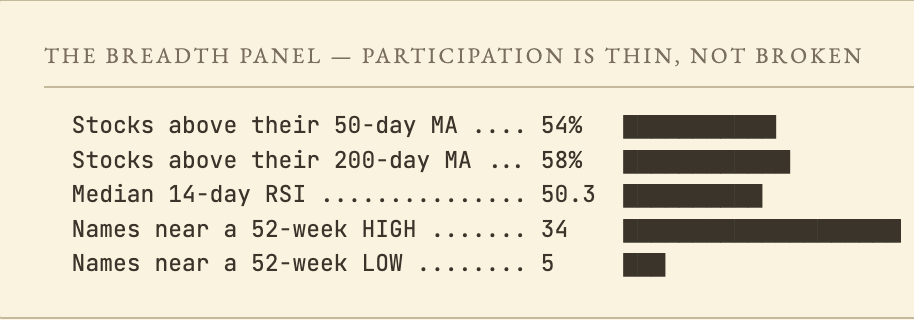
Every line says the same thing in a slightly different dialect. Only fifty-four percent above the fifty-day MA, a hair above a coin flip. The two-hundred-day at fifty-eight percent says the longer-term trend has not yet broken, but is losing energy. The near-highs-to-near-lows ratio is the one genuinely constructive line: thirty-four names pressing highs against only five near lows. That is not the profile of a market falling apart. It is the profile of a market that is narrow and stalling, not broad and collapsing. The internals are weak, but they are not bearish.
So I hold two ideas at once. One: the field is asleep, and a sleeping field is a fragility. Two: that fragility has historically been more profitable to lean with than against, until a specific confirming crack appears. The crack I am waiting for is not "low breadth" (we already have that). It is breadth divergence at a new high that the mega-caps then fail to defend. Index at new highs, internals deteriorating, and the leadership itself stumbling. That three-part configuration preceded the 2021-2022 turn and prior concentration cycles. We have the setup. We do not yet have the trigger.
📉 Volatility
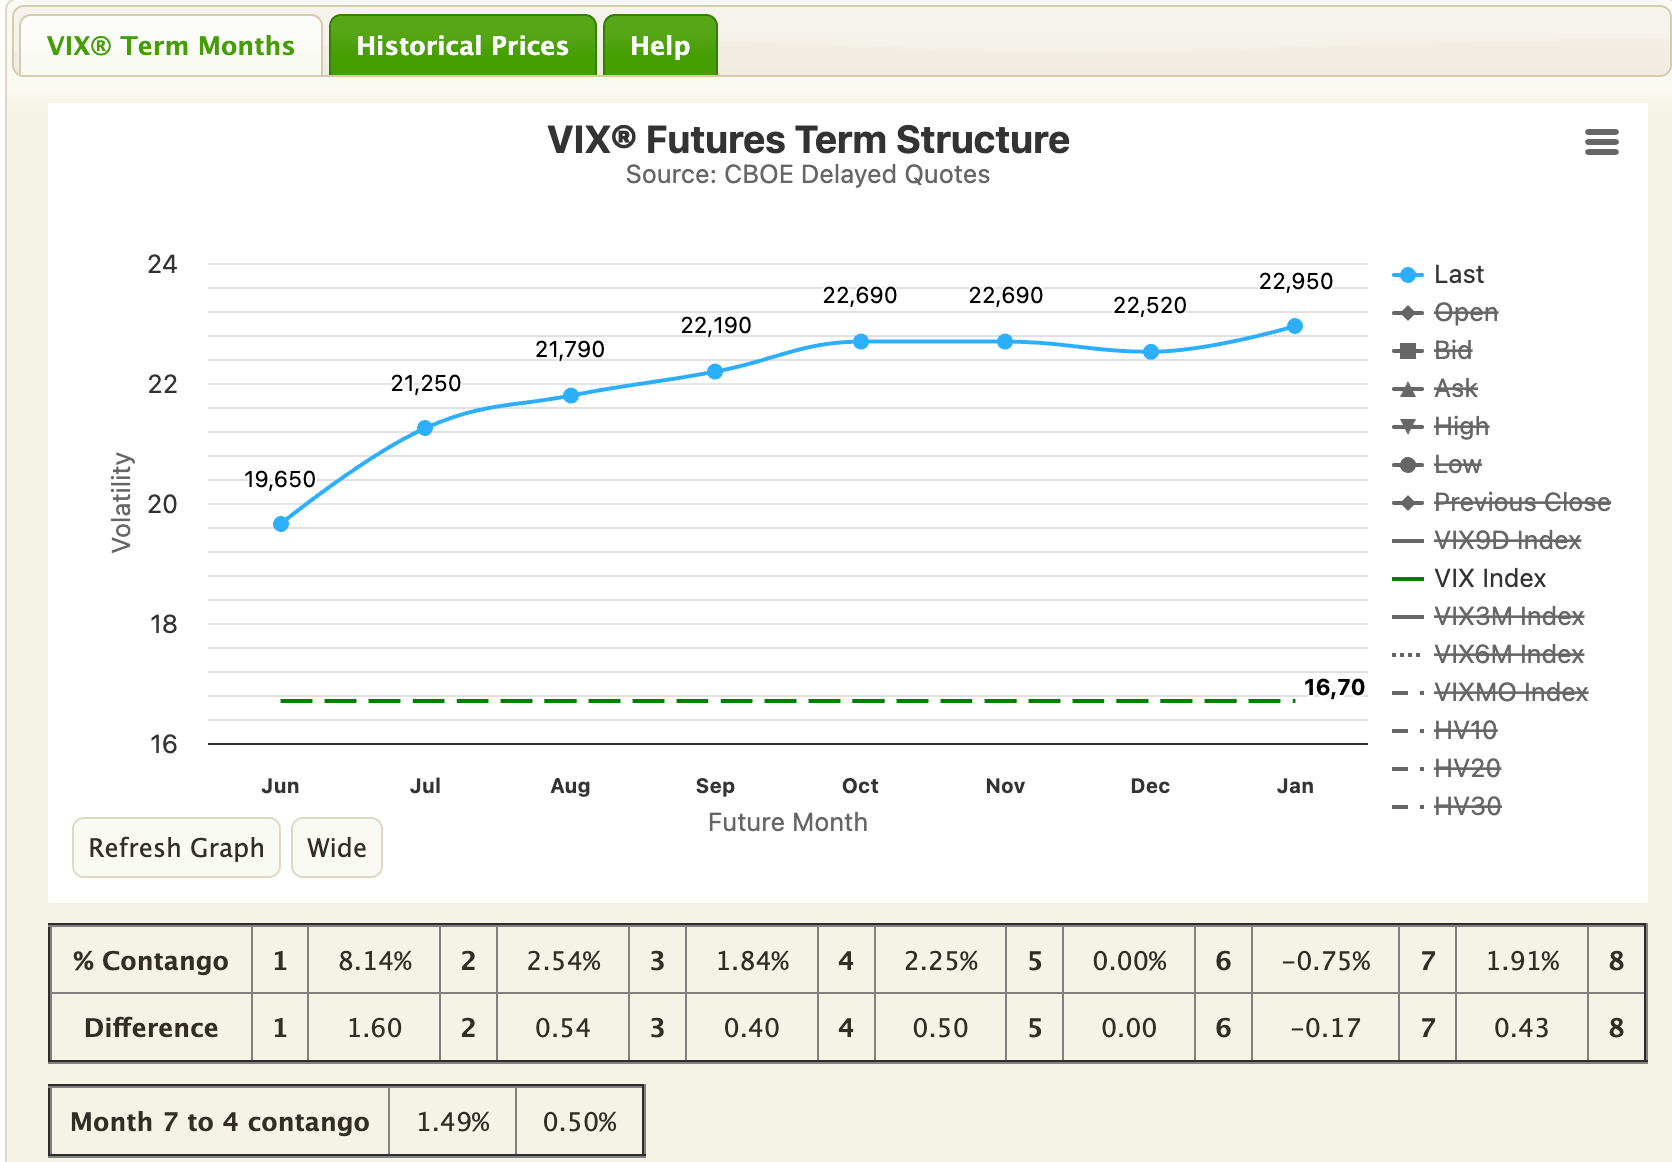
The VIX closed at 16.70. The curve is in clean contango, VIX3M/VIX ratio at 1.199. On the surface, calm. But calm is exactly what precedes tops. This ratio works as a complacency gauge: the higher it climbs, the more complacent the market. The ceiling sits around 1.30, and historically that is where tops form, when complacency is at its maximum. At 1.199 and rising, we are not at that ceiling yet, but we are grinding toward it. Below 1.00 is outright panic. So the read is simple: 1.20 and rising = complacency building, consistent with a top forming. The closer to 1.30, the closer the top.
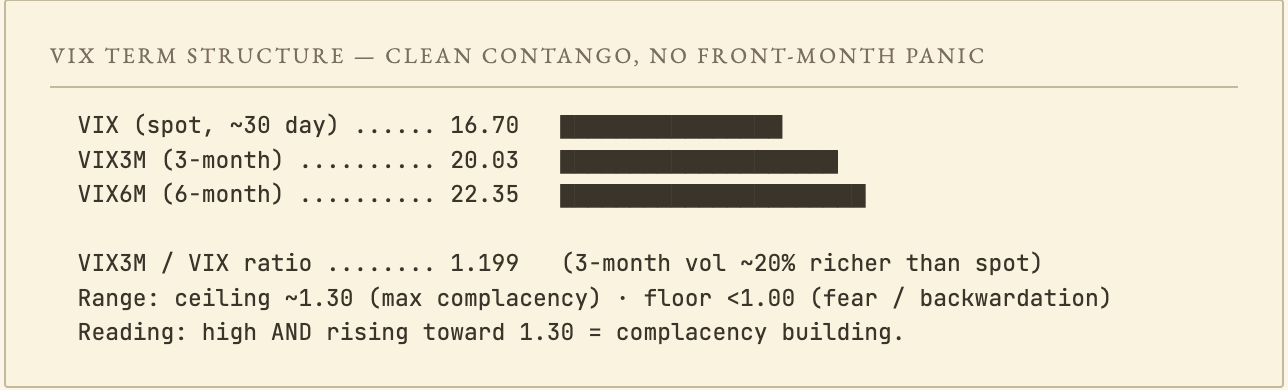
SKEW at 137, below my 140 alert threshold, well below the 145+ readings from mid-May. The crash bid has cooled. Institutions are buying concentration hedges, not catastrophe hedges. The distinction matters: pullback positioning, not crash positioning.
The triad I watch: does VVIX push higher, does SKEW reclaim 140, does VIX3M/VIX compress toward 1.10.
🔍 Pairs Alignment
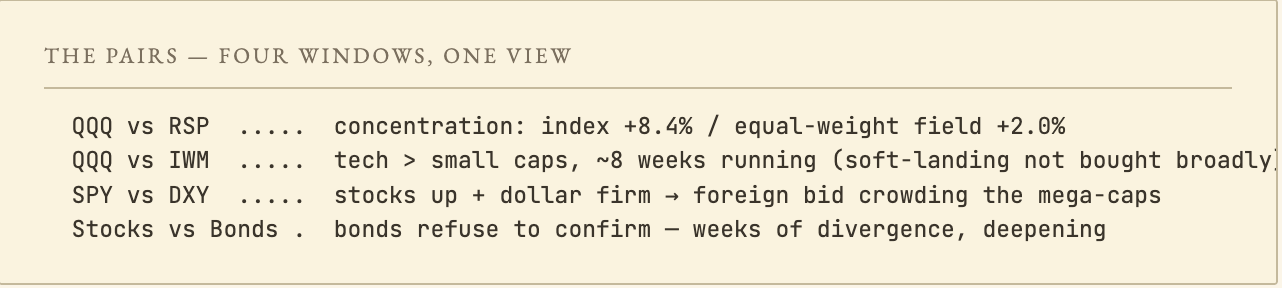
A relationship between two indices cancels out the common factor and leaves only the divergence. This week, every pair I follow points in the same direction.
QQQ vs equal-weight. The purest concentration read. Strip the mega-caps of their weight and the Nasdaq’s eight-percent month collapses to two.
QQQ vs IWM. Tech outperforming small caps for the better part of two months. Small caps are the most rate-sensitive, most domestically-geared corner of the market. When they lag this relentlessly while the VIX is falling, it tells you the soft-landing trade is not being bought broadly, it is being expressed in mega-cap technology and almost nowhere else.
SPY vs the dollar. Stocks rising while the dollar holds firm near 99.3. A strong dollar alongside strong stocks is typically the fingerprint of foreign capital flowing into the largest, most liquid US names. The marginal global buyer is reaching for the same names everyone else already owns, because those are the only ones that can absorb the size.
Stocks vs bonds. The one that has nagged me for weeks. Bonds are refusing to follow equities higher. The long end has been heavy; the twenty-year Treasury proxy is down on the month. The bond market has spent weeks pricing a materially different path than the stock market. When two enormous liquid markets disagree this persistently, the bond market is the one I have learned to bet on being right. Bonds are run by people whose job is to be paranoid about the future. Stocks are run by people whose job is to be optimistic about it. In a standoff, paranoia has the better track record.
🚨 Sector Rotation
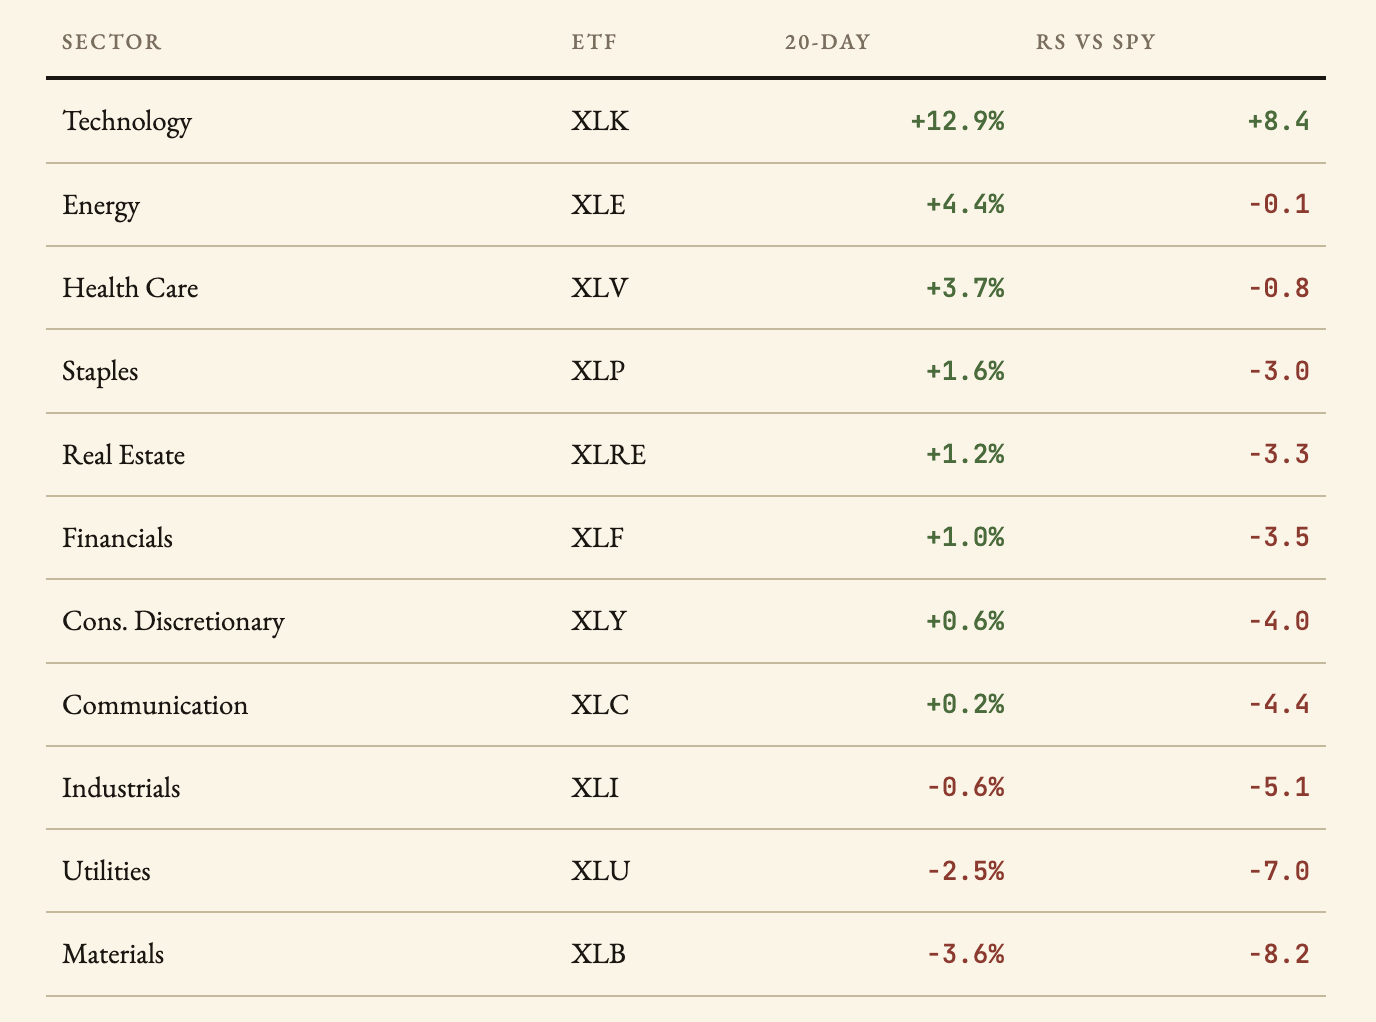
Technology is up nearly thirteen percent on the month, beating the index by more than eight points. The number-two sector, Energy, is essentially flat against the S&P. Everything from Health Care on down is losing relative ground. The bottom of the table is outright red. This is not rotation, the word implies money moving from one sector to another in a healthy cycle. This is one sector levitating while ten sit on their hands or sink.
Energy deserves its own paragraph, because it connects to the biggest macro risk no one in equity-land seems to want to price properly. The US has been conducting military operations against Iran since late February. The Strait of Hormuz, the chokepoint through which roughly twenty percent of global oil transits, has been effectively closed since early March. Energy is the only non-tech sector with any genuine pulse, and it is not because of an organic demand story, it is because of a war that is actively disrupting global supply. Rising energy costs are a tax on every other sector’s margins. When energy outperforms a flat-to-down broad tape, historically the broad tape has tended to follow lower, because the inflationary impulse that lifts oil eventually pressures the rate path everything else depends on. With inflation still running above the Fed’s comfort zone and energy costs elevated, this is not a comfortable backdrop for the rate-cut narrative the equity market is leaning on.
The Discretionary-versus-Staples relationship rounds out the read. Both are barely positive, both lagging, jammed together near the bottom. In a confident expansion, Discretionary pulls away from Staples. We do not have that. Both sitting flat says the consumer trade is neither offensive nor defensive, it is simply absent, ceding the stage to mega-cap tech.
💱 FX
I have said for weeks that the single most important chart in the world right now is not an equity chart. It is USDJPY. It closed the week at 159.16, one good candle away from 160.
The yen has been weakening for one reason above all: the carry trade. You borrow yen at near-zero Japanese rates, convert to dollars, buy higher-yielding US assets, increasingly mega-cap tech, where momentum and liquidity live. As long as the BoJ stays quiet and the yen drifts weaker, the trade prints money on two fronts: the yield differential and the currency move. My working hypothesis is that this cheap-yen funding has helped reinforce the global liquidity bid into US mega-cap tech. The correlation between weak yen, firm dollar, and mega-cap leadership makes it a risk worth tracking, the carry trade and the equity concentration may not be two separate stories, but facets of one trade.
The 160 zone is where the Japanese Ministry of Finance has historically turned from rhetoric to action. They defended it with documented intervention in 2024, spending tens of billions. Several officials in Tokyo recently indicated they could intervene as often as necessary if excessive volatility persists.
The asymmetry: if USDJPY pushes through 160 without intervention, the carry trade rebuilds and the mega-cap bid gets another tailwind. But if 160 holds and the yen reverses, through intervention, rhetoric, or a simple positioning unwind, then for my process, a break back through 155 would be the line where I treat the carry-risk regime as active. Funds that borrowed cheap yen to buy US assets would need to sell those assets to repay loans suddenly more expensive in dollar terms. We have a live rehearsal: August 2024, when a modest BoJ hike produced one of the most violent short-lived equity dislocations in years.
So 159 is the number I go to bed thinking about. It is the most concentrated single point of failure in a market that is already a concentrated single point of failure.
🧠 My Take
The dashboard tells two true stories.
The cautious story. The median stock is asleep while the index makes new highs. The SPX is retesting the February high around 7,400-7,500, same price, weaker participation underneath. That is the structure of a potential double top, and while a double top only confirms on a neckline break far below us, the divergence between this retest and the breadth that accompanied the first high is exactly the kind of deterioration that precedes real tops. Every pair says the same thing four ways. Bonds have refused to confirm for weeks. USDJPY sits one candle from 160. And the macro backdrop now includes an active war with the Strait of Hormuz closed, Brent above $100, inflation still above the Fed’s comfort zone, and a White House that may be about to escalate. Every one of those points cautious on a thirty-to-sixty-day horizon. That is a coherent, mutually-reinforcing case.
The story my bias does not want to write. None of it has triggered yet. The VIX is at 16.7 in clean contango, down from 18.4 last week. SKEW has cooled from above 145 last Friday to 137 now. Both readings moved against my thesis this week: the market is less stressed than it was seven days ago, not more. And statistically, the narrow rally has been a thing to lean with and not against. We have the setup for a top. We do not have the confirmation of one. Last week I flagged Nvidia earnings as the catalyst that could tip the tape lower, it did not. The market absorbed the report and rallied. I owe you that honesty before I give you my lean. The gap between “the setup is present” and “the trigger has fired” can last weeks or months, and being right about the destination while early on timing is, in P&L terms, indistinguishable from being wrong.
Where I sit, no hedging. I lean cautious and believe the top is near. Heaviest cash position of my year. I am not shorting, leaning against a concentration rally that keeps paying is how you get carried out. But I am not chasing it either. Powder dry for the pullback I believe is coming.
Two scenarios with honest odds:
Bullish (~35%): breadth fills in, median RSI climbs off 51, equal-weight catches up, AI earnings next week confirm capex is real and monetizing, and the Iran situation de-escalates enough to bring Brent back toward $80. If the field joins the leaders, this becomes a broad bull and I put the cash back to work without ego.
Bearish (~65%, which is why I lean where I lean): USDJPY rejects 160, the carry unwinds; AI names stumble or guide cautiously Wednesday-Thursday; PCE runs hot; Iran escalates and Brent spikes; and VIX3M/VIX compresses while SKEW reclaims 140. That cluster turns concentration-hedging into contagion-hedging. That is the moment the cash goes to work, first on a tail hedge, then on the shopping list.
We sit between those two scenarios with no trigger yet pulled. The honest position in between is patience. Cash is the position. The shopping list is the homework. The yen and the war are the triggers to watch.
🔥 Trade of the Week:
I will say it before every trade: I am cautious, my cash is the heaviest it has been all year, and I am not abandoning that for a single name. But my screeners flagged a confluence I respect, and it fits the whole letter, because $VRT has already taken its correction.
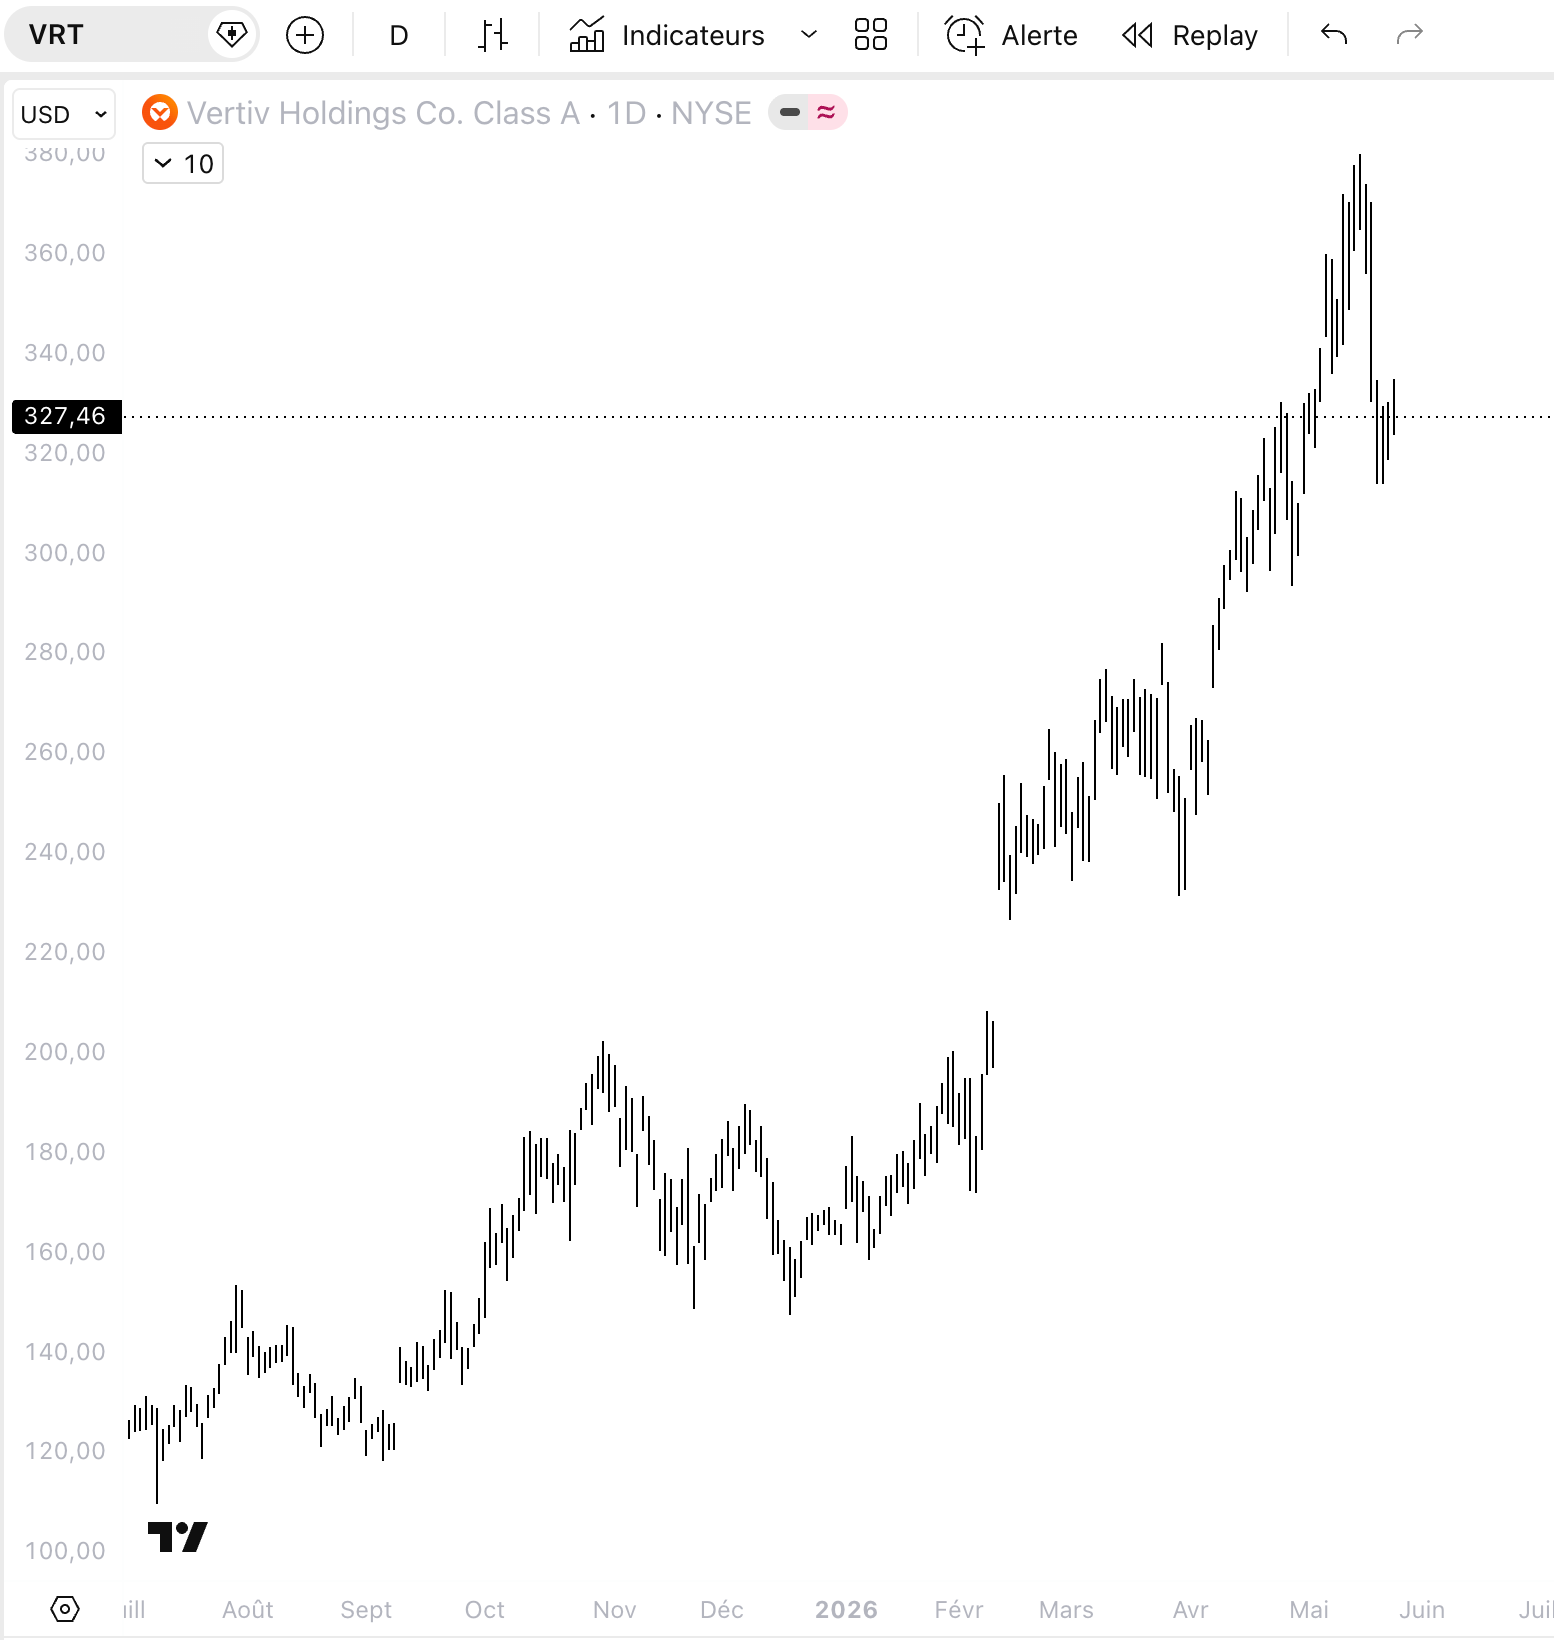
Look at the chart. Vertiv ran from $120 last summer to a $380 high in May, then pulled back to $327. In a market where everyone is long every mega-cap at full stretch, the names that have already corrected are the ones that often fall less on red days. Their weak hands are already gone, their sellers already exhausted. That is the entire logic of owning VRT into a tape I am cautious on.
The thesis sits in three layers.
First, the business. Vertiv is the picks-and-shovels of the AI build-out: power, cooling, thermal management for data centers. Not a narrative stock. The company that physically keeps the AI infrastructure from melting. Last quarter: sales up ~30%, a ~$15B backlog, guidance raised. This is the real economy of the AI trade, not the multiple-on-vibes layer. The risk is valuation: at a premium multiple, VRT can still de-rate violently if AI capex expectations cool.
Second, the tape. Up huge over the year, but pulled back ~13% from its high. The sweet spot of a continuation setup: a structural uptrend that shook out the chasers without breaking. My Breakout and Pullback screeners fired on the same name, same day. Next earnings are not until late July, so there is no binary event risk inside the swing.
Third, the asymmetry. If the AI capex names confirm next week and the tape holds, VRT rides the leadership it belongs to. If the market wobbles, an already-corrected name bleeds less than the index and often diverges green on a red day. Both ways are survivable. That is why it is the one long I will carry through my caution.
Entry zone: $318 – $329
Stop: $289
Target 1: $360
Target 2: $380 (retest of the May high)
Sizing: start 2%, add +1% on a close back above $345, max 3%
🧘 The Philosopher’s Corner
There is a particular kind of pain that markets reserve for the person who is right too soon. You see the fragility clearly. You know, with the certainty of someone who has done the work, that this cannot hold forever. And then it holds. Another week. Another month. And the market whispers that you were wrong, that the people who stayed fully long were the smart ones, that your caution was never discipline but cowardice wearing discipline’s clothes.
The philosopher’s answer is to ruthlessly separate two things the market deliberately conflates: being correct and being vindicated. They are not the same thing, and the market pays them out on completely different schedules. The entire psychological game of this profession is surviving the gap between the two.
Cash, in that gap, is not weakness. Cash is the form of patience. The refusal to let the market’s timing dictate your conviction.
The Stoics had a phrase I keep close in weeks like this: focus only on what is within your control. I cannot control when the pullback comes, whether the yen breaks 160 next Tuesday or next quarter, whether PCE runs hot, or whether bombs fall over Memorial Day weekend. None of that is mine to command. What is mine, entirely, is whether I am positioned to act with clarity when the moment arrives. Whether I have the cash. Whether I have the homework done. Whether I have the composure to buy quality on sale while the crowd is selling.
Being early is only a mistake if it makes you abandon your discipline before the thesis plays out. Held correctly, being early is simply patience that has not yet been paid.
I would rather be early and liquid than late and trapped.
See you next week,
Daniel
Disclaimer
This newsletter is for educational and informational purposes only. It is not financial advice.
The content reflects personal opinions shared publicly as a journal. Trading stocks, options, futures, or any financial instrument involves significant risk. You can lose your entire investment. There is no guarantee of profit.
The author is not a registered investment advisor, broker, or financial professional with any regulatory authority including the SEC or CFTC. Always consult a licensed financial advisor before making any investment decisions.
By reading this newsletter, you accept full responsibility for your own trading and investment choices. Past performance does not guarantee future results. Markets are unpredictable.
Screenshots are courtesy of TradingView, VixCentral, and other platforms with which the author has no affiliation. Information shared may contain errors or become outdated quickly.
This content is the intellectual property of the author. Copying or redistributing without permission is prohibited.
By continuing to read, you acknowledge and accept these terms.
Read the desk every week
Market analysis in plain English, plus the app that scans the whole US market for you.
Become a member Read the original on Substack ↗