The Market Looks Fine. That’s the Problem.
Market Recap — May 10th 2026
2026-05-10 · 9 min read · Originally published on Substack ↗


Hello my friends,
Markets keep grinding higher. You can have plenty of opinions about valuations, about whether this rally can keep running. My honest take: we are probably closer to a local top than most people want to admit. Could it push higher? Sure. Maybe it will. But there is nothing wrong with managing risk, trimming a bit, and getting ready to buy the next dip when it comes.
Some moves this week were genuinely striking is the perfect example. Ripping in a straight line, no pullback, no breather. And it is not an isolated case. Earnings season was strong across the board, and the fundamentals are starting to catch up to the rally.
The character of this market has shifted. A new kind of rally is taking shape, one where AI works as the operating layer of the entire economy. Infrastructure is being rebuilt around it. Energy demand is being recalculated for it. The way society works, consumes, and produces is getting repriced. The thesis is real, and it could carry markets higher than most bears want to admit.

On my side, I have been heads down these last weeks improving my models, backtesting, hunting for alpha. Things have never been easier. Plug Claude Code into a couple of APIs and you have powerful tools to turn your ideas into something real. I encourage you to try it. It is genuinely addictive. I am building new proprietary indicators and new screeners, and I will share my best findings with you as they come.
I am also working on new formats for this newsletter and I would love your input. Don’t hesitate to send me an email telling me what you want me to dig deeper into. Your feedback shapes what comes next.

One quick note before we dive in. Last week’s trade was a strong one. Almost +30% with in just a few days. I hope you caught a piece of it and booked some profits.
And that brings me to why this period is tricky. The trendy names in euphoric phases offer the biggest short term gains. They also tend to indicate that we are getting closer to a top. When things break, and eventually they always do, they break fast. The old line still holds: the market takes the stairs going up and the elevator going down. I am not calling the top. I am saying the forward risk/reward is getting worse.
Now let’s go to the analysis.
To get the most out of these market recaps and understand the framework behind my observations, I encourage you to read about my methodology here.
What I’m Seeing
The market just printed a new high.
The VIX sits at 17.
Eight of eleven sectors are above their 50-day moving average.
Everything looks fine.
So why am I sitting heavier in cash than at any point this year? Because three signals on my dashboard moved into extreme zones at the same time this week.

The high-beta to safe-asset ratio is one of my favorite “risk appetite” checks. It compares how aggressively investors are buying high-beta stocks versus safer assets.
This week, it hit +3.23 standard deviations above its five-year average.

That is rare.
Historically, when risk appetite reached similar extremes, SPY showed an expected -5.4% return over the next 120 trading days. The signal worked 88% of the time across comparable past euphoria episodes.
Not a timing signal but a warning that the market is already paying an extreme price for risk.
The second warning is concentration.
The gap between the leaders and the rest of the market just hit a 24-month extreme.
Over the last sixty days, the top eight mega-caps returned roughly +17% on a cap-weighted basis. The equal-weight S&P 500 returned just +0.8% over the same window.
That is a spread of about 16 percentage points between the stocks carrying the index and the average stock inside the index.
Translation: eight stocks are carrying the index.
The dangerous part is how these gaps usually close. Investors assume the laggards will catch up. Historically, the cleaner resolution is often the opposite: the leaders catch down.
That is the risk now.
If the eight stocks that carried the market give back even half of their move, what happens to your book?
The third signal is: Technology versus Utilities.
By itself, the XLK-to-XLU ratio is not a crash signal. It measures how much investors are paying for risk-on growth relative to defensive yield. In normal weeks, that does not matter much.
But the moment it stretches to an extreme, it becomes a positioning signal.
Last Friday, XLK/XLU closed at 3.92. The highest reading in ten years.
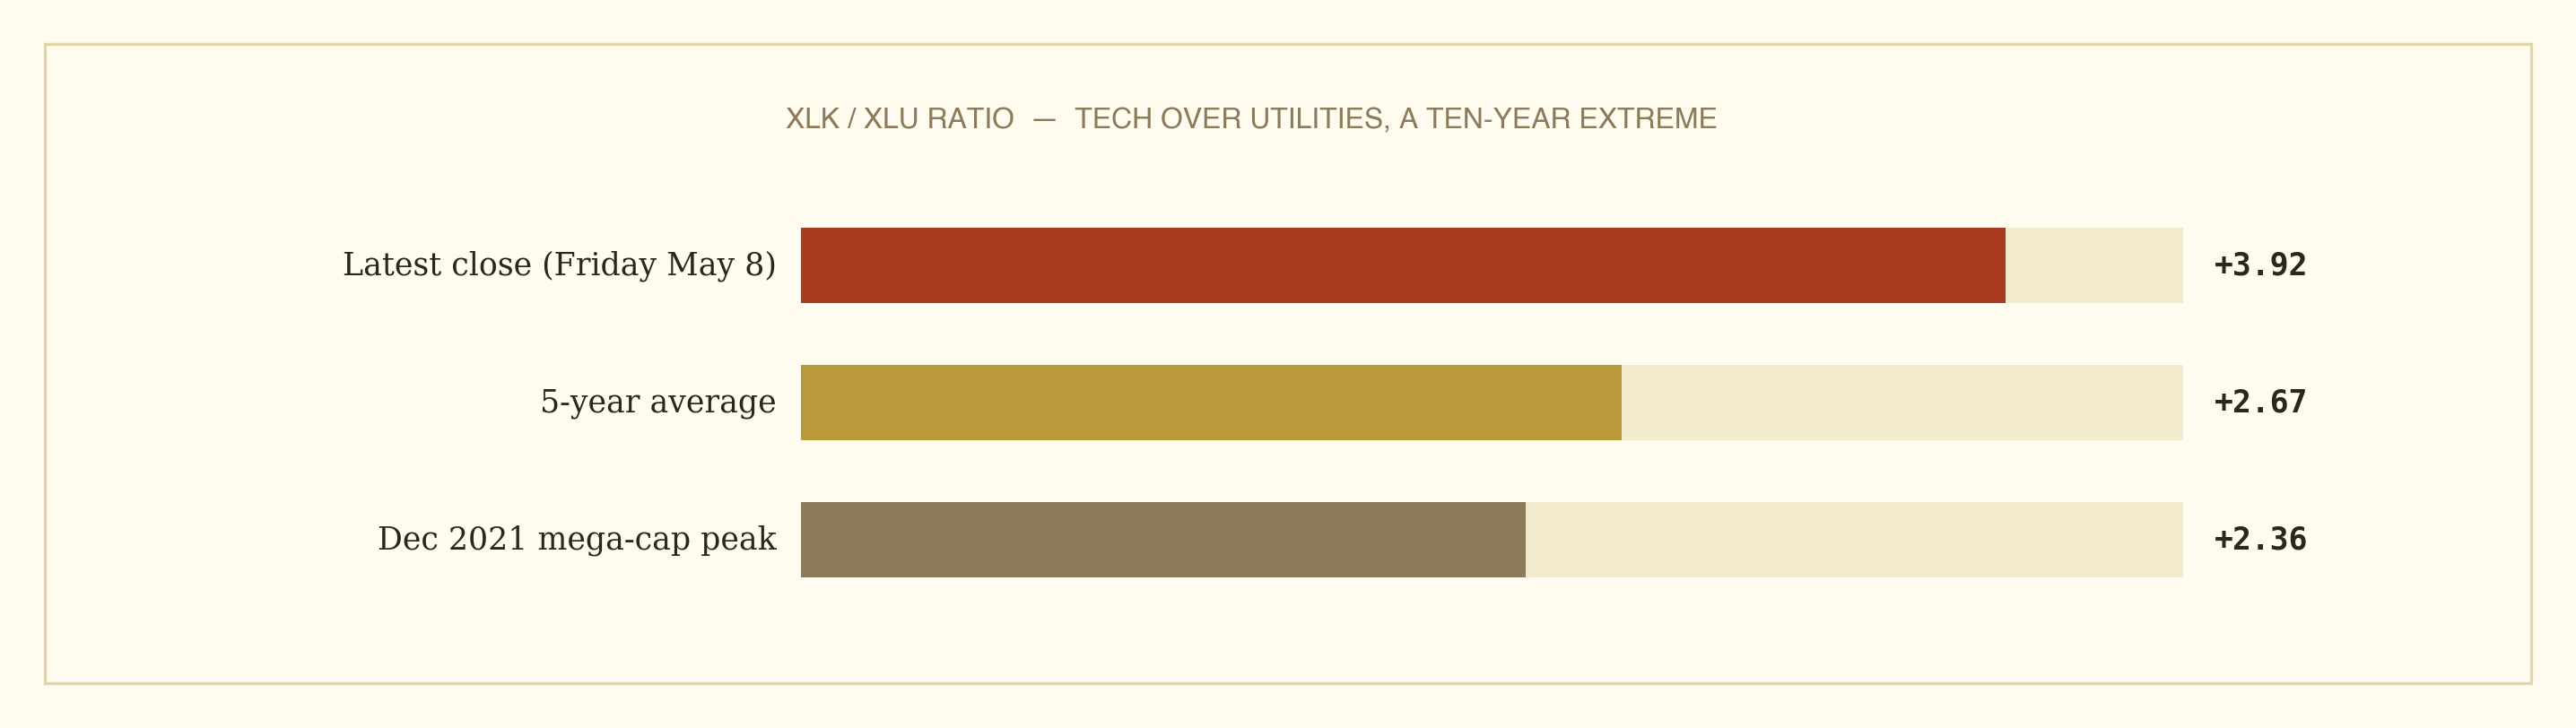
For context, the five-year average is 2.67.
At the December 2021 mega-cap top, the ratio was 2.36.
Today’s 3.92 reading is 47% above the five-year mean and 66% above the level seen at that 2021 top.
When the ratio stretches this far, it usually means investors have aggressively paid up for growth while abandoning defensive exposure.
The message is clear enough. Positioning has reached a one-sided extreme not seen in a decade.
And here is what makes this week different.
Risk appetite already at a top 1% reading. Mega-cap concentration already at a 24-month extreme. And now the cleanest read on growth versus defensive positioning at its highest level in ten years.
These three signals rarely show up at the same time.
Market tops rarely begin with everything breaking at once. They usually begin with risk appetite at extremes, leadership narrowing, and defensives being abandoned before the index notices.
That is the risk this week.
Extreme risk appetite.
Mega-cap concentration.
The most lopsided Tech-over-Utilities positioning in a decade.
All three present at once.
Volatility (not a red flag yet)
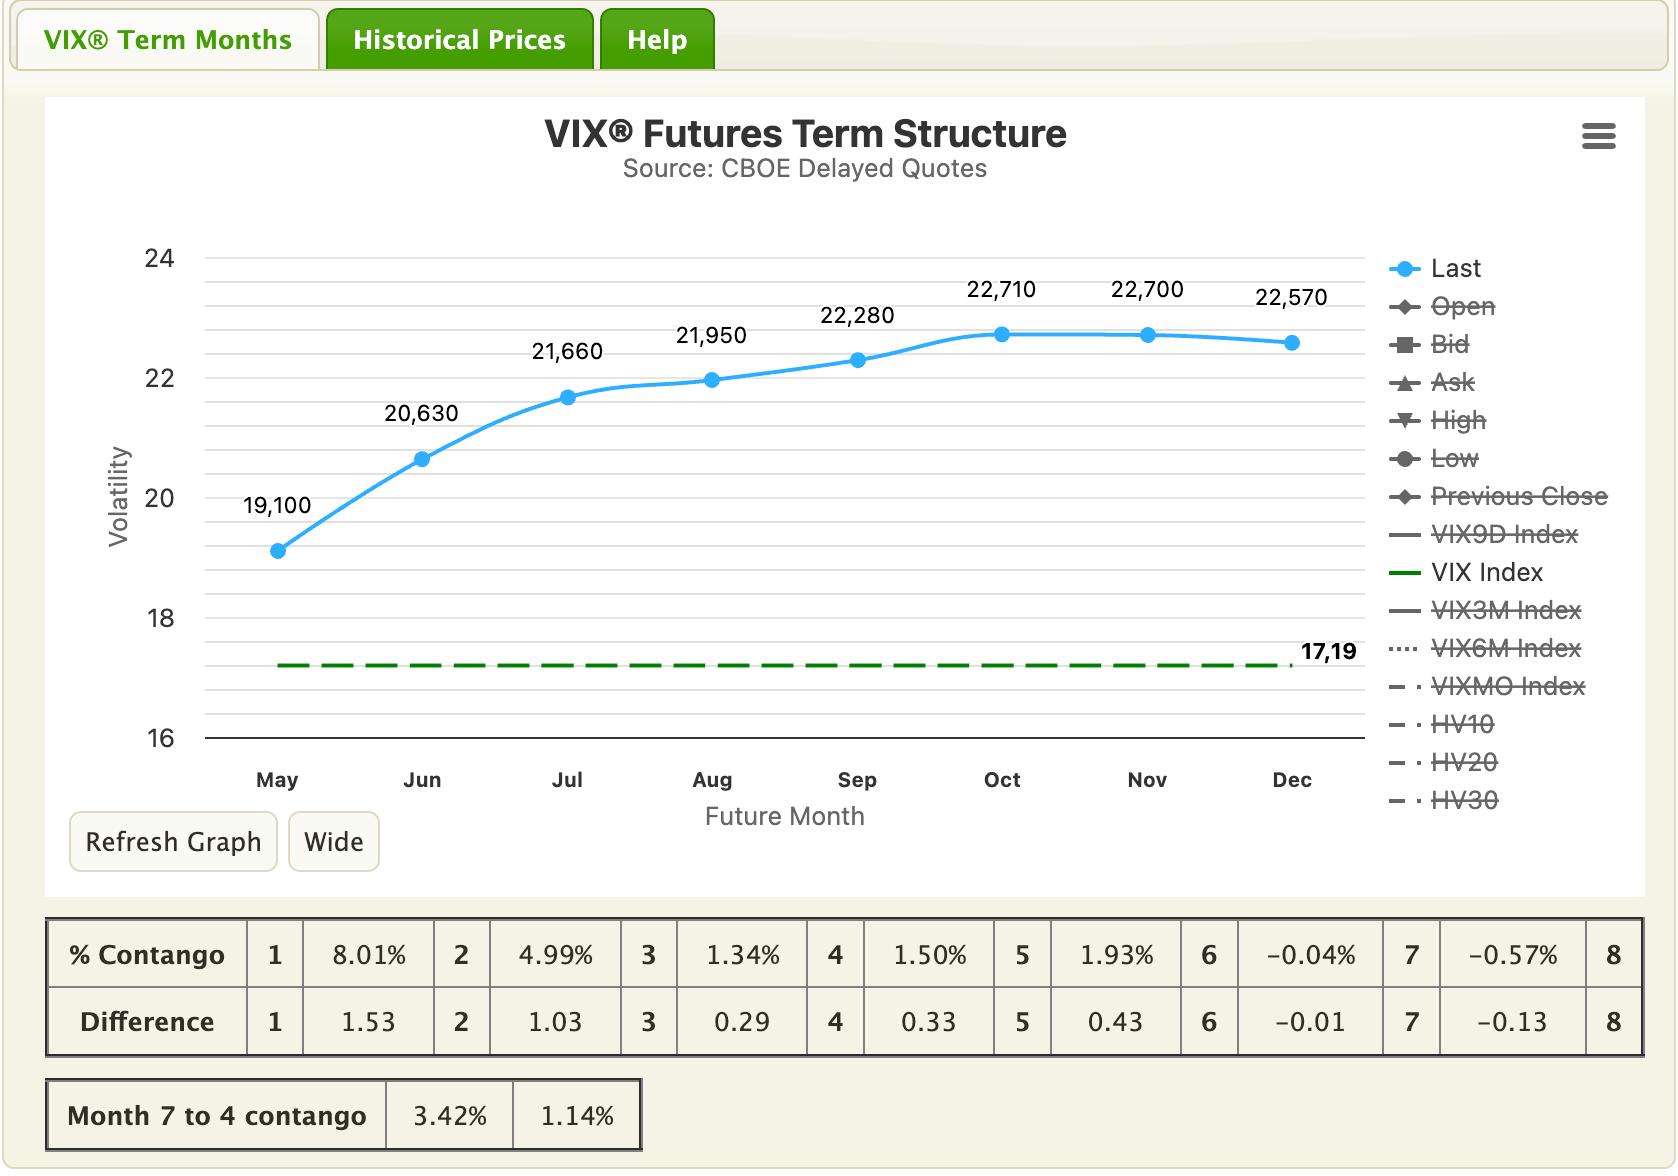
VIX is around 17, which is calm.
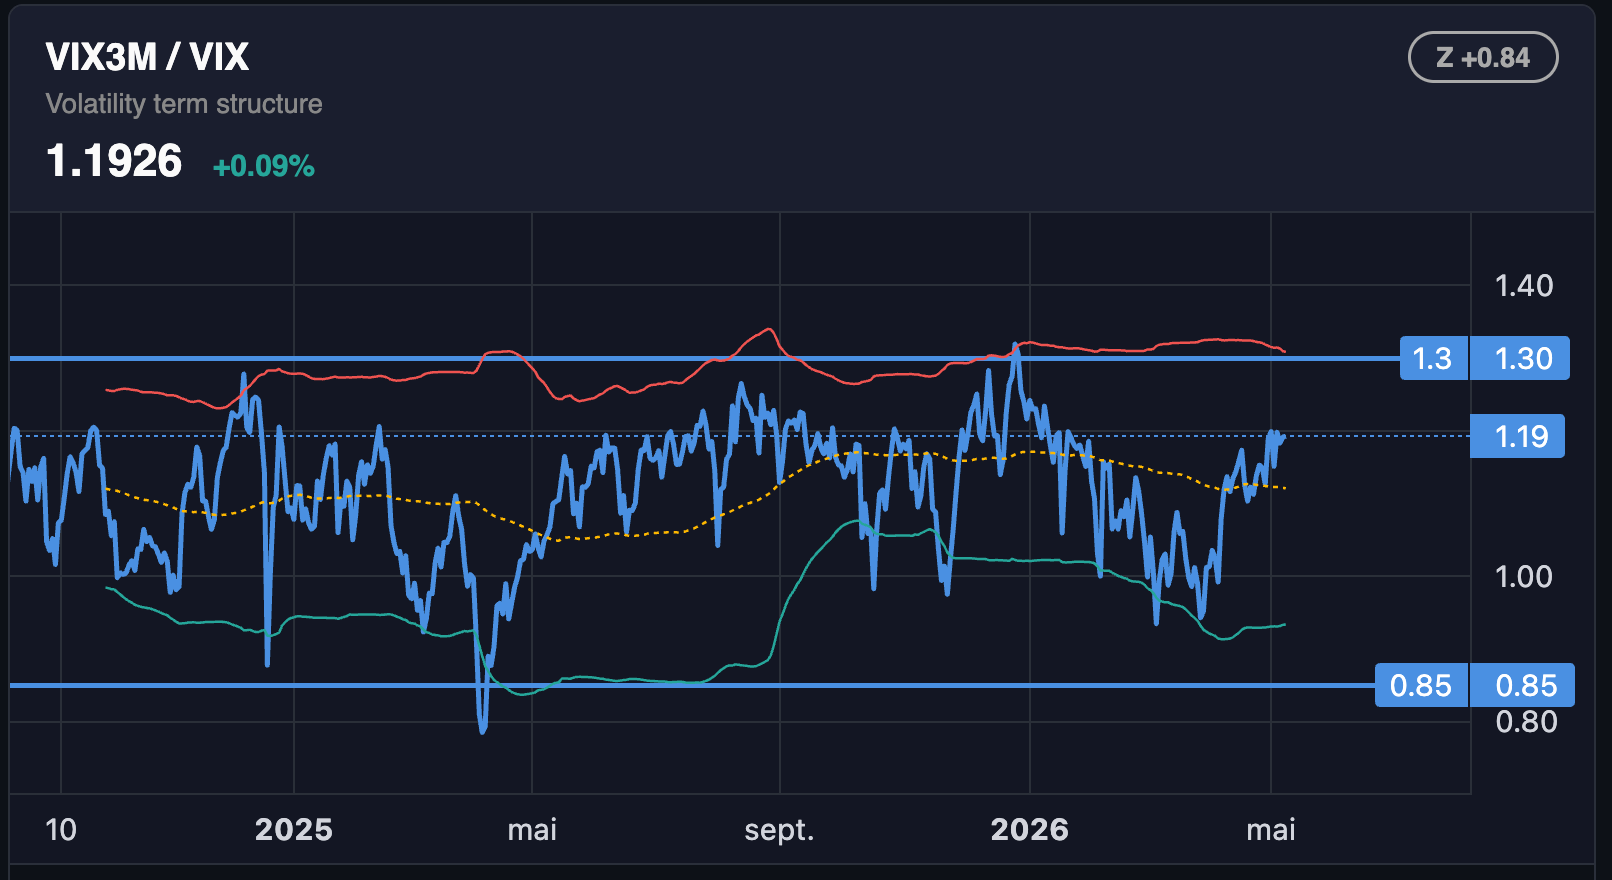
The VIX3M/VIX ratio is 1.19. That means 3-month volatility is trading about 19% above spot VIX. But that alone is not unusual. In calm markets, longer-dated volatility normally trades above front-month volatility.
The important level for me is closer to 1.30.
When this ratio pushes toward 1.30, it usually means front-month volatility is extremely compressed while the market is still pricing risk further out. That type of setup often appears near market tops: investors feel calm today, but the curve is quietly telling you future risk is not gone.
We are not there yet.
At 1.19, the signal is rising, but not extreme. So I would not use volatility as the main evidence for a market top this week.
The better takeaway is simpler:
Volatility is not flashing red, but it is not blocking the bear case either.
Spot VIX is calm. The curve is mildly elevated. Tail protection is still reasonably priced. If you already have concerns from concentration, high-beta risk appetite, and stretched Tech-versus-Utilities positioning, the vol market gives you room to hedge before protection gets expensive.
🔥 Trade of the Week:
APTV: Two persistent signals over ten sessions, confirmed by the post-earnings reset.
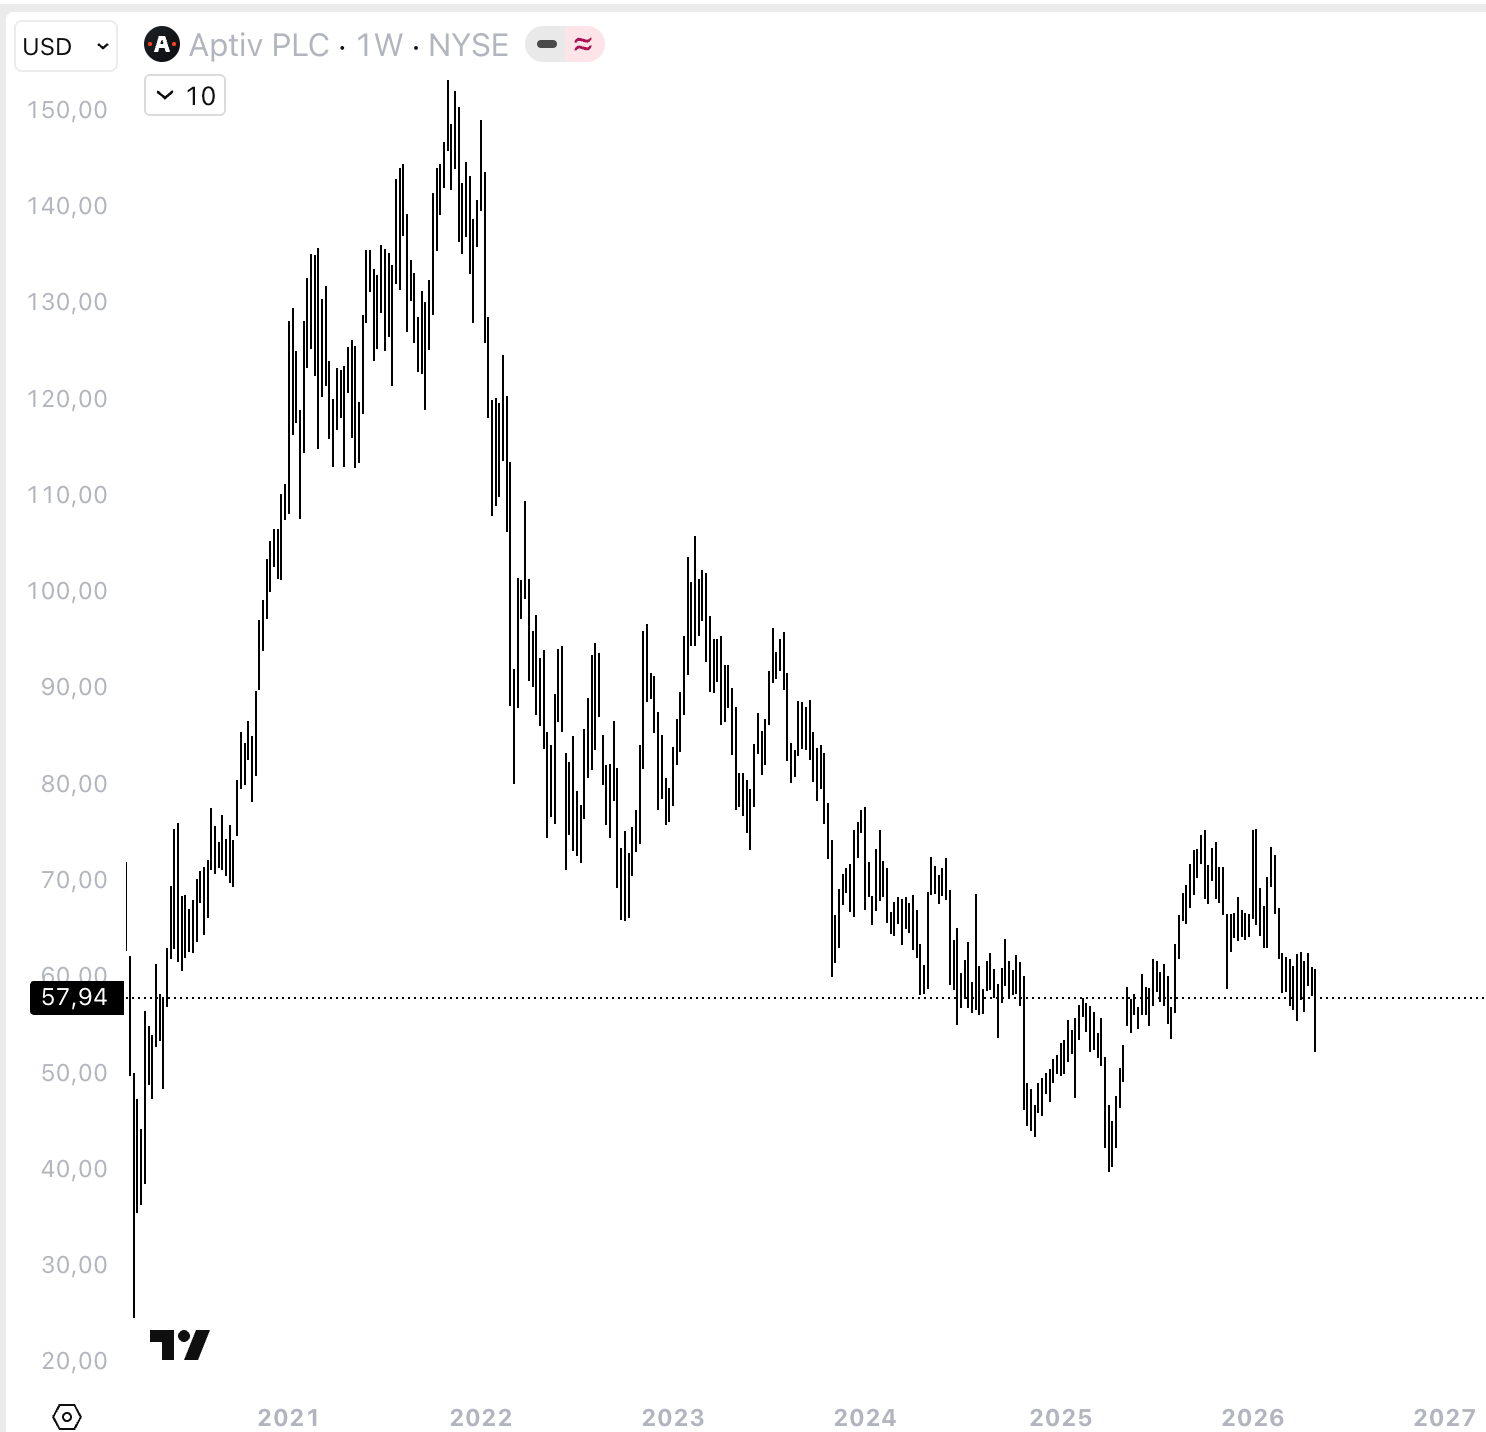
Aptiv is now a more focused auto-tech name after the Versigent spin-off completed on April 1. The remaining business covers advanced safety, vehicle compute, software-enabled systems, and electrification. Currently trading at $57.94 with a market cap around $12B.
The signal stack. Two of my models have been firing on APTV every session for two weeks straight. The first is a capitulation read showing the stock has been pushed too far down. The second is my highest-conviction mean-reversion signal pointing to a significant overshoot. Both have stayed on for 10 consecutive sessions. That persistence is what gives this setup its conviction.
A third read fired on May 6, the session right after the earnings drop: a post-earnings recovery indicator catching the classic bounce pattern after a sharp move down. The two persistent signals carry the trade. The post-earnings confirmation seals it.
The technical setup. APTV closed Friday at $57.94, trying to build a base in the high-$50s near the lower end of its multi-year range. What we have is a damaged long-term chart trying to form a higher low above the $46 capitulation bottom from 2025. This year’s low sits at $52.38. Medium-term, the trend is rebuilding. Long-term, it stays broken.
The earnings reset. Aptiv reported Q1 before the open on Tuesday, May 5. The headline was strong: revenue $5.1B (+5% YoY), adjusted EPS $1.71, adjusted EBITDA $752M. Management called it a record first quarter. The stock still saw an initial post-earnings sell-off driven by guidance digestion and the post-spin reset. The numbers themselves were good. The recovery signal fired the next session as the sell-off got absorbed. A few sessions later, price is back to $57.94, with the initial sell-off largely absorbed.
Why this matters. The mean-reversion read is the highest-conviction model in my stack. When it stays on for ten consecutive sessions, that is rare. The capitulation signal staying on alongside it confirms the technical washout. The post-earnings recovery indicator on May 6 confirms the bounce is following its historical playbook. Persistence is what carries this trade.
Earnings risk is behind us. Default position is spot, sized as a base position. If I confirm implied volatility is low enough on the chain to justify a directional call structure, I will note it in the alert before entry.
The setup:
Entry: Starter position at $57 to $58
Add: Above $60 if price holds, or above $62 to $63 on strength
Stop: First warning below $54. Full invalidation below $52.38, the current 2026 low
Target 1: $62 to $63
Target 2: $68 to $70
Sizing: Start with 1.5% of book. Add 1.0% on confirmation. Max position 2.5%
What invalidates the thesis: APTV breaks below $54 on a closing basis, especially with broader risk-off. A clean break below $52.38 kills the higher-low setup.
🎯 Portfolio Performance
I share entry levels, stops, and targets. I don’t take every position I flag. Position sizes are yours to decide based on your own risk tolerance. This is a model portfolio updated weekly at Friday’s close. My personal positions may differ in timing and sizing.
As mentioned last week, I have been reducing my positions to build a heavier cash posture.
This week: exited IREN around $60 for almost +30% from the $45.66 entry. The setup played out exactly into Thursday earnings. Profit locked.
I am keeping BUR for the moment. The position is still in solid profit, but my confidence is decreasing after the earnings. The liquidity crisis still does not appear real, but the “free option” framing is weaker. YPF is now less of a bonus and more of a credibility overhang. The core business must prove itself in cash, not just in modeled realizations.
VGZ continues as the gold tail hedge by design.
We are in profit across the book. The priority now is to keep building the cash position.
See you next week,
Daniel
Disclaimer
This newsletter is for educational and informational purposes only. It is not financial advice.
The content reflects personal opinions shared publicly as a journal. Trading stocks, options, futures, or any financial instrument involves significant risk. You can lose your entire investment. There is no guarantee of profit.
The author is not a registered investment advisor, broker, or financial professional with any regulatory authority including the SEC or CFTC. Always consult a licensed financial advisor before making any investment decisions.
By reading this newsletter, you accept full responsibility for your own trading and investment choices. Past performance does not guarantee future results. Markets are unpredictable.
Screenshots are courtesy of TradingView, VixCentral, and other platforms with which the author has no affiliation. Information shared may contain errors or become outdated quickly.
This content is the intellectual property of the author. Copying or redistributing without permission is prohibited.
By continuing to read, you acknowledge and accept these terms.
Read the desk every week
Market analysis in plain English, plus the app that scans the whole US market for you.
Become a member Read the original on Substack ↗