The Rally Nobody Joined
Market Recap — April 12th 2026
2026-04-12 · 14 min read · Originally published on Substack ↗
TL;DR
Breadth score flat at 51/100 despite SPY’s best week since November (+3.6%). The ceasefire rally is real. The participation is not. Only half the market above its 50-day average.
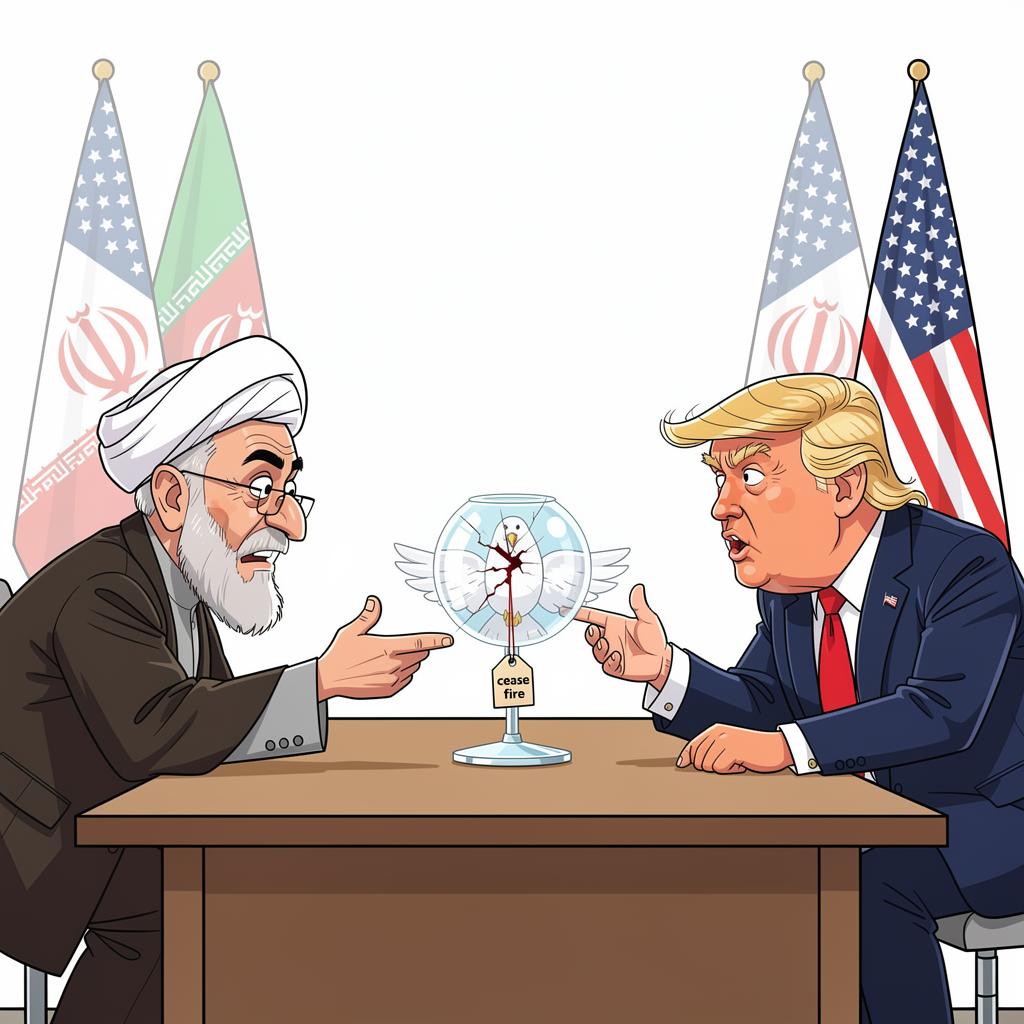
Trump announced a 2-week ceasefire with Iran on Tuesday. Oil crashed 13-16%. But Hormuz is still closed. Iran is charging $1-2M per ship to pass. VIX crashed to 19.23 (down -19.4%)
Trade of the Week: IVZ (Invesco). Five screeners fired simultaneously on this $1.8T asset manager riding the financial breadth recovery. Entry $23-24, targeting $27 then $29.50.

Hello my friends,
Tuesday evening, Donald Trump did exactly what we expected him to do. He folded. The TACO playbook in action.
After threatening that “a whole civilization will die tonight” just hours earlier, he announced a two-week ceasefire mediated by Pakistan. Oil crashed 13-16% the next session. The S&P surged +2.55% on Wednesday in a single session. For one glorious day, it felt like Liberation Day 2.0. The same playbook: rhetoric escalates until it is unbearable, then suddenly reverses, and everyone who sold the panic looks foolish.
Except for one detail. The Strait of Hormuz is still closed. Iran limited passage to 10-15 ships per day and began charging tolls of $1-2 million per vessel depending on cargo. The ceasefire stopped the bombing. It did not reopen the shipping lane. Oil bounced from $92 back above $97 by Friday as the market realized that de-escalation in words is not de-escalation in fact.
Then Friday’s CPI landed. Headline inflation jumped to 3.3%, the highest in two years, driven entirely by energy. But core CPI came in at 2.6%, in line with or slightly below consensus. The market parsed this correctly: the oil war is inflationary on the surface, but the underlying economy is not overheating. Yet. FOMC minutes released Wednesday added a wrinkle: some participants pushed for policy to be described as “two-sided,” explicitly putting rate hikes back on the table alongside cuts. First time in this cycle that both directions are being discussed.
Last week I told you Monday would be the pricing event for the Iran ultimatum. The pricing was violent, but it went the other direction from what the bears expected. The question now is whether breadth will follow the indices higher. So far, it has not. And earnings season kicks off next week.
To get the most out of these market recaps and understand the framework behind my observations, I encourage you to read about my methodology here.
Market Breadth
Breadth Score: 51/100 – 🟡 CAUTIOUS
The most important number this week is the one that did not change.
SPY rallied +3.6%. QQQ surged +4.46%. Small caps ripped +3.98%. The VIX cratered -19.4%. And the breadth score, the measure of how many stocks are participating in the move, stayed exactly where it was: 51/100.
That is a tell.
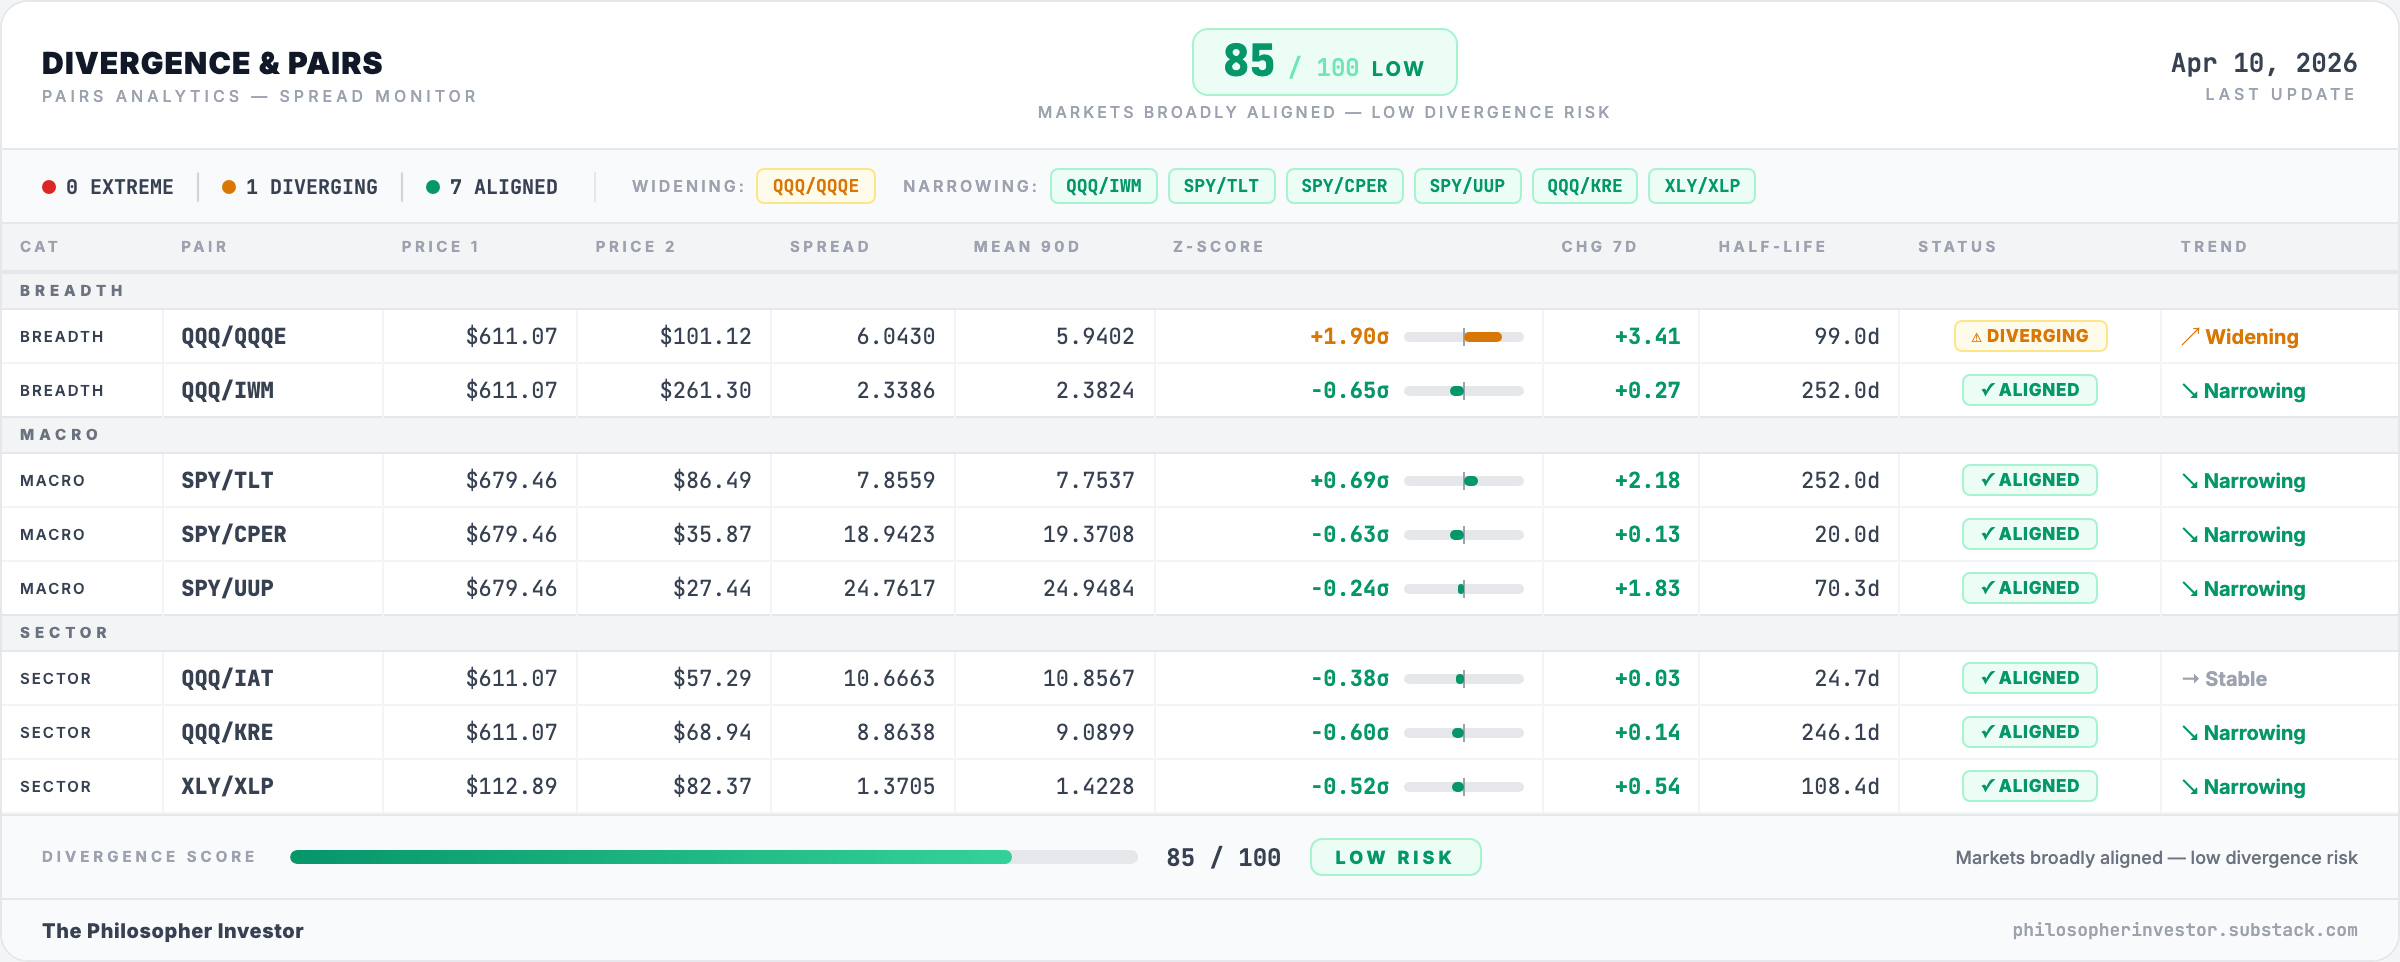
The McClellan Oscillator (a momentum indicator measuring the difference between advancing and declining stocks, smoothed over time) sits at +114.1, down from last week’s elevated reading but still positive. The daily momentum is healthy. But the McClellan Summation Index (the cumulative version that tracks whether damage is building or fading over weeks) remains at -182, improved from -854 a month ago, but still negative. The accumulated damage from six weeks of selling is not repaired in one good week.
The moving average breakdown confirms the narrowness. 51.2% of S&P 500 stocks trade above their 50-day moving average, down -2.3 points from last week despite the rally. Read that again. The index went up 3.6% and the percentage of stocks above their 50-day average went down. This means the rally was concentrated in the largest names, mega-cap tech and a handful of cyclicals, while the rest of the market either stood still or fell.
New highs at 116 versus new lows at 103. The NH/NL ratio of 1.13 is barely positive. In a healthy rally, you want this ratio above 3. We are at 1.13.
The Zweig breadth thrust indicator (a measure of explosive buying pressure that signals durable bottoms) at 50.7% with no thrust signal means this is not the explosive breadth surge that marks durable bottoms.
The rally was real. The breadth improvement is a mirage.
🚨 Sector Rotation: Two Survivors
What changed this week:
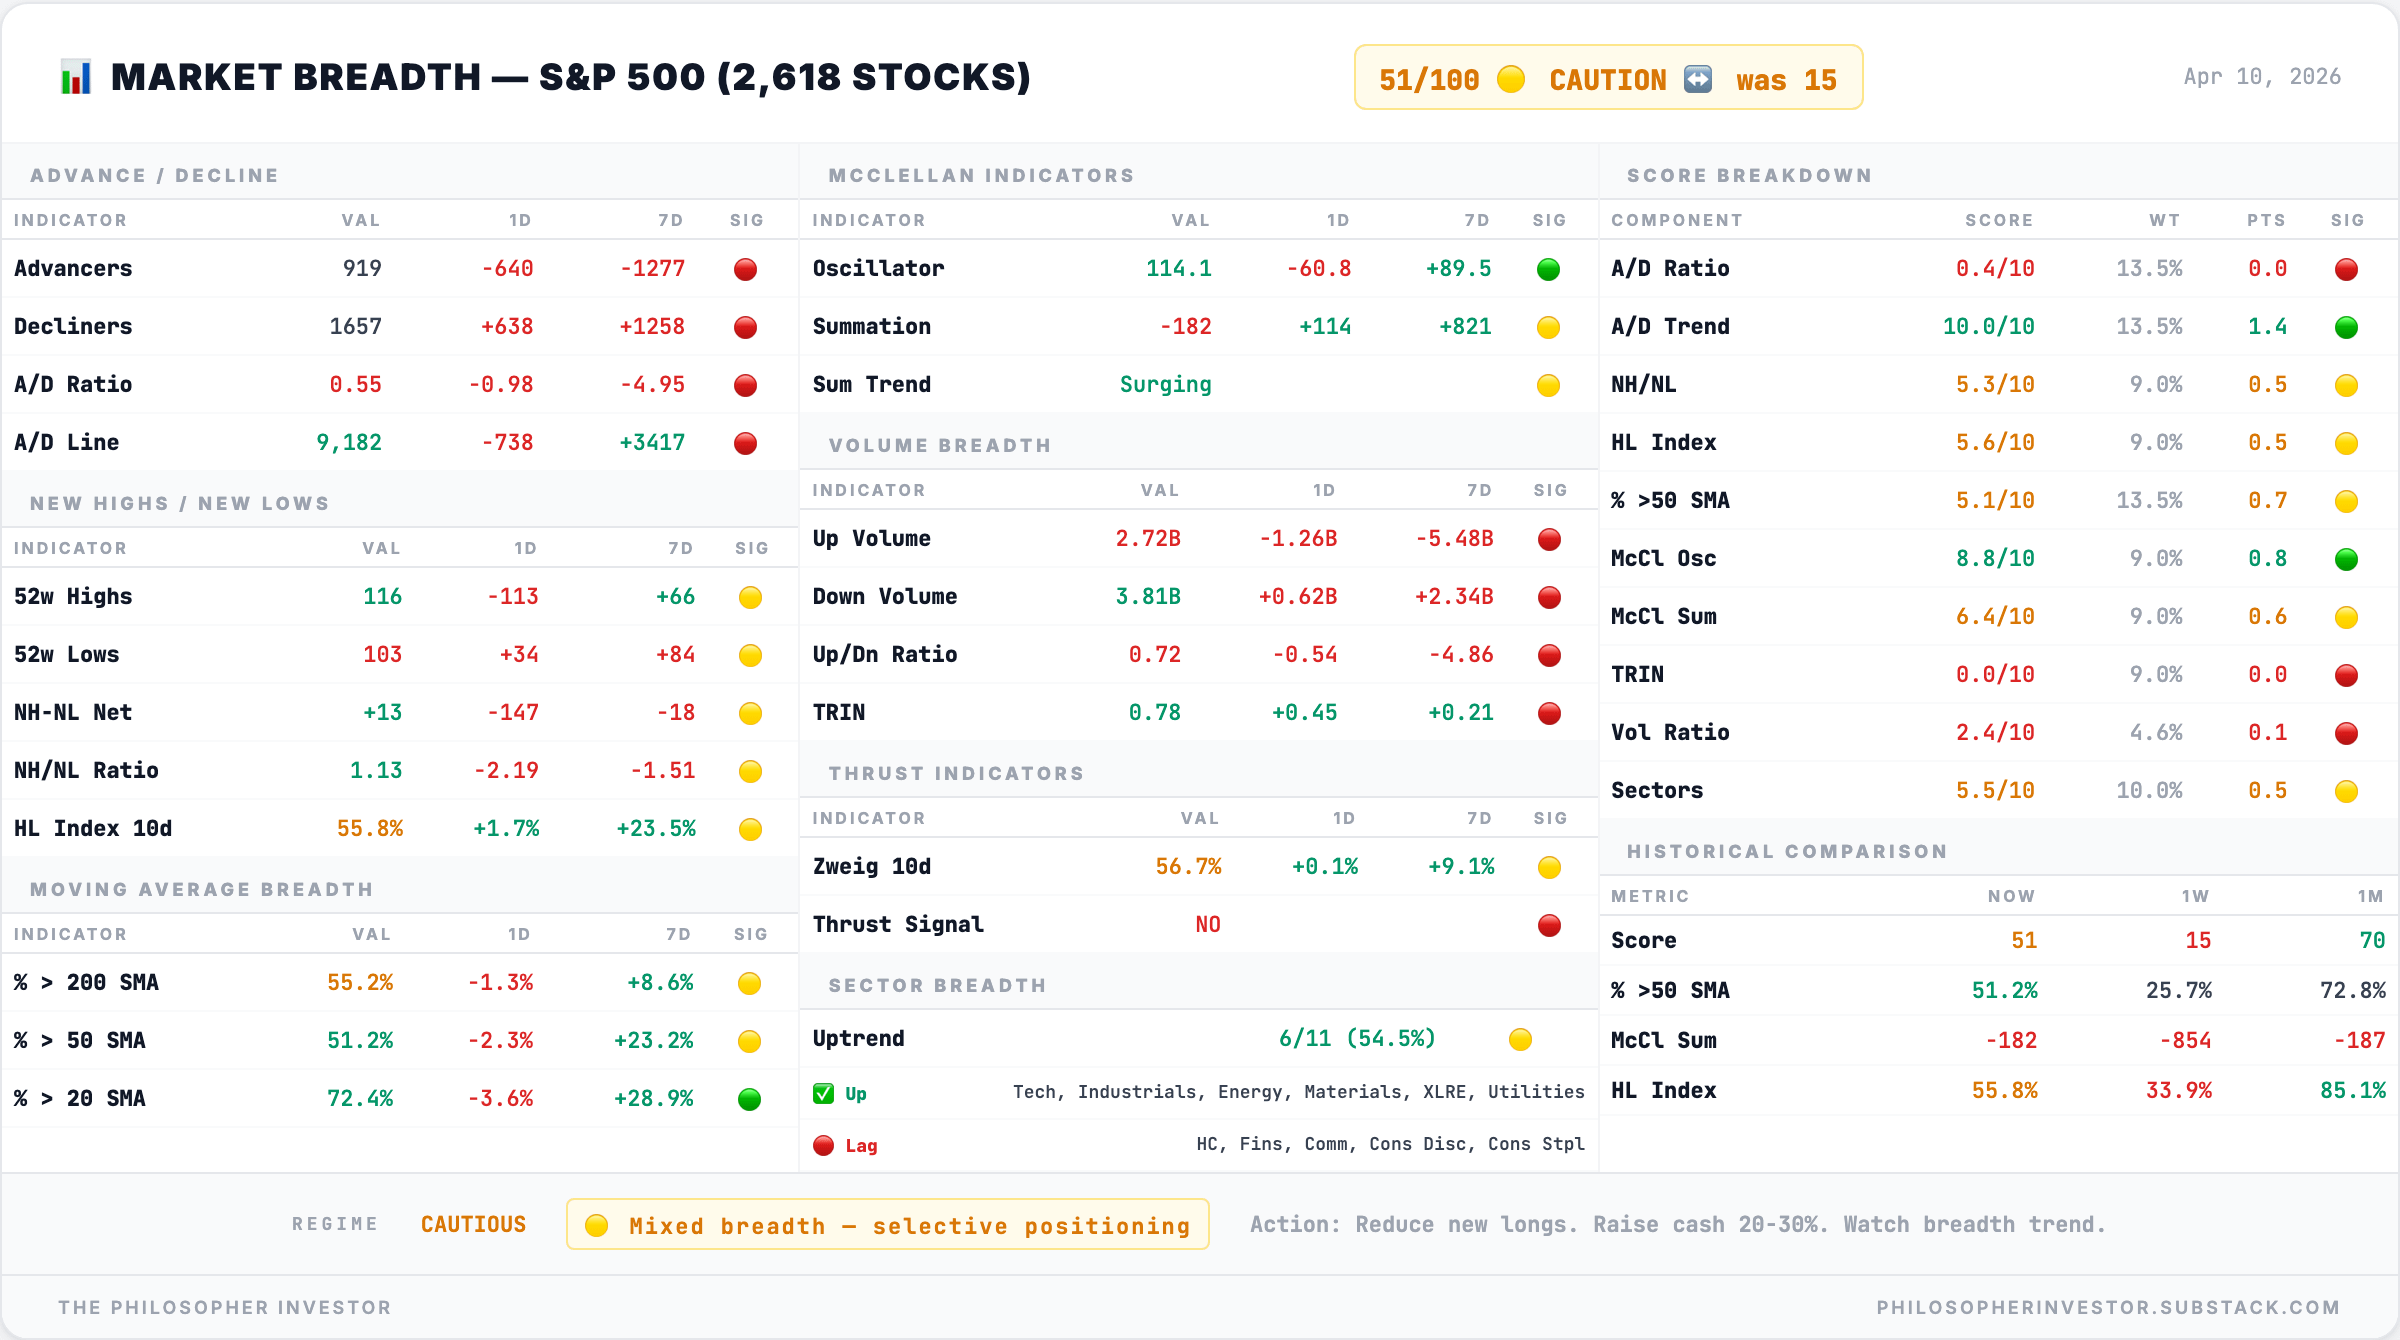
Same thing it said last week: Utilities and Energy are the only sectors with LEADING status. Everything else is WEAKENING or LAGGING.
Utilities (XLU) surged to 80.56% breadth, the highest of any sector by a wide margin. Last week I was wrong to doubt them. They gained ground again. The AI datacenter power buildout plus dividends plus zero import exposure makes Utilities the sector that wins regardless of what happens with Iran, tariffs, or the Fed.
Energy (XLE) sits at 72.85%, down from 84% two weeks ago but still firmly leading. Oil crashed from $111 to $92 on the ceasefire, then bounced back to $97 as Hormuz remained contested. Domestic producers are insulated. They pump and sell on American soil while the rest of the world scrambles.
Financials (XLF) at 59.42% improved sharply from 28% two weeks ago. JEF in my portfolio is up +14.4% since entry. The rate environment (no cuts coming, possibly hikes) helps net interest margins.
The middle of the pack is crowded. Materials (XLB) at 57.45%, Industrials (XLI) at 52.03%, Real Estate (XLRE) at 50.90%, Communication (XLC) at 50.00%. All WEAKENING. All hovering right around the 50% line. This is a market that cannot decide what it wants to be.
The bottom of the table tells the real story:
Technology (XLK): 42.29% — WEAKENING. Nearly six out of ten tech stocks below their 50-day average during a week the Nasdaq gained 4.46%. The rally was NVDA, AAPL, MSFT. Not tech broadly.
Consumer Discretionary (XLY): 41.44% — WEAKENING
Healthcare (XLV): 36.84% — LAGGING
Consumer Staples (XLP): ~36% — LAGGING
Healthcare lagging while utilities lead is contradictory. Both are defensive. Why is one leading and the other lagging? The answer is import exposure. Pharma imports raw materials. Utilities do not.
🔍 Alignment Score: 85/100 — HEALTHY
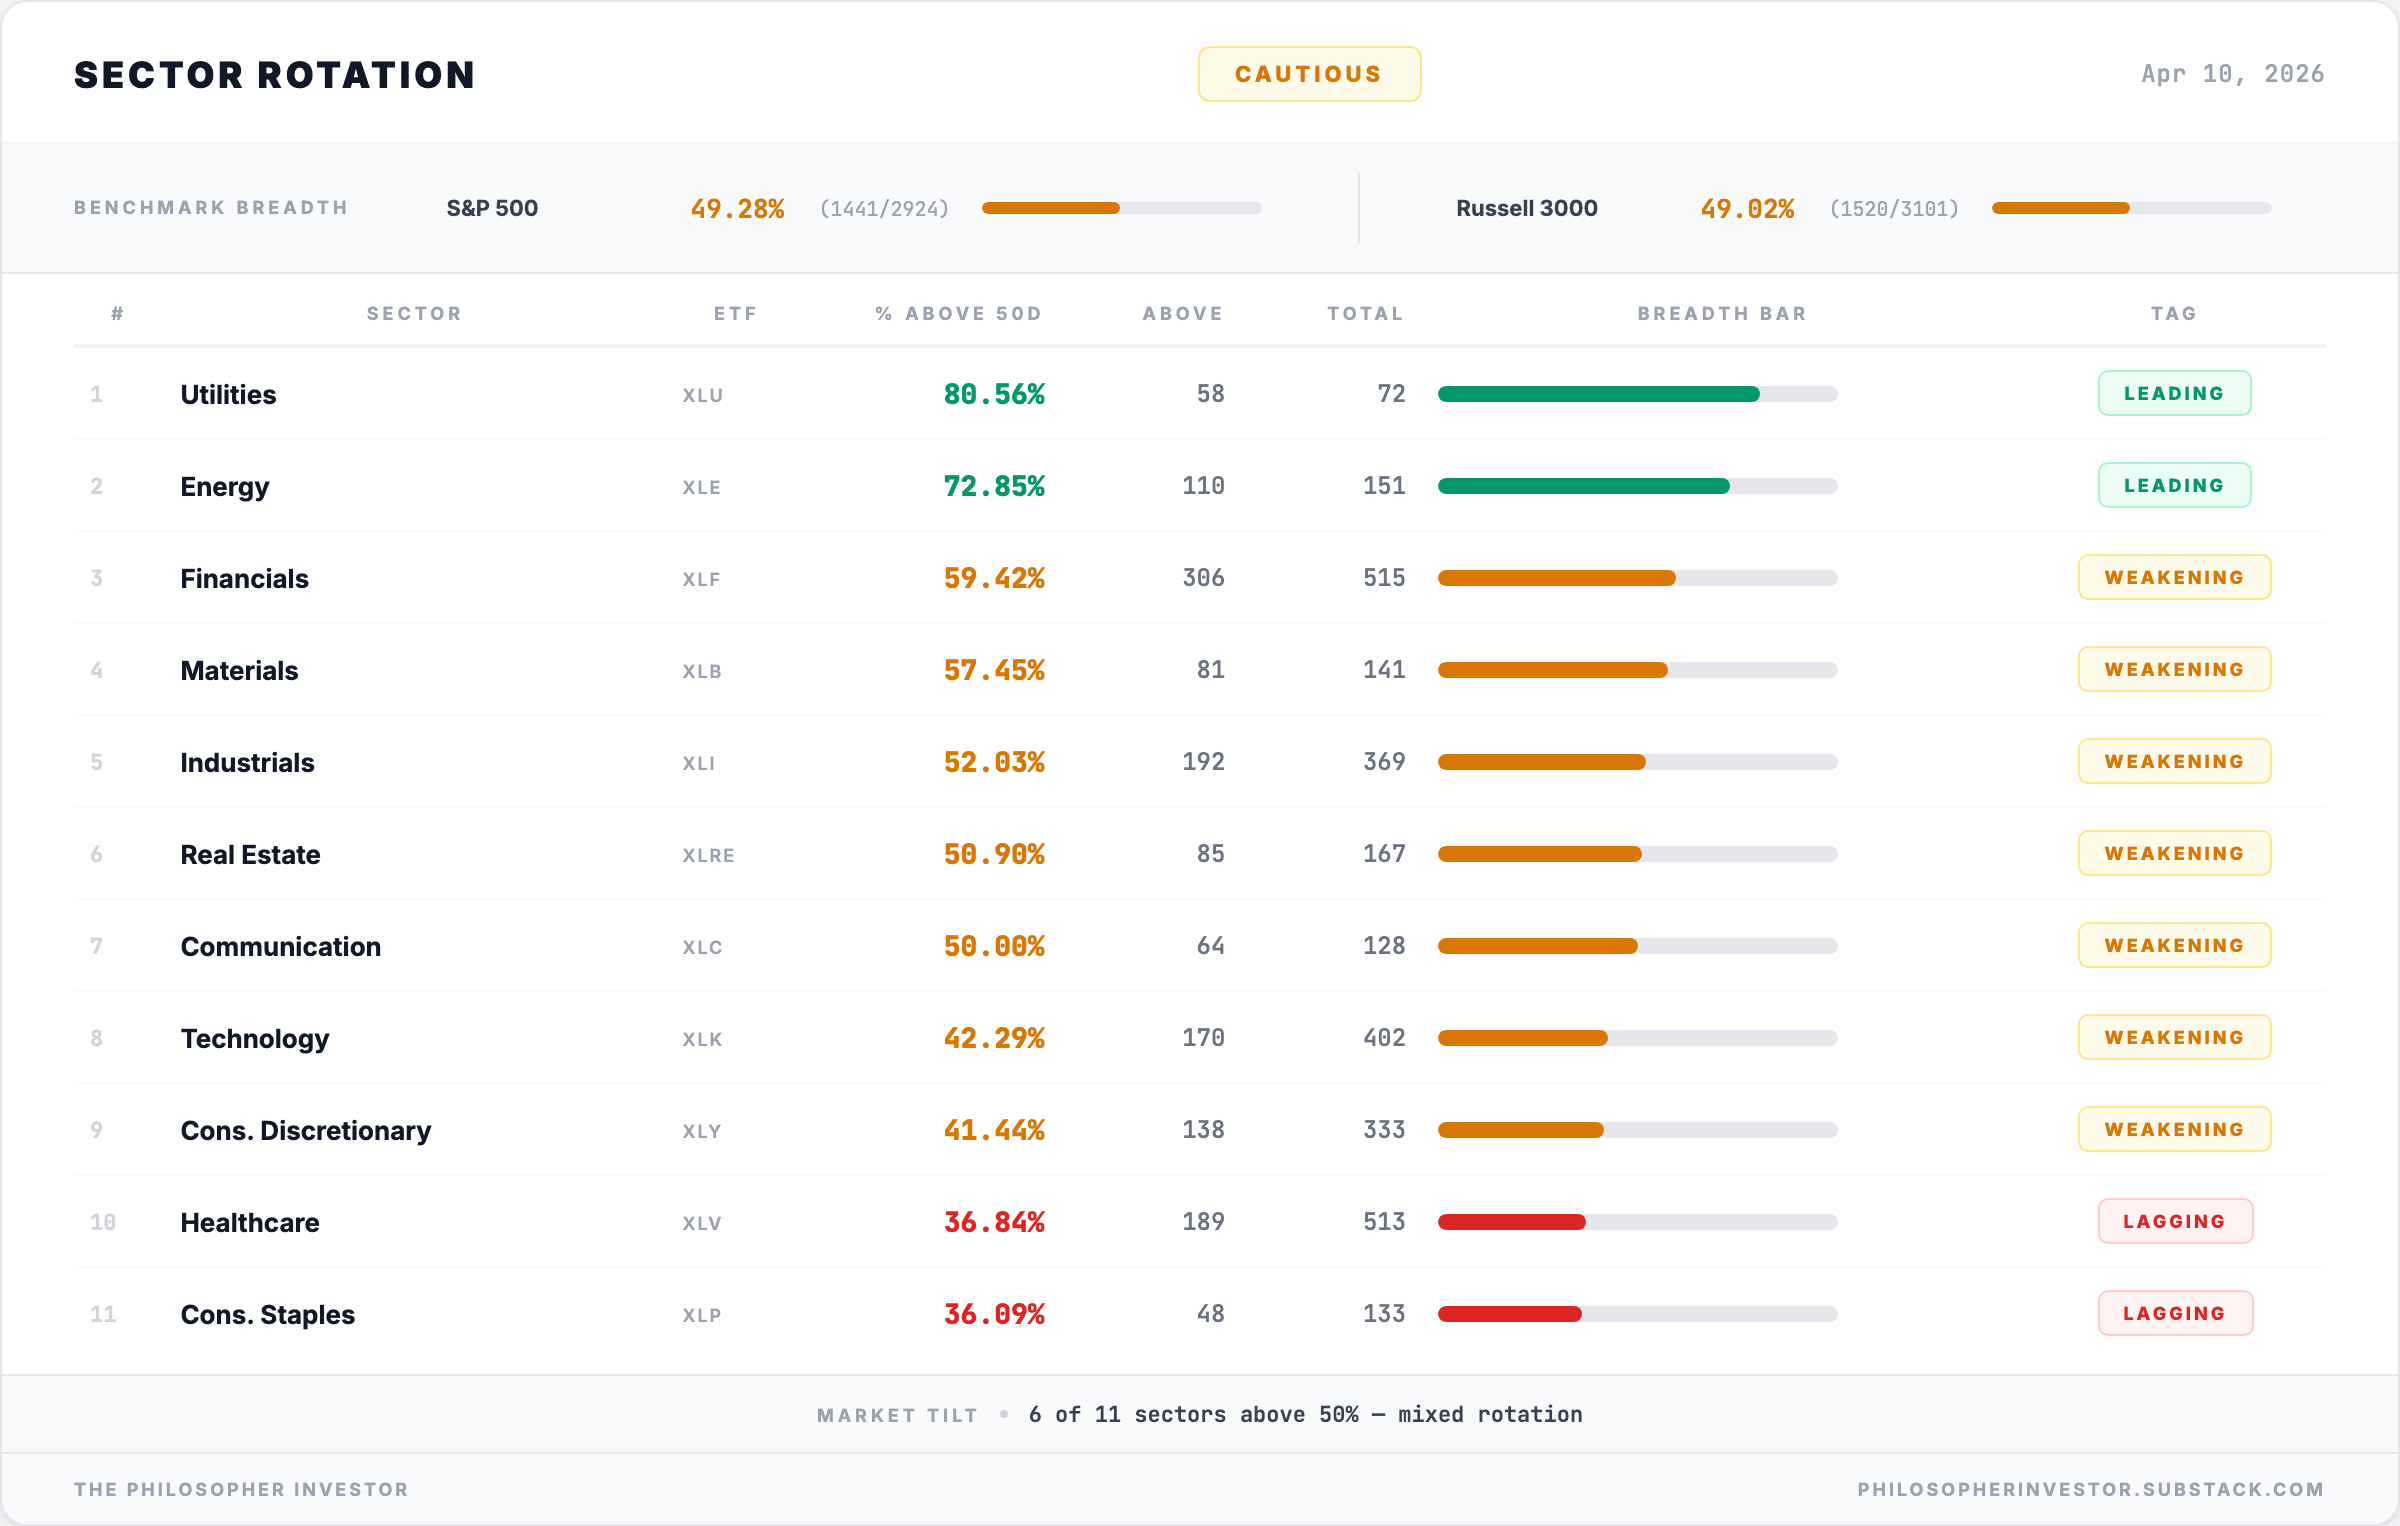
This is the biggest improvement in my divergence dashboard in weeks. The score jumped from 35 last week to 85/100. Seven of eight pairs are now ALIGNED. Only one divergence remains.
Remember two weeks ago when I flagged large caps vs small caps and discretionary vs staples as persistent divergences, both in their fourth consecutive week? Both have resolved.
Large caps vs small caps (QQQ vs IWM). Z-score at -0.65, ALIGNED and narrowing. Last week this was at -1.15. The week before, -1.94. The extreme small cap outperformance from the tariff shock has normalized. Size balance is restored.
Discretionary vs staples (XLY vs XLP). Z-score at -0.52, ALIGNED and narrowing. The consumer rotation signal I flagged for four straight weeks has unwound. Consumers are not yet rushing back to discretionary spending, but the panic rotation into staples has stopped.
Stocks vs bonds (SPY vs TLT). Z-score at +0.69, ALIGNED and narrowing. Bonds and equities are moving in the same direction. No intermarket stress here.
Stocks vs copper (SPY vs CPER). Z-score at -0.63, ALIGNED and narrowing. Copper and equities moving together during a recovery is constructive. The real economy is confirming the equity move.
Stocks vs dollar (SPY vs UUP). Z-score at -0.24, ALIGNED and narrowing. Dollar weakness is supporting equities. No tension.
The one divergence that remains, and the new one to watch:
QQQ vs QQQE (Nasdaq 100 vs Nasdaq Equal-Weight). Z-score at +1.90, DIVERGING and widening. This is the only pair flashing orange, and it is new this week. The Nasdaq 100 is outperforming its own equal-weight version by nearly two standard deviations. Translation: the mega-caps are pulling away from the average Nasdaq stock. The rally is concentrated at the top. The seven-day change of +3.41 means this divergence is accelerating.
This is the divergence dashboard putting a number on the concentration. A z-score of +1.90 widening at +3.41 over seven days means the gap between mega-cap Nasdaq and the average Nasdaq stock is accelerating, not stabilizing. Worth monitoring into earnings.
Everything else is aligned. The macro pairs, the sector pairs, the size pairs. All moving together. The stress from the six-week selloff has unwound almost entirely. The only tension left is the mega-cap concentration. And that is a structural feature of this market, not a crisis signal.
📉 Volatility: VIX 19.23– Down 19.4% – Calm Returns Despite Unresolved Risks
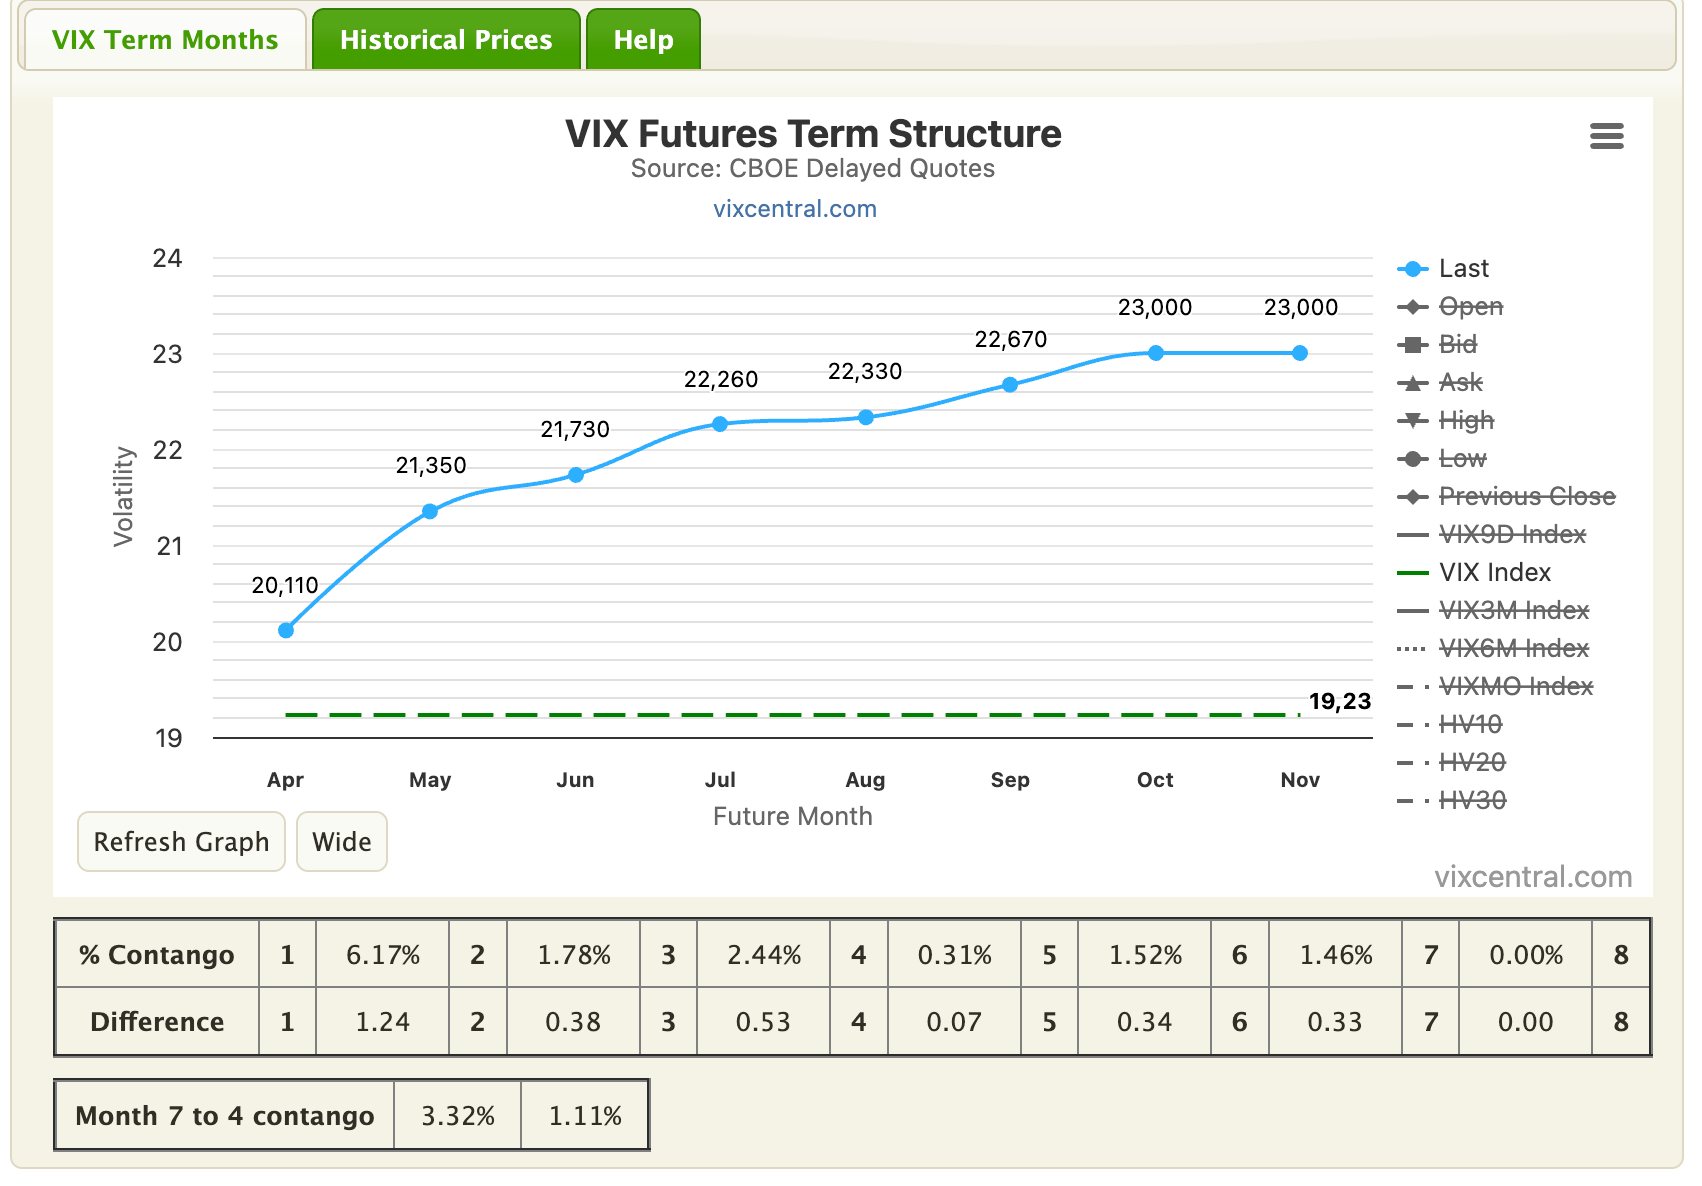
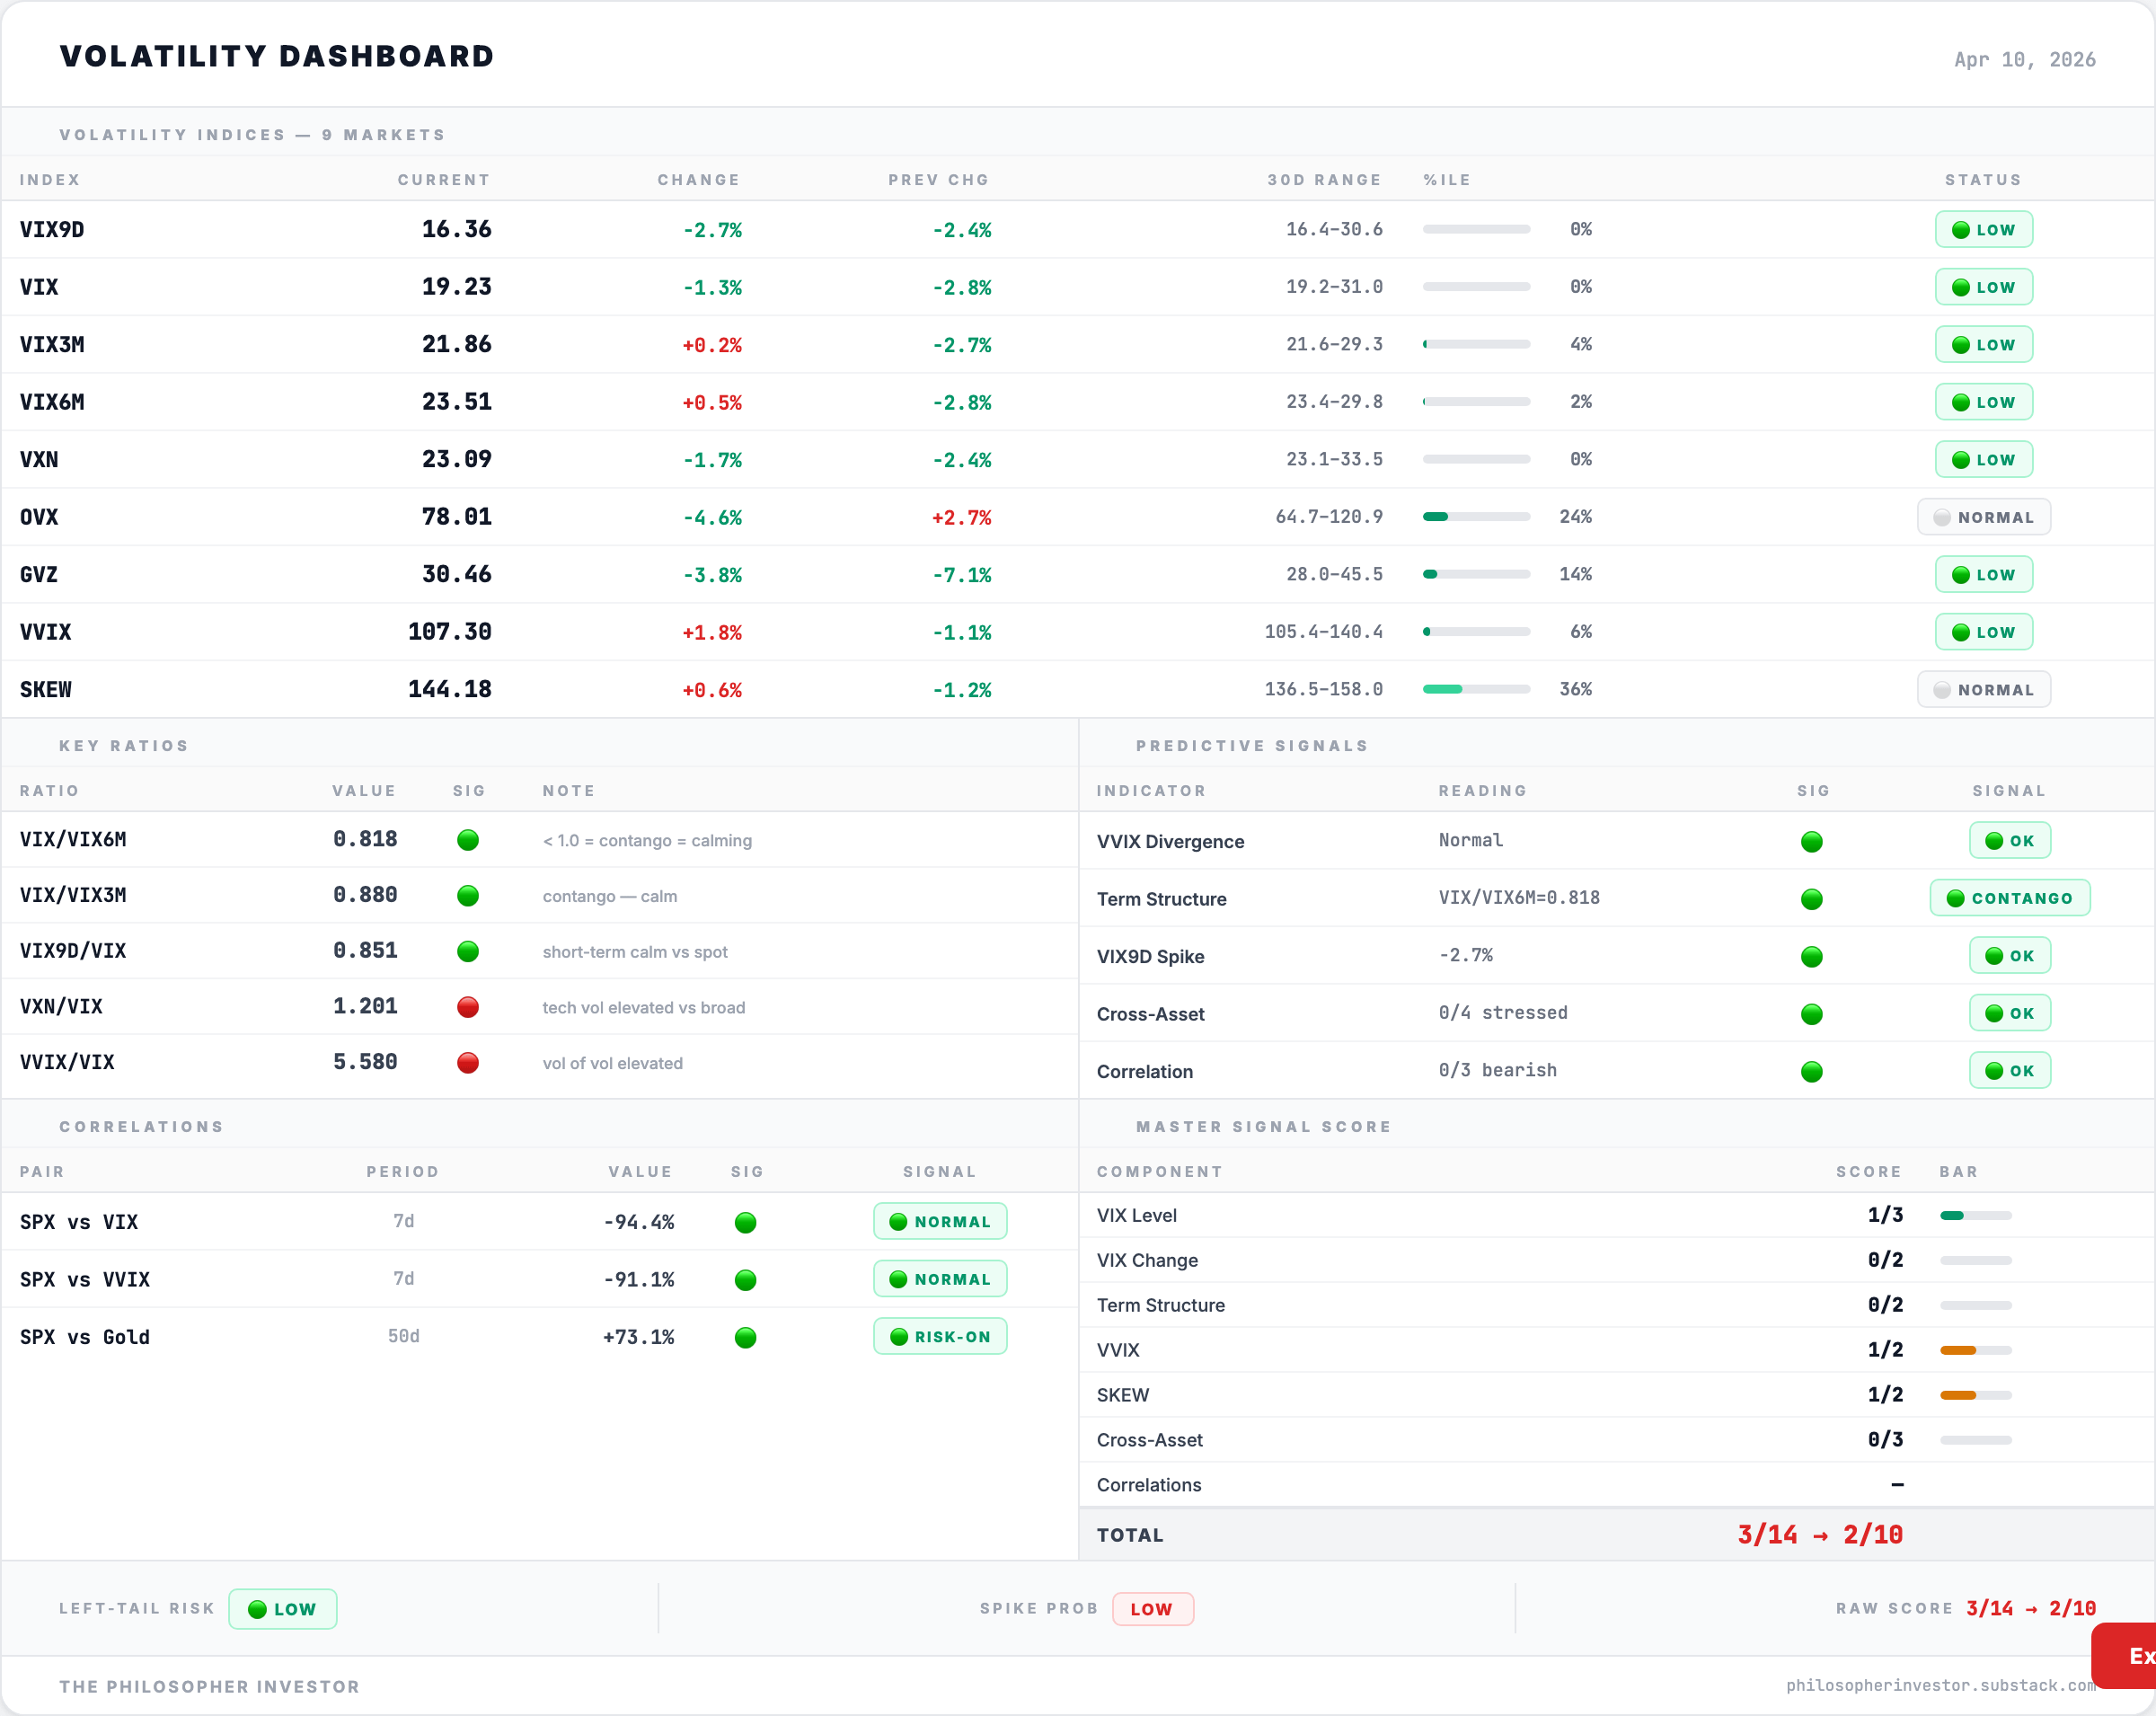
The fear gauge dropped -19.4% in a single week. From 23.87 to 19.23. That is the largest weekly VIX decline since the post-Liberation Day reversal in April 2025.
Every volatility index is flashing green:
VIX9D at 16.36 — short-term fear has evaporated
VIX3M at 21.86 — medium-term calm
VIX6M at 23.51 — long-term expectations normalizing
VVIX (the volatility of the VIX itself, measuring how erratically fear moves) at 107.30 — unremarkable
OVX (oil volatility) at 78.01, down from 93 last week — oil fear receding despite Hormuz uncertainty
The term structure is in full contango (short-term VIX below long-term VIX, the normal pattern of a calm market): VIX9D (16.36) < VIX (19.23) < VIX3M (21.86) < VIX6M (23.51). No inversion anywhere.
VIX/VIX6M ratio at 0.818 — deep contango. VXN/VIX (Nasdaq volatility relative to broad market volatility) at 1.201. Nasdaq vol still 20% higher than broad market vol. Tech remains the most volatile part of the market.
SKEW (a measure of demand for deep out-of-the-money puts, essentially tail risk insurance) at 144.18, down from 147 last week. Institutions are removing some of their crash protection. A sign they are less worried about a left-tail event.
One week ago VIX was at 24 and I told you institutions had pre-hedged all quarter. The ceasefire confirmed their positioning was correct. They had the protection in place, the event passed without a crash, and now they are quietly unwinding. VIX below 20 in the context of an unresolved oil crisis and a hawkish Fed is remarkably calm.
💱 FX Signal: Mixed Dollar
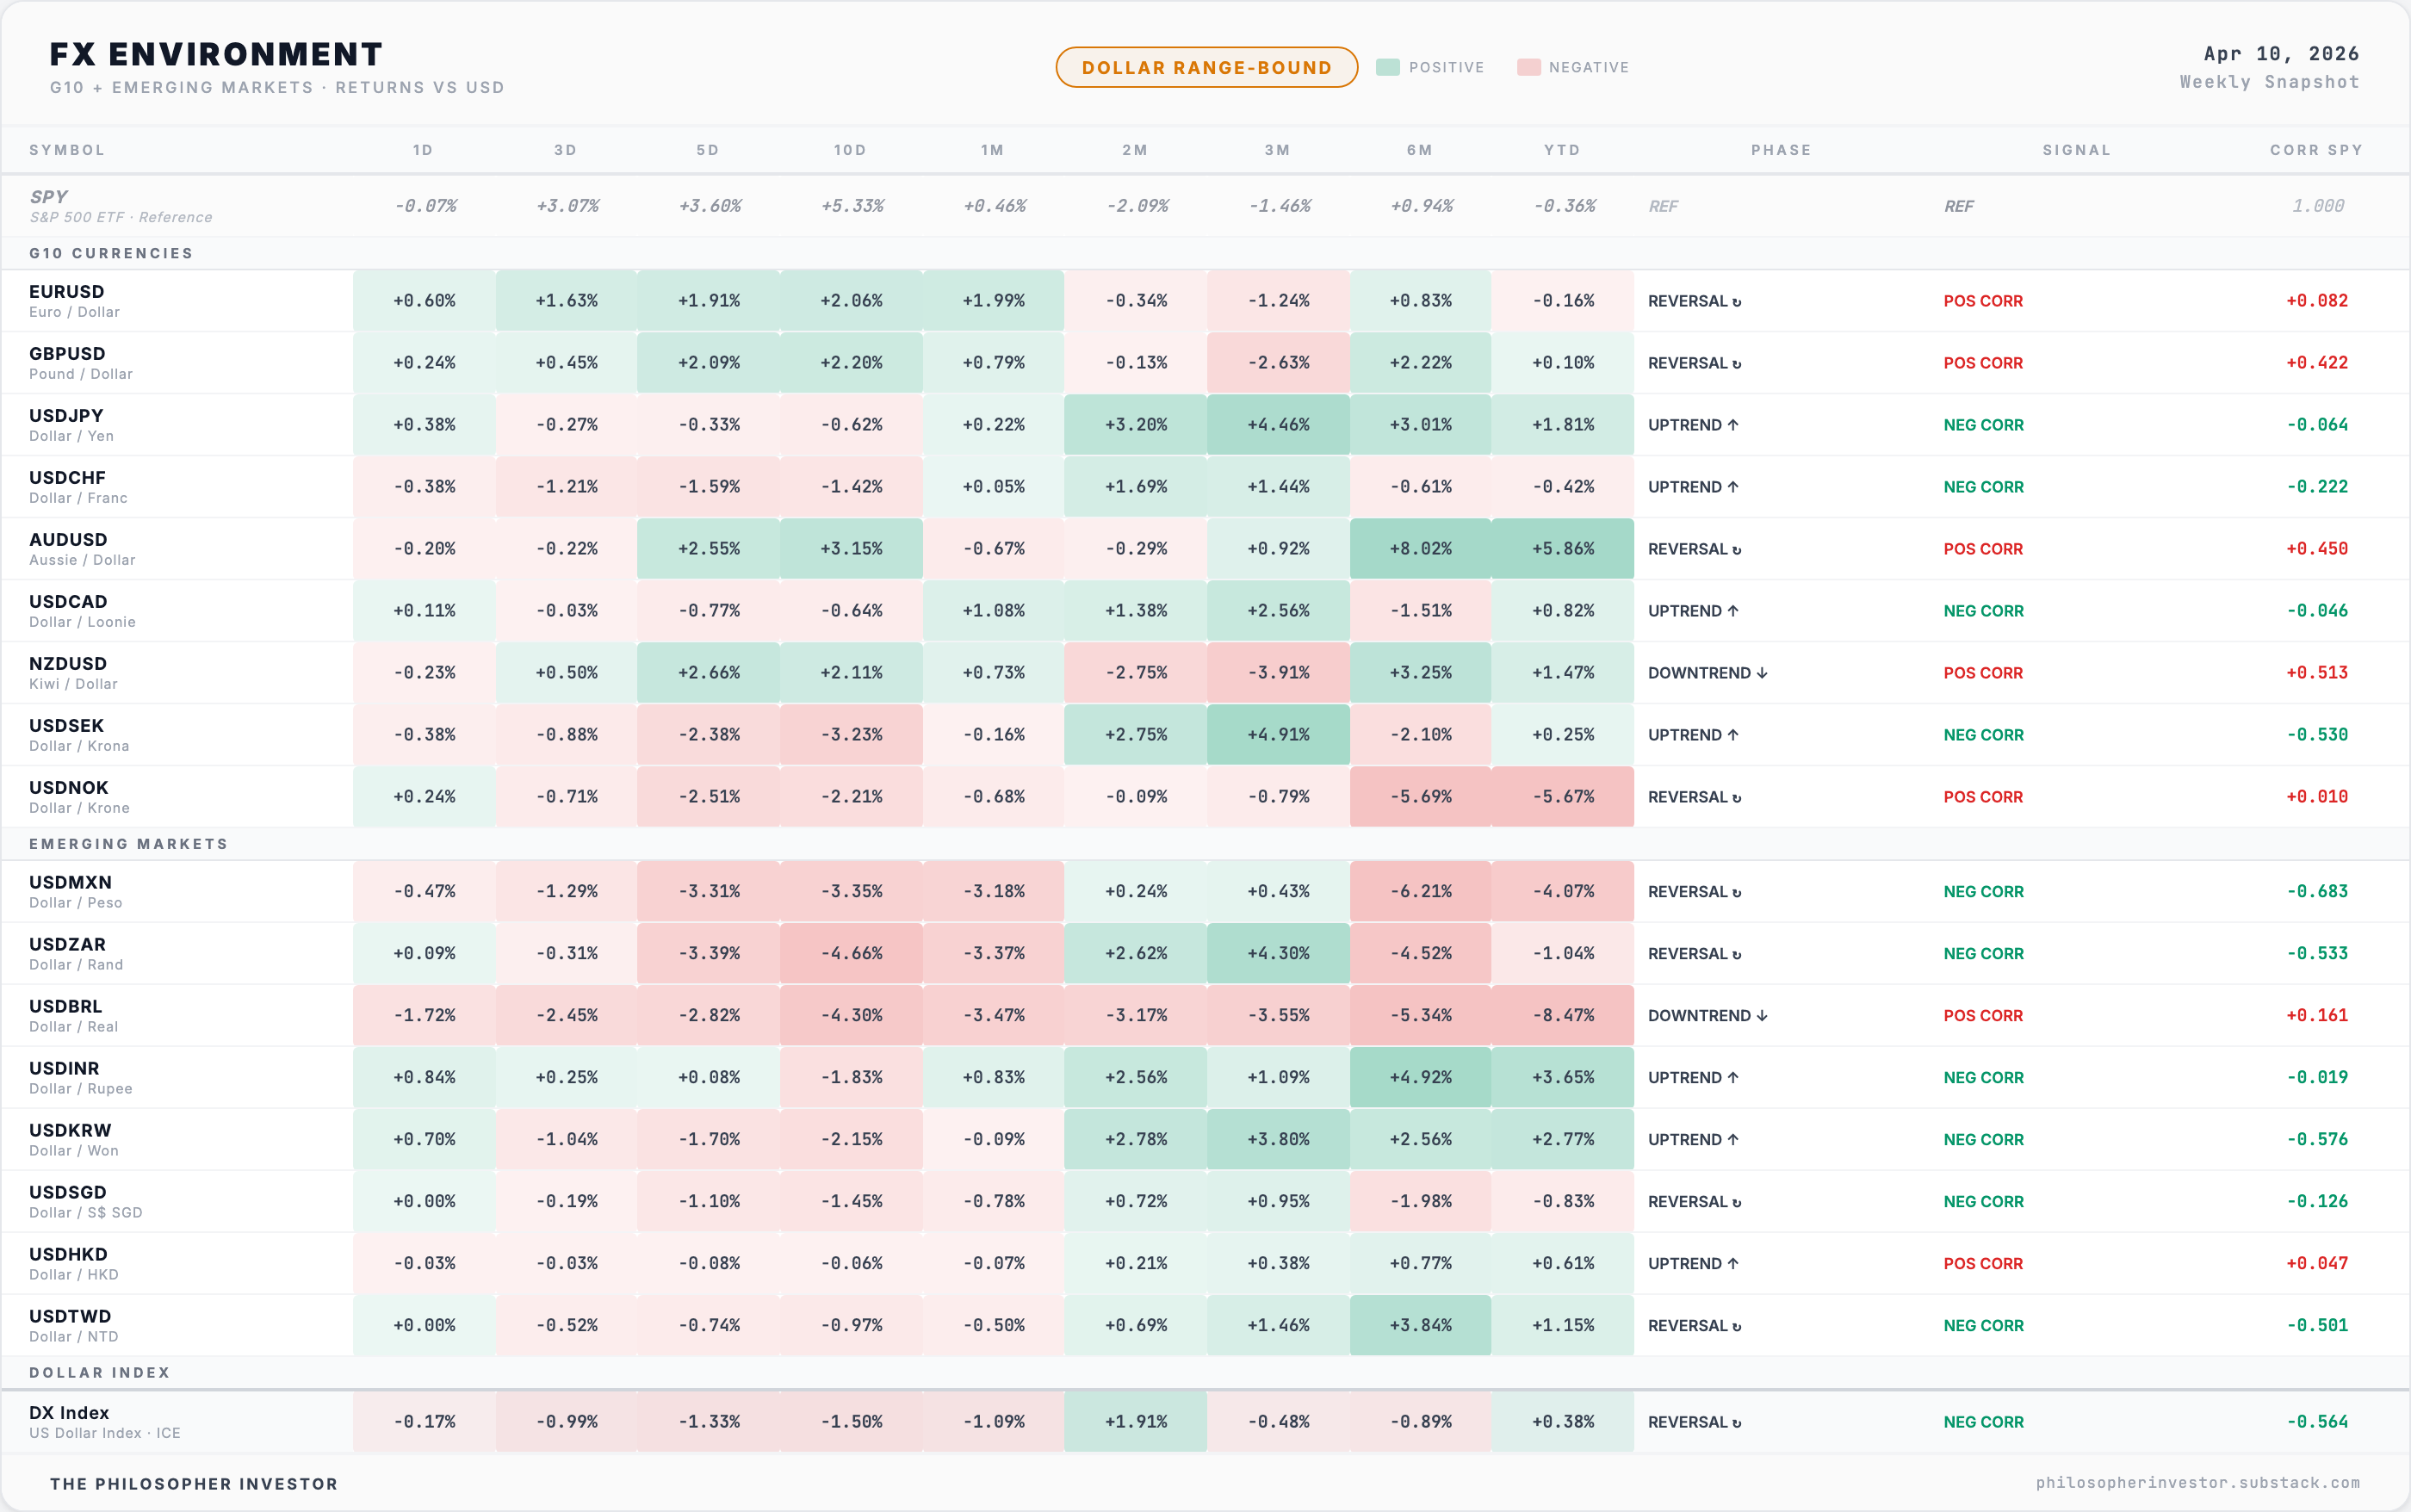
The FX dashboard flipped to DOLLAR RANGE-BOUND this week. Last week I described active dollar weakening. This week the picture is more nuanced.
The headline: SPY is up +5.33% over 10 days and +3.07% over 3 days. The dollar has weakened against most G10 currencies over the past week, but is showing strength on longer timeframes against several emerging market currencies. The direction is mixed, not trending.
EUR/USD gained +1.91% over 5 days, now in a REVERSAL phase with positive correlation to SPY (+0.082). The ceasefire reduced the dollar’s safe-haven bid. GBP/USD up +2.09% over 5 days, also reversing lower dollar. Both confirming the risk-on tone.
USD/JPY is the number to watch. It is in an UPTREND with negative correlation to SPY (-0.064). Over 3 months, the dollar has gained +4.46% against the yen. Over 6 months, +3.01%. The yen keeps weakening. The Bank of Japan meets April 27-28. An ex-BoJ official said this week: “It is time to act.” If USD/JPY drops sharply toward 145-150, the carry trade (borrowing in cheap yen to buy higher-yielding assets) unwinds and VIX spikes regardless of everything else. Last time this happened, August 2024, VIX jumped from 23 to 65 intraday.
AUD/USD surged +3.15% over 10 days and +5.86% YTD — the risk-on currency trade. Australia exports commodities to China, and a de-escalation in the Middle East is good for global trade flows. Positive correlation to SPY at +0.450.
Emerging markets tell a split story. USD/MXN down -3.35% over 10 days (peso strengthening, risk-on). USD/BRL down -4.30% over 10 days and -8.47% YTD (Brazilian real surging, in a downtrend). But USD/INR and USD/KRW are both in uptrends, dollar strengthening against Asian currencies. The ceasefire trade is lifting Latin America more than Asia.
🧠 My Take
This was the best week for the S&P since November 2025. And the breadth score did not move. That disconnect is the entire story.
The ceasefire trade was mechanical. When Trump announced the pause, algorithms bought the dip, oil crashed, and everything that had been beaten down surged. Financials bounced +11.7% breadth the week before. Industrials led this week at +5.2%. The most oversold names snapped back hardest. That is short covering and mean reversion, not conviction.
The proof is in the breadth. If this rally had legs, we would see the percentage of stocks above their 50-day moving average expand. It contracted. We would see new highs surge. We got 116, barely above the 103 new lows. We would see a Zweig thrust signal. We did not.
The Alignment Score offers a counterpoint. At 85/100, almost every intermarket pair is moving in sync. The stress from the six-week selloff has unwound. Bonds, copper, the dollar, large vs small, discretionary vs staples: all confirming the same direction. The only fracture is QQQ vs QQQE, mega-cap concentration, and that is structural, not cyclical. The plumbing is clean even if the flow is narrow at the top.
My bias for the week is cautiously long with a short leash. I stay in my positions, I add IVZ, and every trade has a defined stop. The ceasefire bought time, not certainty. I want to be positioned for the grind higher while respecting the fact that half the market is not participating yet.
Four scenarios for April 13-17:
Grinding consolidation (35%). SPY churns between 575-585. Market digests the CPI, the FOMC hawkishness, and waits for more earnings data. VIX stays in the 18-21 range. Most likely because the ceasefire removed the immediate catalyst but changed nothing structurally.
Ceasefire holds, earnings launch well (30%). JPMorgan and Netflix report this week. If earnings come in solid and the ceasefire holds through the weekend, SPY pushes toward 590. The rally extends but breadth needs to confirm.
Hormuz re-escalation (20%). Iran breaks the ceasefire terms or the US responds to the toll regime. Oil spikes back above $105. VIX back above 25. The ceasefire trade unwinds.
Earnings disappoint + hawkish Fed rhetoric (15%). JPMorgan misses or guides down on credit quality. The “two-sided” policy language from the FOMC minutes gets amplified. SPY back to 565.
Overlay risk (any scenario): BoJ April 27-28. Two weeks away. USD/JPY in an uptrend. If it breaks 155, everything changes.
🔥 Trade of the Week: IVZ (Invesco)
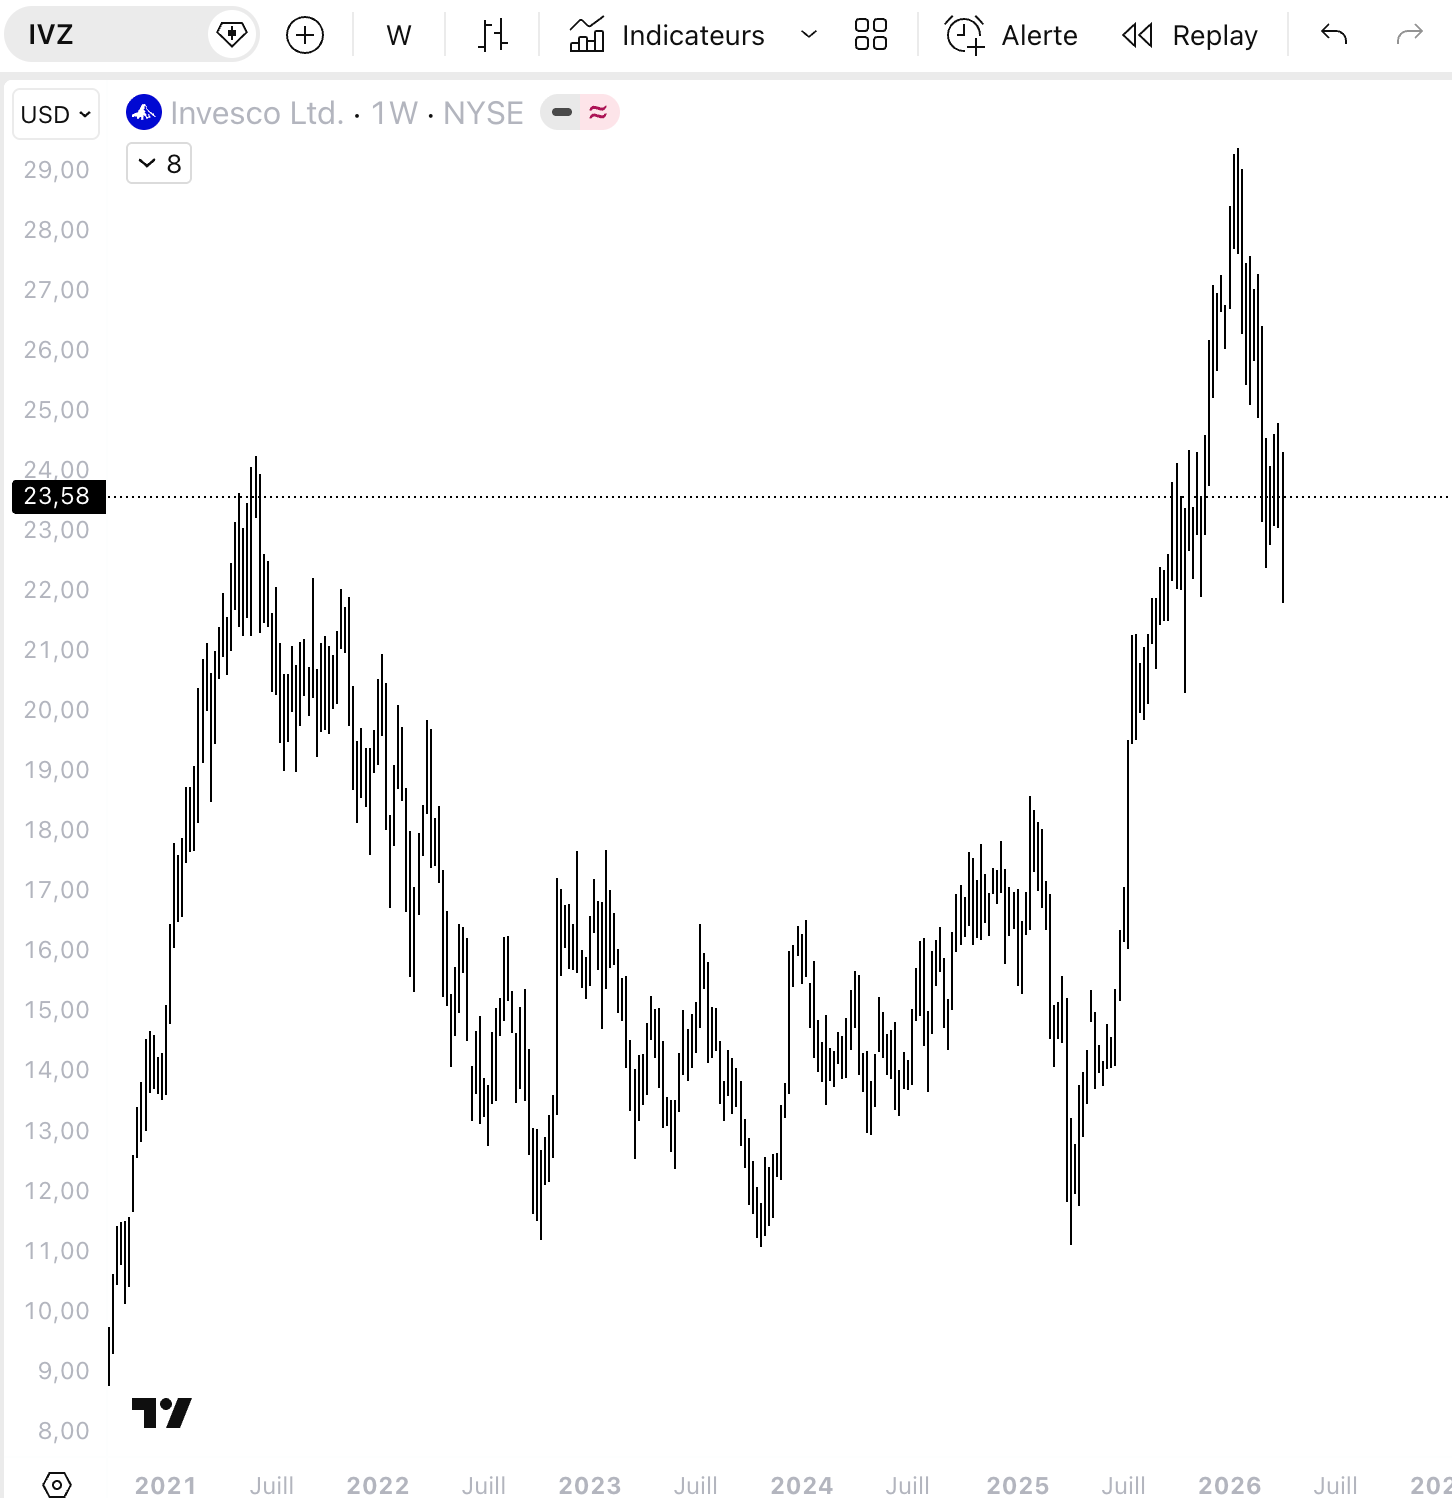
At $23.58, Invesco is the highest-confluence signal in my system this week. Five of my independent screeners fired simultaneously. I have not seen this level of agreement on a single financial stock since the breadth recovery began.
The thesis. Invesco manages $1.8 trillion in assets. When markets rally, AUM grows, and fee revenue grows with it. The financial sector just experienced the most violent breadth recovery in my data, from 16% to 59% in two weeks. JEF in my portfolio is up +14.4% riding that wave. IVZ is the same trade, earlier in the cycle.
Why now. Look at the weekly chart. IVZ broke above $23 in mid-2025 after years of consolidation in the $12-18 range. It ran to $29 in January 2026, pulled back during the six-week tariff selloff, and is now retesting that breakout zone at $23.50. This is the classic pattern: resistance becomes support. The stock is sitting on the exact level where it broke out, asking the market one question: was the breakout real?
The rate environment helps. FOMC minutes this week revealed some participants pushing for “two-sided” policy language, reintroducing the possibility of rate hikes. For most sectors, that is bearish. For asset managers, higher rates mean higher money market yields, which attract inflows. Invesco’s ETF business, including the massive QQQ franchise, benefits directly from risk-on flows into equities. The ceasefire trade is exactly the kind of catalyst that drives ETF inflows.
The math.
Entry zone: $23-24 (current level, on breakout support)
Stop: $21 (below the March selloff low and the breakout level. If it loses $21, the breakout has failed)
Target 1: $27 (+15%, mid-range of January move)
Target 2: $29.50 (+25%, retest of January high)
R:R: 1.3:1 on T1, 2.3:1 on T2
Sizing: Standard position, 2% of portfolio
The risk. If the ceasefire collapses and risk-off returns, financial stocks sell first. If the broad market crashes, AUM shrinks and IVZ’s revenue follows. The stop at $21 limits the damage to -11% from current levels. But at 5 screeners firing together and financial breadth at 59% and rising, the probability favors the trade.
🎯 Portfolio Performance
I share entry levels, stops, and targets. I don’t take every position I flag. Position sizes are yours to decide based on your own risk tolerance. This is a model portfolio updated weekly at Friday’s close. My personal positions may differ in timing and sizing.
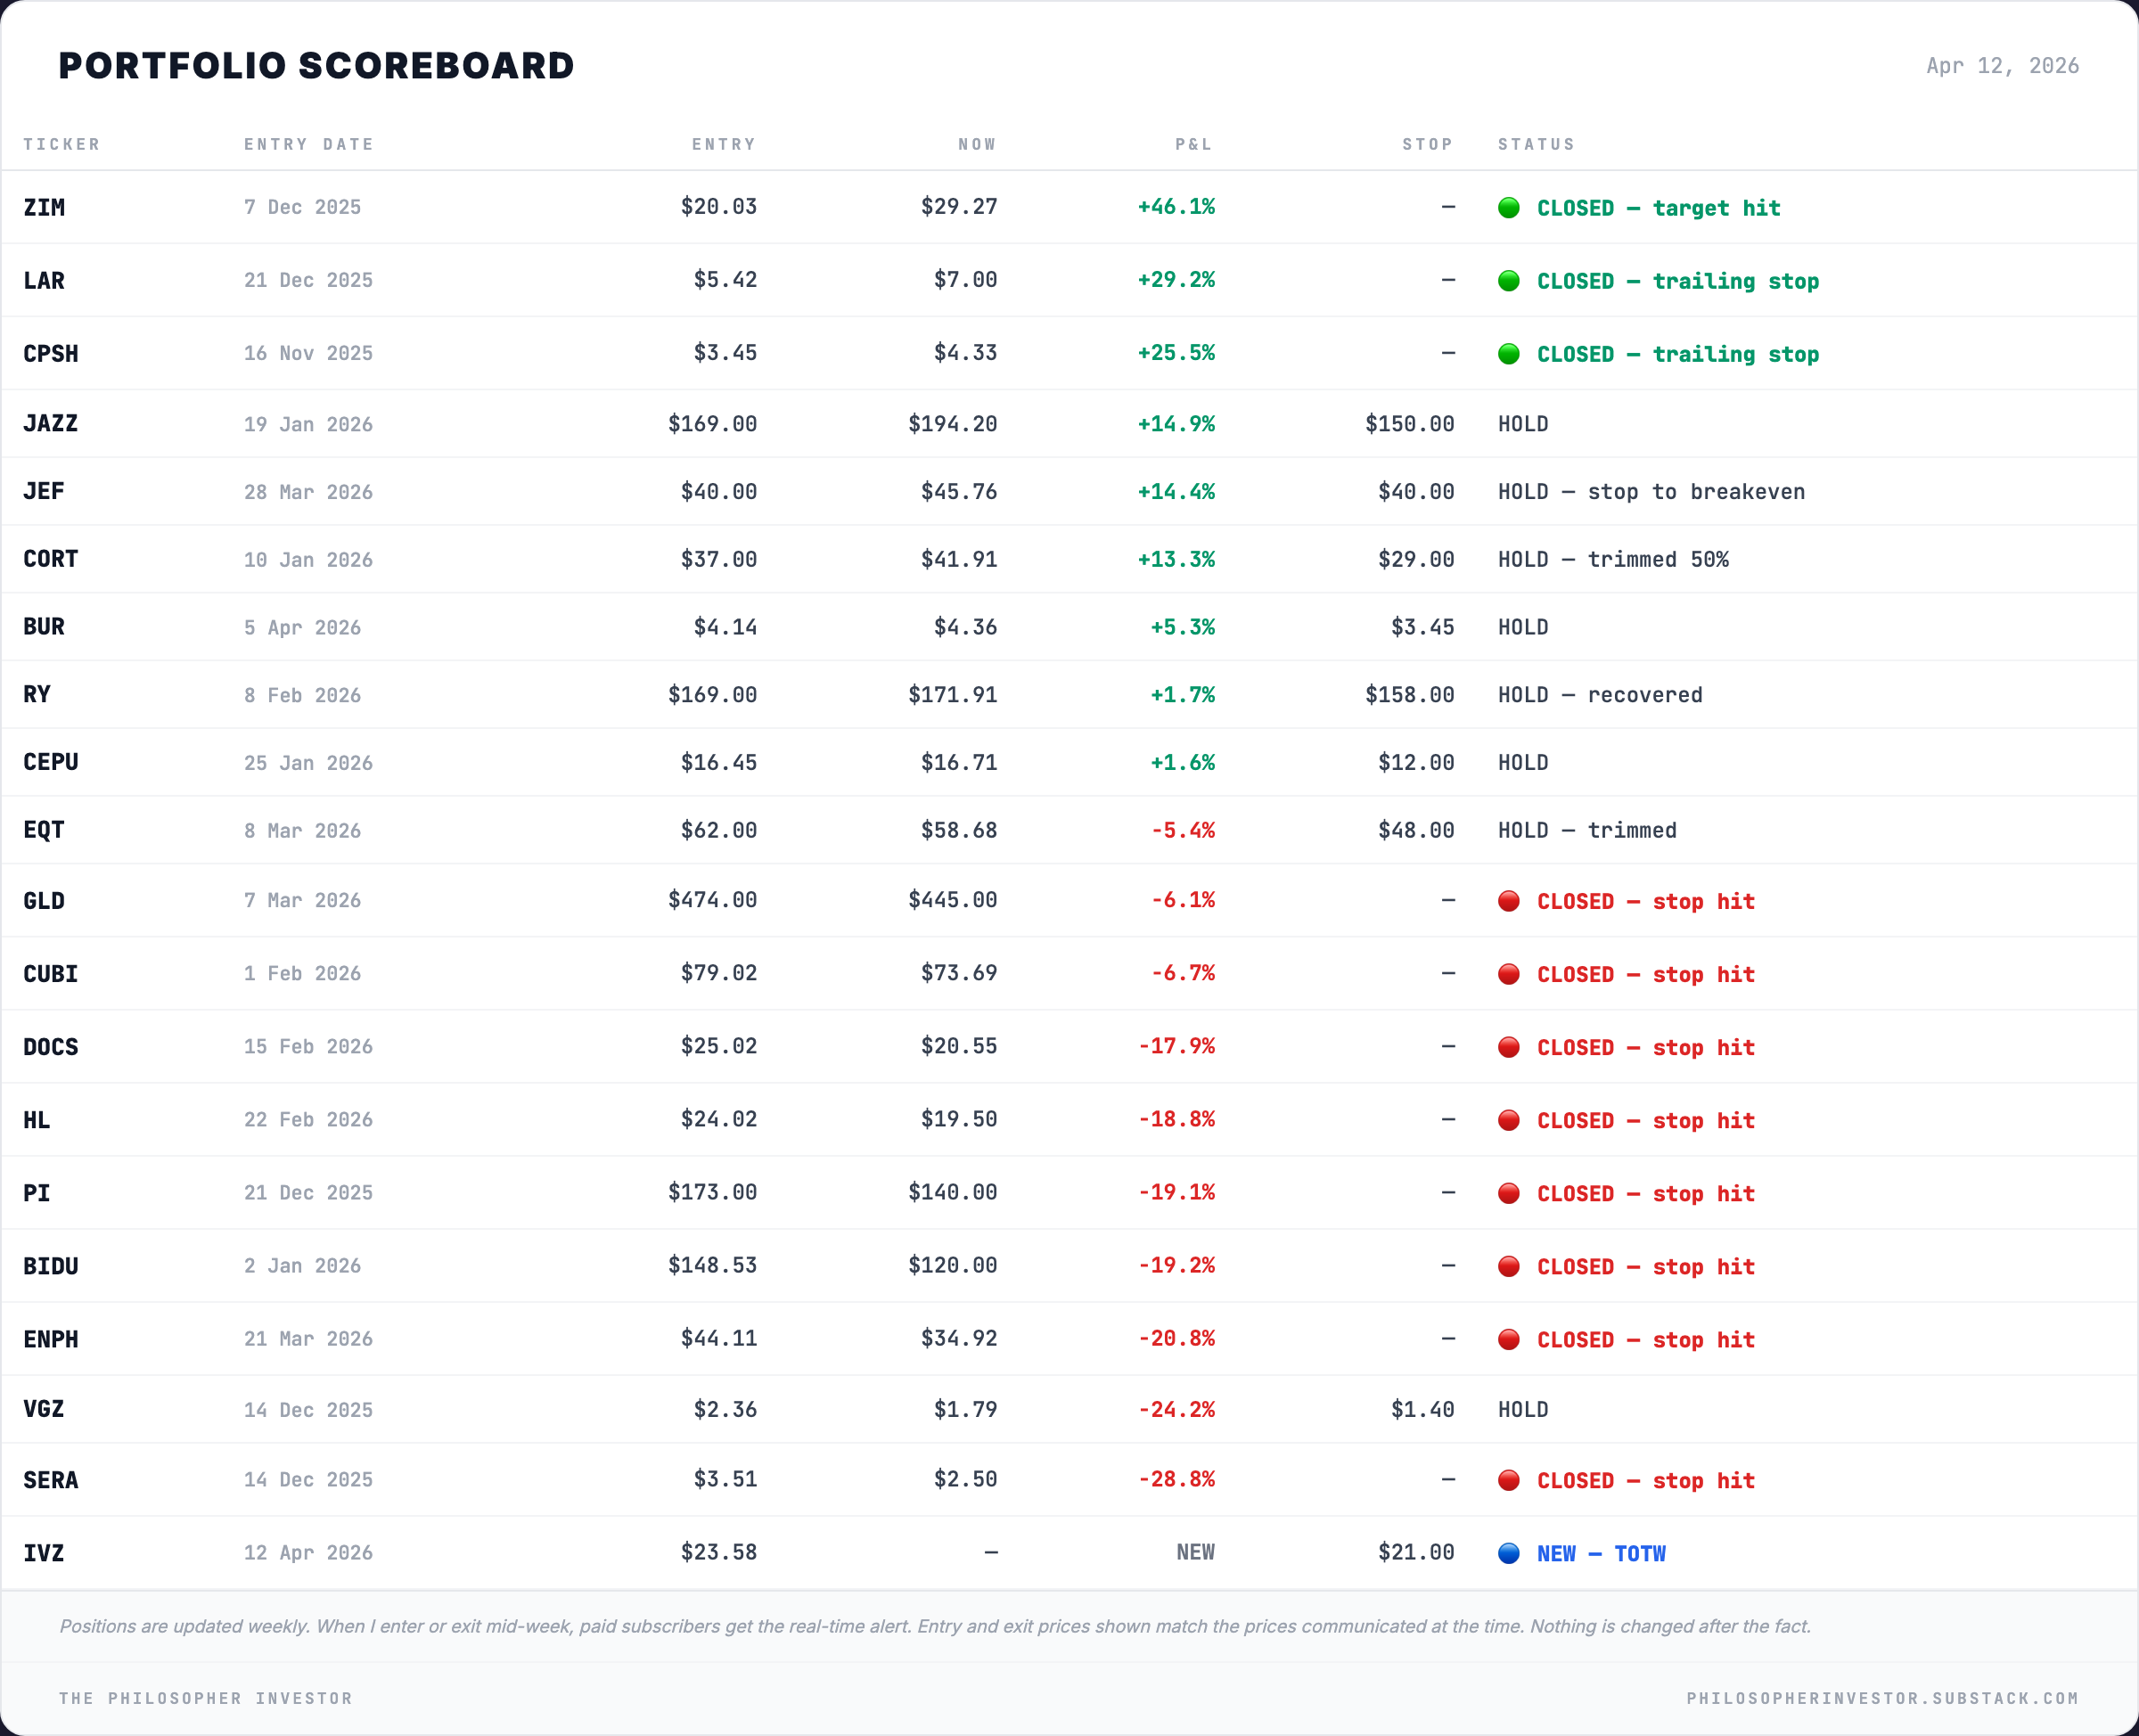
JAZZ is the portfolio anchor. Up +14.9% from the $169 entry with zero correlation to anything macro. Healthcare executing while the world panics about tariffs and bombs. Best position in the book.
JEF had a monster week, +14.4% from the $40 entry. Financial sector breadth recovery from 16% to 59% lifted the entire group. Stop moved to breakeven at $40. Free trade from here.
CORT pulled back slightly from +14.8% to +13.3%. Still quietly compounding. Trimmed 50% two weeks ago, the remaining half runs free.
BUR (last week’s Trade of the Week) up +5.3% from the $4.14 entry. Early but green. Litigation finance continues to be insulated from everything happening in the macro world.
RY recovered from -3.3% to +1.7%. Was twenty-one cents from its stop last week. Financials breadth at 59% breathed life back into it.
CEPU flat at +1.6%, down from +3.7% last week. Holding.
EQT deeper in the red at -5.4%. Trimmed position. The Hormuz premium thesis is fading as oil dropped 9.5% on the ceasefire. (I exited my personal position earlier this week as the thesis weakened. The model portfolio reflects Friday's close)
VGZ still underwater at -24.2%. Holding. Gold at $4,762 is near all-time highs, but the miner refuses to follow. Stop at $1.40 is the line.
Closed this week: DOCS stopped out. Entry $25.02, exit at the $22.50 stop level after the low of $20.55 on Thursday. Loss -17.9%. Last week I flagged it as “$0.27 from stop.” When a stock cannot participate in the best week since November, the thesis is broken. The system worked, the stop did its job.
See you next week.
Disclaimer
This newsletter is for educational and informational purposes only. It is not financial advice.
The content reflects personal opinions shared publicly as a journal. Trading stocks, options, futures, or any financial instrument involves significant risk. You can lose your entire investment. There is no guarantee of profit.
The author is not a registered investment advisor, broker, or financial professional with any regulatory authority including the SEC or CFTC. Always consult a licensed financial advisor before making any investment decisions.
By reading this newsletter, you accept full responsibility for your own trading and investment choices. Past performance does not guarantee future results. Markets are unpredictable.
Screenshots are courtesy of TradingView, VixCentral, and other platforms with which the author has no affiliation. Information shared may contain errors or become outdated quickly.
This content is the intellectual property of the author. Copying or redistributing without permission is prohibited.
By continuing to read, you acknowledge and accept these terms.
Read the desk every week
Market analysis in plain English, plus the app that scans the whole US market for you.
Become a member Read the original on Substack ↗