Trump Gave Iran 48 Hours. The Market Gets Its Answer Monday.
Market Recap — April 5th 2026
2026-04-05 · 15 min read · Originally published on Substack ↗
TL;DR
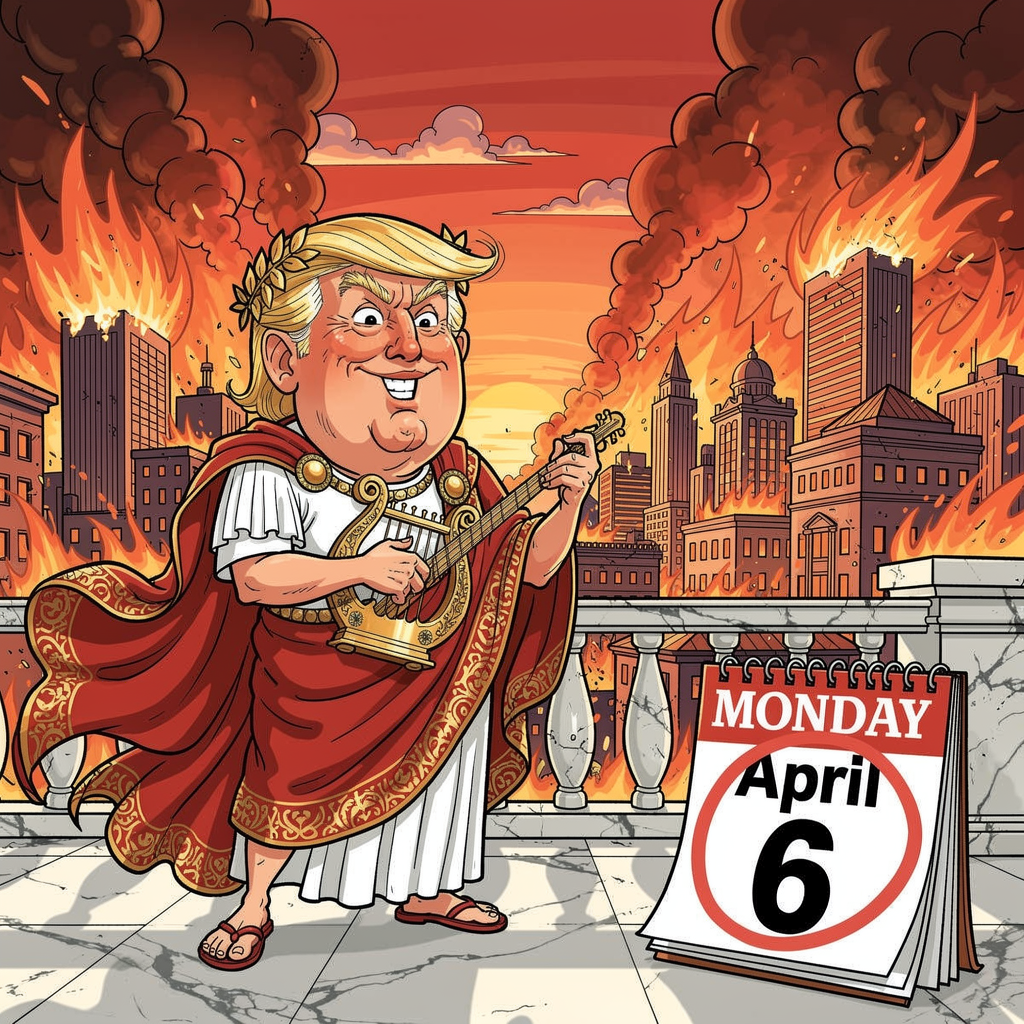
Trump's 48-hour Iran ultimatum on the Strait of Hormuz expires Monday evening. Oil above $100, 20% of global supply at risk, and CPI next week.
Breadth score recovered to 51/100, up from 15 last week. The biggest weekly bounce since October.
VIX dropped to 23.87, down from 31.05 last week. Institutions pre-hedged all quarter.

Hello my friends,
One year ago this week, the administration announced its first “Liberation Day” tariffs. The market fell over 10% in three days. Then a 90-day pause arrived and the market ripped +9.5% in a single session. Most people sold the bottom and missed it. That memory matters this week.
This week marks the anniversary. The 10% universal tariff imposed under Section 122 on February 24 is now in its sixth week. It has already cost the average US household up to $1,300 per year according to the Tax Foundation. Procter & Gamble, the most vanilla consumer staple on the planet, warned of a $1 billion tariff hit on fiscal 2026 earnings. If P&G is not immune, nothing is.
Breadth bounced from 15 to 51. The VIX dropped from ~30 to 23.87. For four days, it looked like the worst was behind us.
Then, Saturday afternoon, while I was finishing this recap, this landed on my screen:
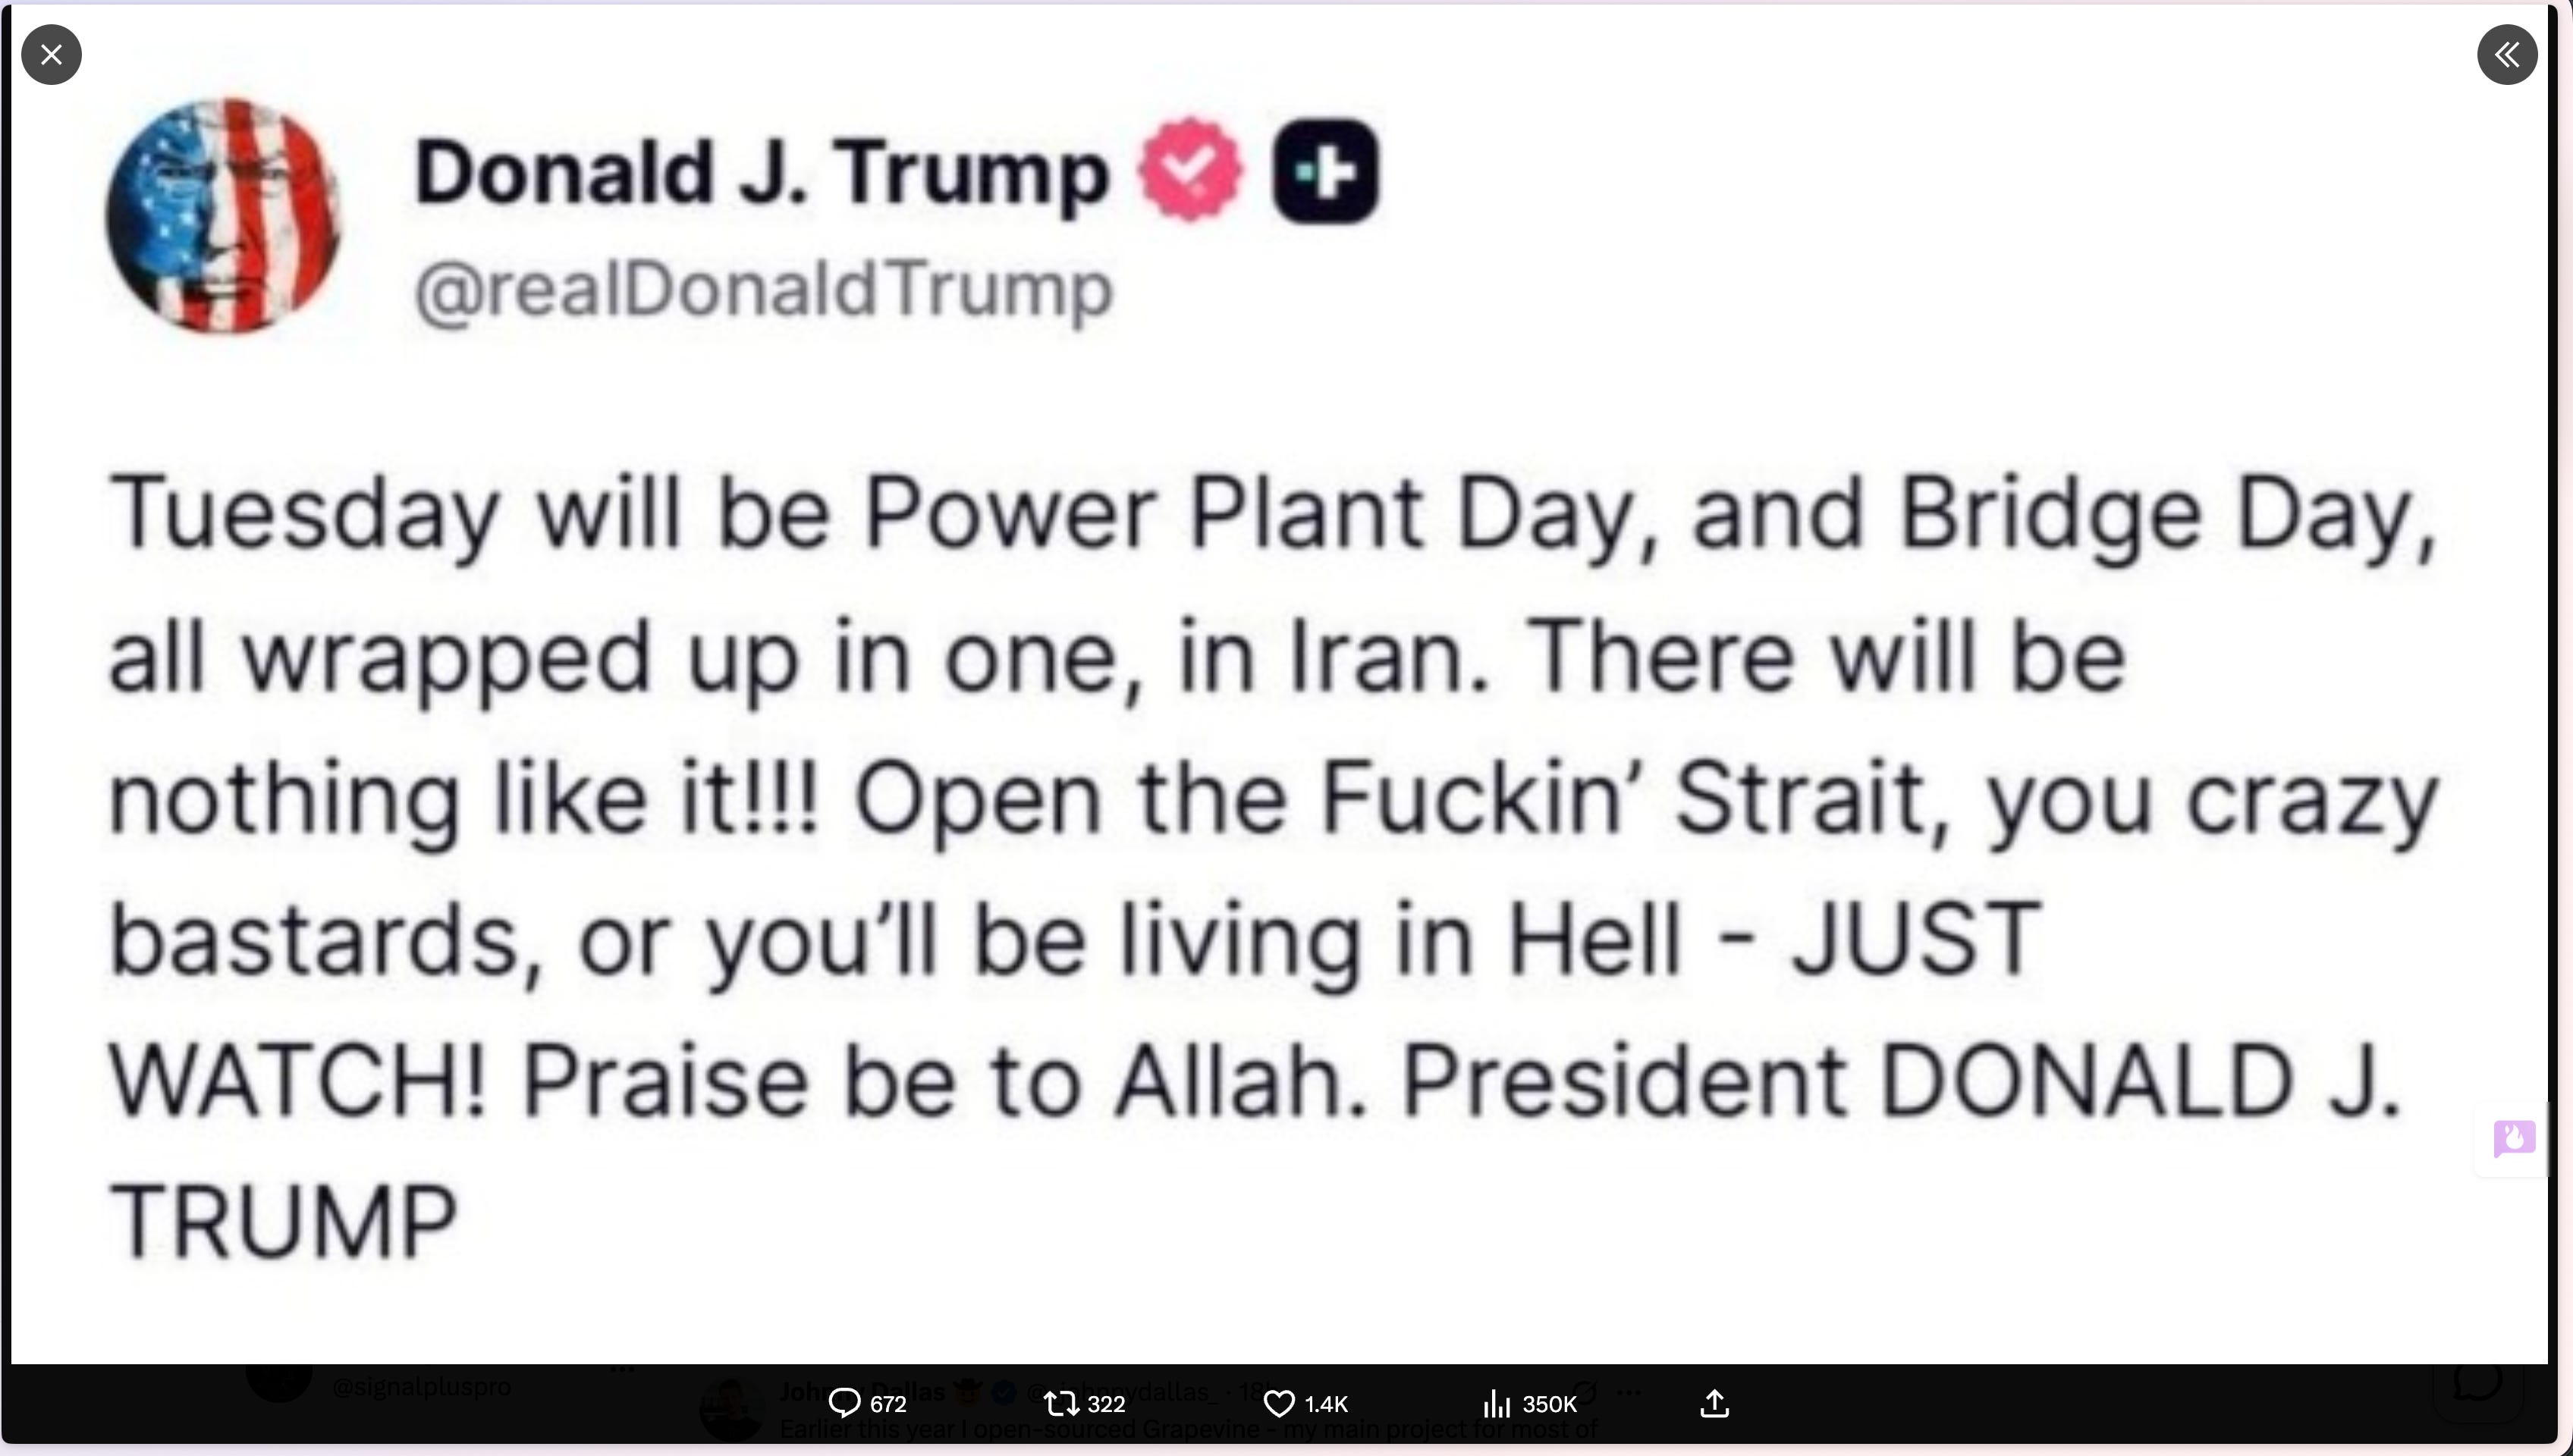
48 hours. That puts the Iran deadline on Monday. As you know, the Strait of Hormuz handles 20% of global oil supply. Oil is already above $100 with the strait contested. If Hormuz escalates while the tariff regime is still compressing margins across every sector, the stagflation math goes from theoretical to immediate.
Good Friday kept US markets closed. The bell never rang. Monday is the first session where all of this gets priced at once: six weeks of tariff damage, an Iran ultimatum expiring at open, and a CPI print on Friday that will either confirm or kill the market’s five-cut fantasy.
Last week I told you the market’s contradiction was that fear accelerated while the damage decelerated. That contradiction is about to resolve. Monday decides which direction.
To get the most out of these market recaps and understand the framework behind my observations, I encourage you to read about my methodology here.
Market Breadth
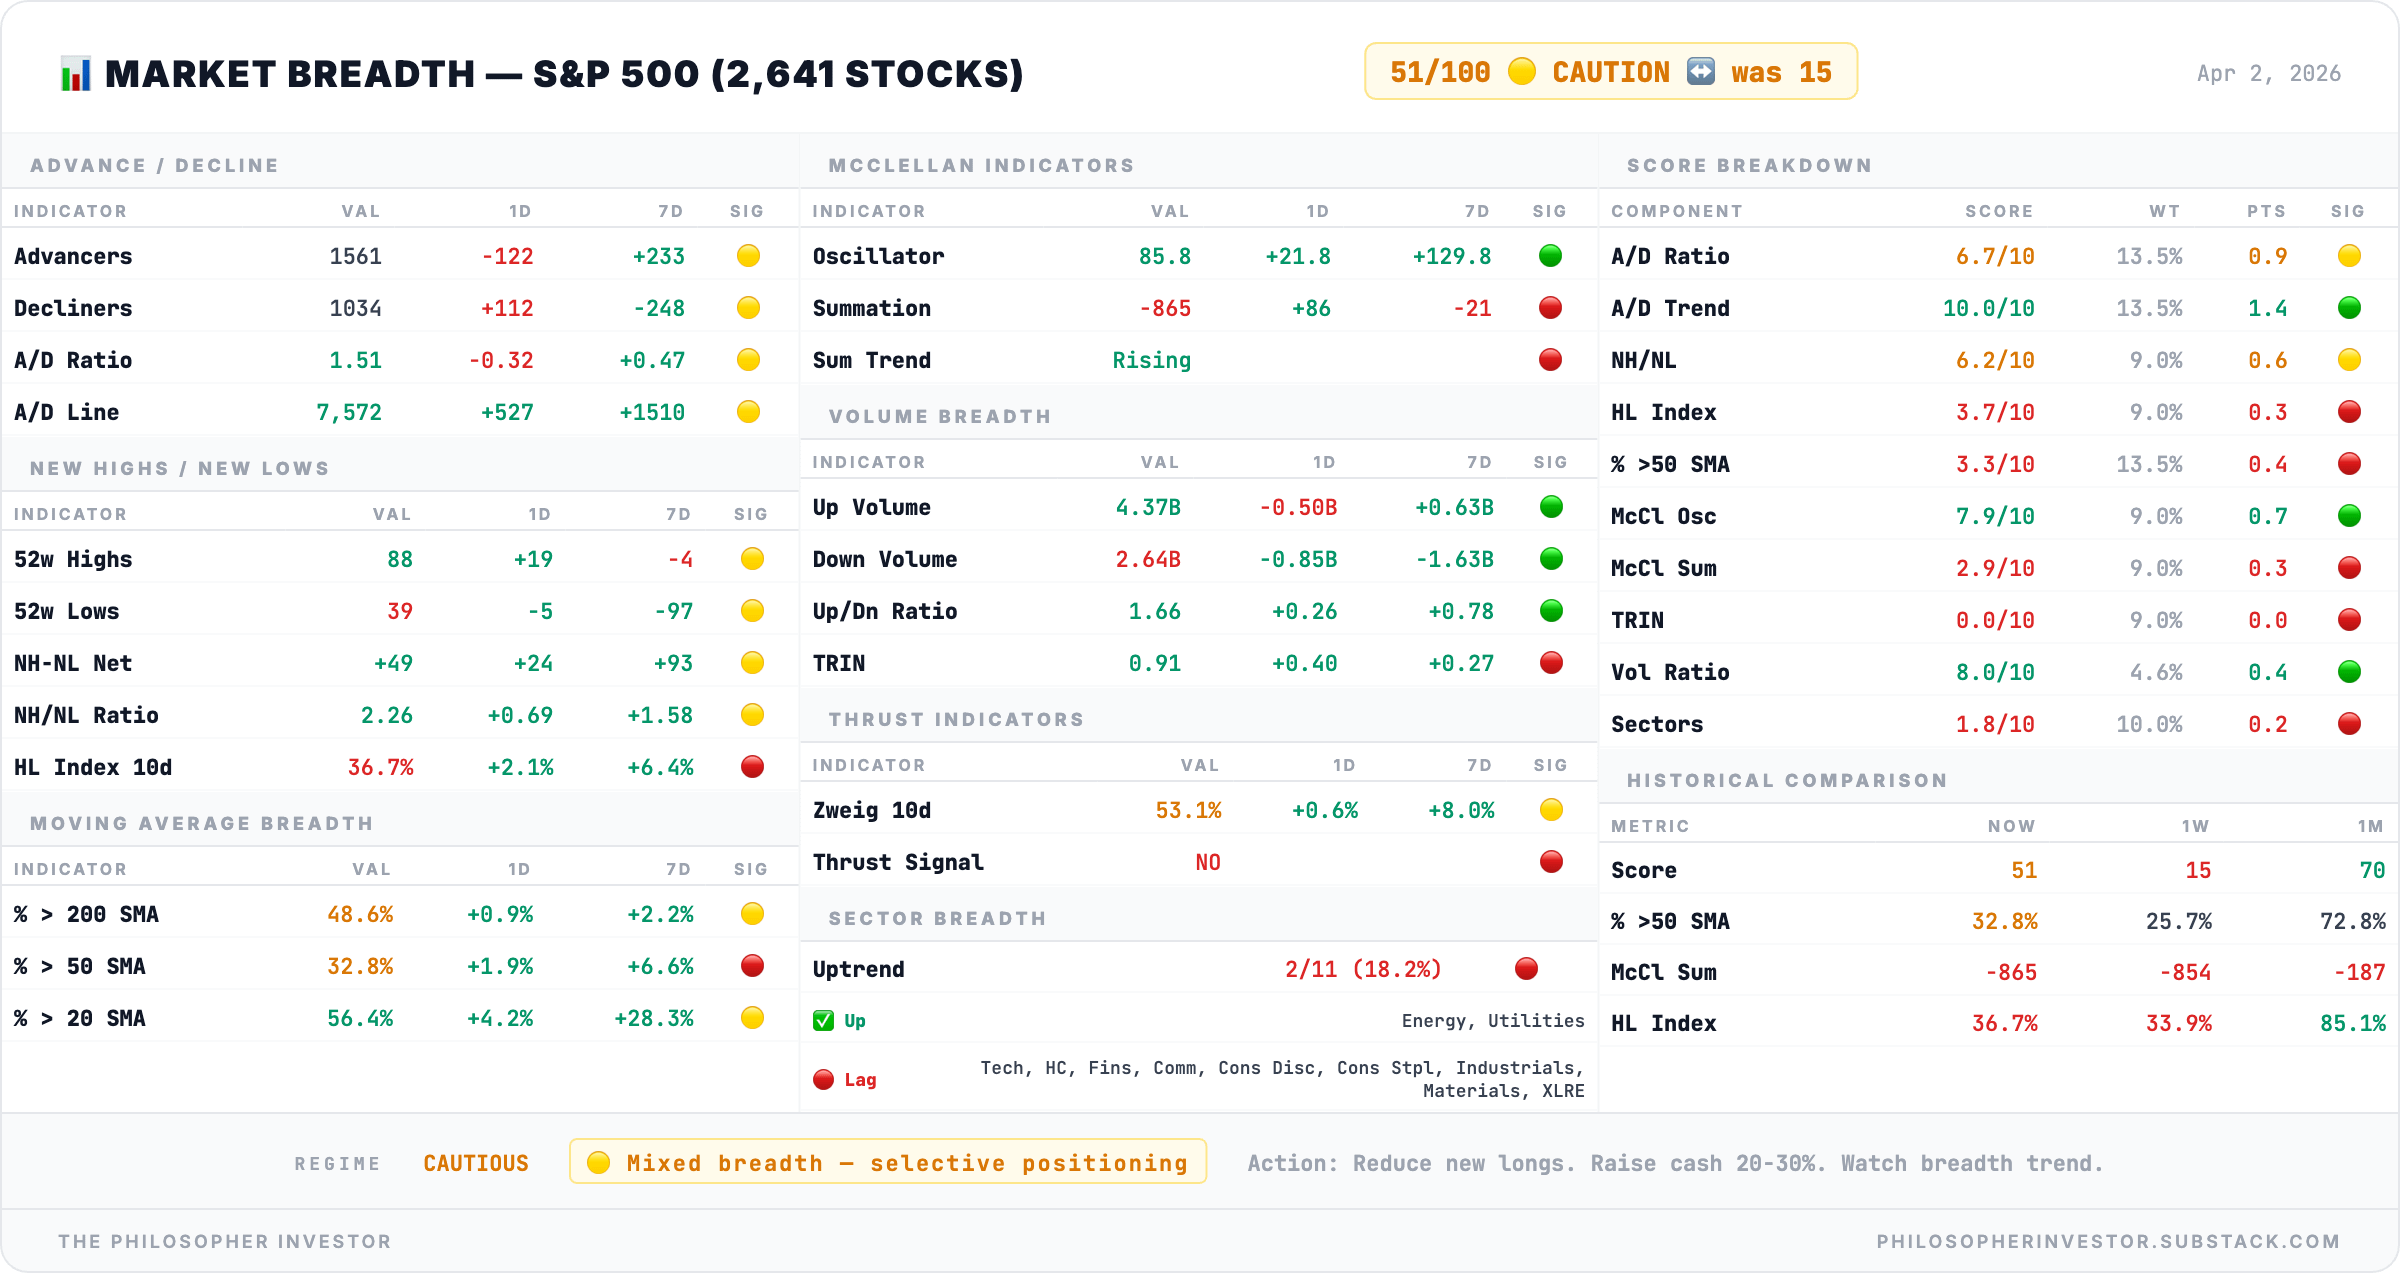
Breadth Score: 51/100 – 🟡 CAUTIOUS (was 15)
The breadth score bounced from 15 to 51 this week. That is a +36 point recovery, very impressive. One month ago this score was 70. Five weeks of selling brought it to 15. One week of relief brought it halfway back. The regime recommendation is to reduce new longs and raise cash to 20-30%.
The internals confirm real improvement happened this week. 32.8% of S&P 500 stocks trade above their 50-day moving average, up from 25.7% seven days ago. Still weak (two-thirds of the market below trend), but the direction changed for the first time in five weeks. The advance/decline ratio sits at 1.51, meaning three stocks advanced for every two that declined. Last week this was 0.54. That is a meaningful reversal in buyer participation.
The McClellan Oscillator bounced to +85.8, up from last week’s -23 (which itself was already recovering from -176 the week before). The daily momentum reversed hard. But the Summation Index dropped further to -865, down from -854 last week. The daily oscillator bounced while the accumulated damage kept building underneath.
Volume confirmed the bounce. Up volume at $4.37B versus down volume at $2.64B gives an up/down ratio of 1.66, the first session with more money flowing in than out in three weeks. TRIN at 0.91 is neutral, mildly favoring advancers. No panic selling on volume. But this is pre-Monday. TRIN on Monday will be the number to watch.
New highs: 88. New lows: 39. The NH/NL ratio of 2.26 is back above 1.0 for the first time in weeks.
The Zweig breadth thrust indicator at 53.1% with no thrust signal means we are not getting the kind of explosive breadth surge that marks durable bottoms. The buying this week was real. It was also insufficient.
And so: the breadth was healing. For the first time in five weeks, the momentum turned positive. Then the Iran ultimatum landed Saturday evening. Monday will test whether this recovery holds or collapses back below 30. Watch whether the McClellan Oscillator holds above zero after Monday’s reaction. If it stays positive despite the shock, the internal resilience is genuine. If it collapses back to -100, we are back to March.
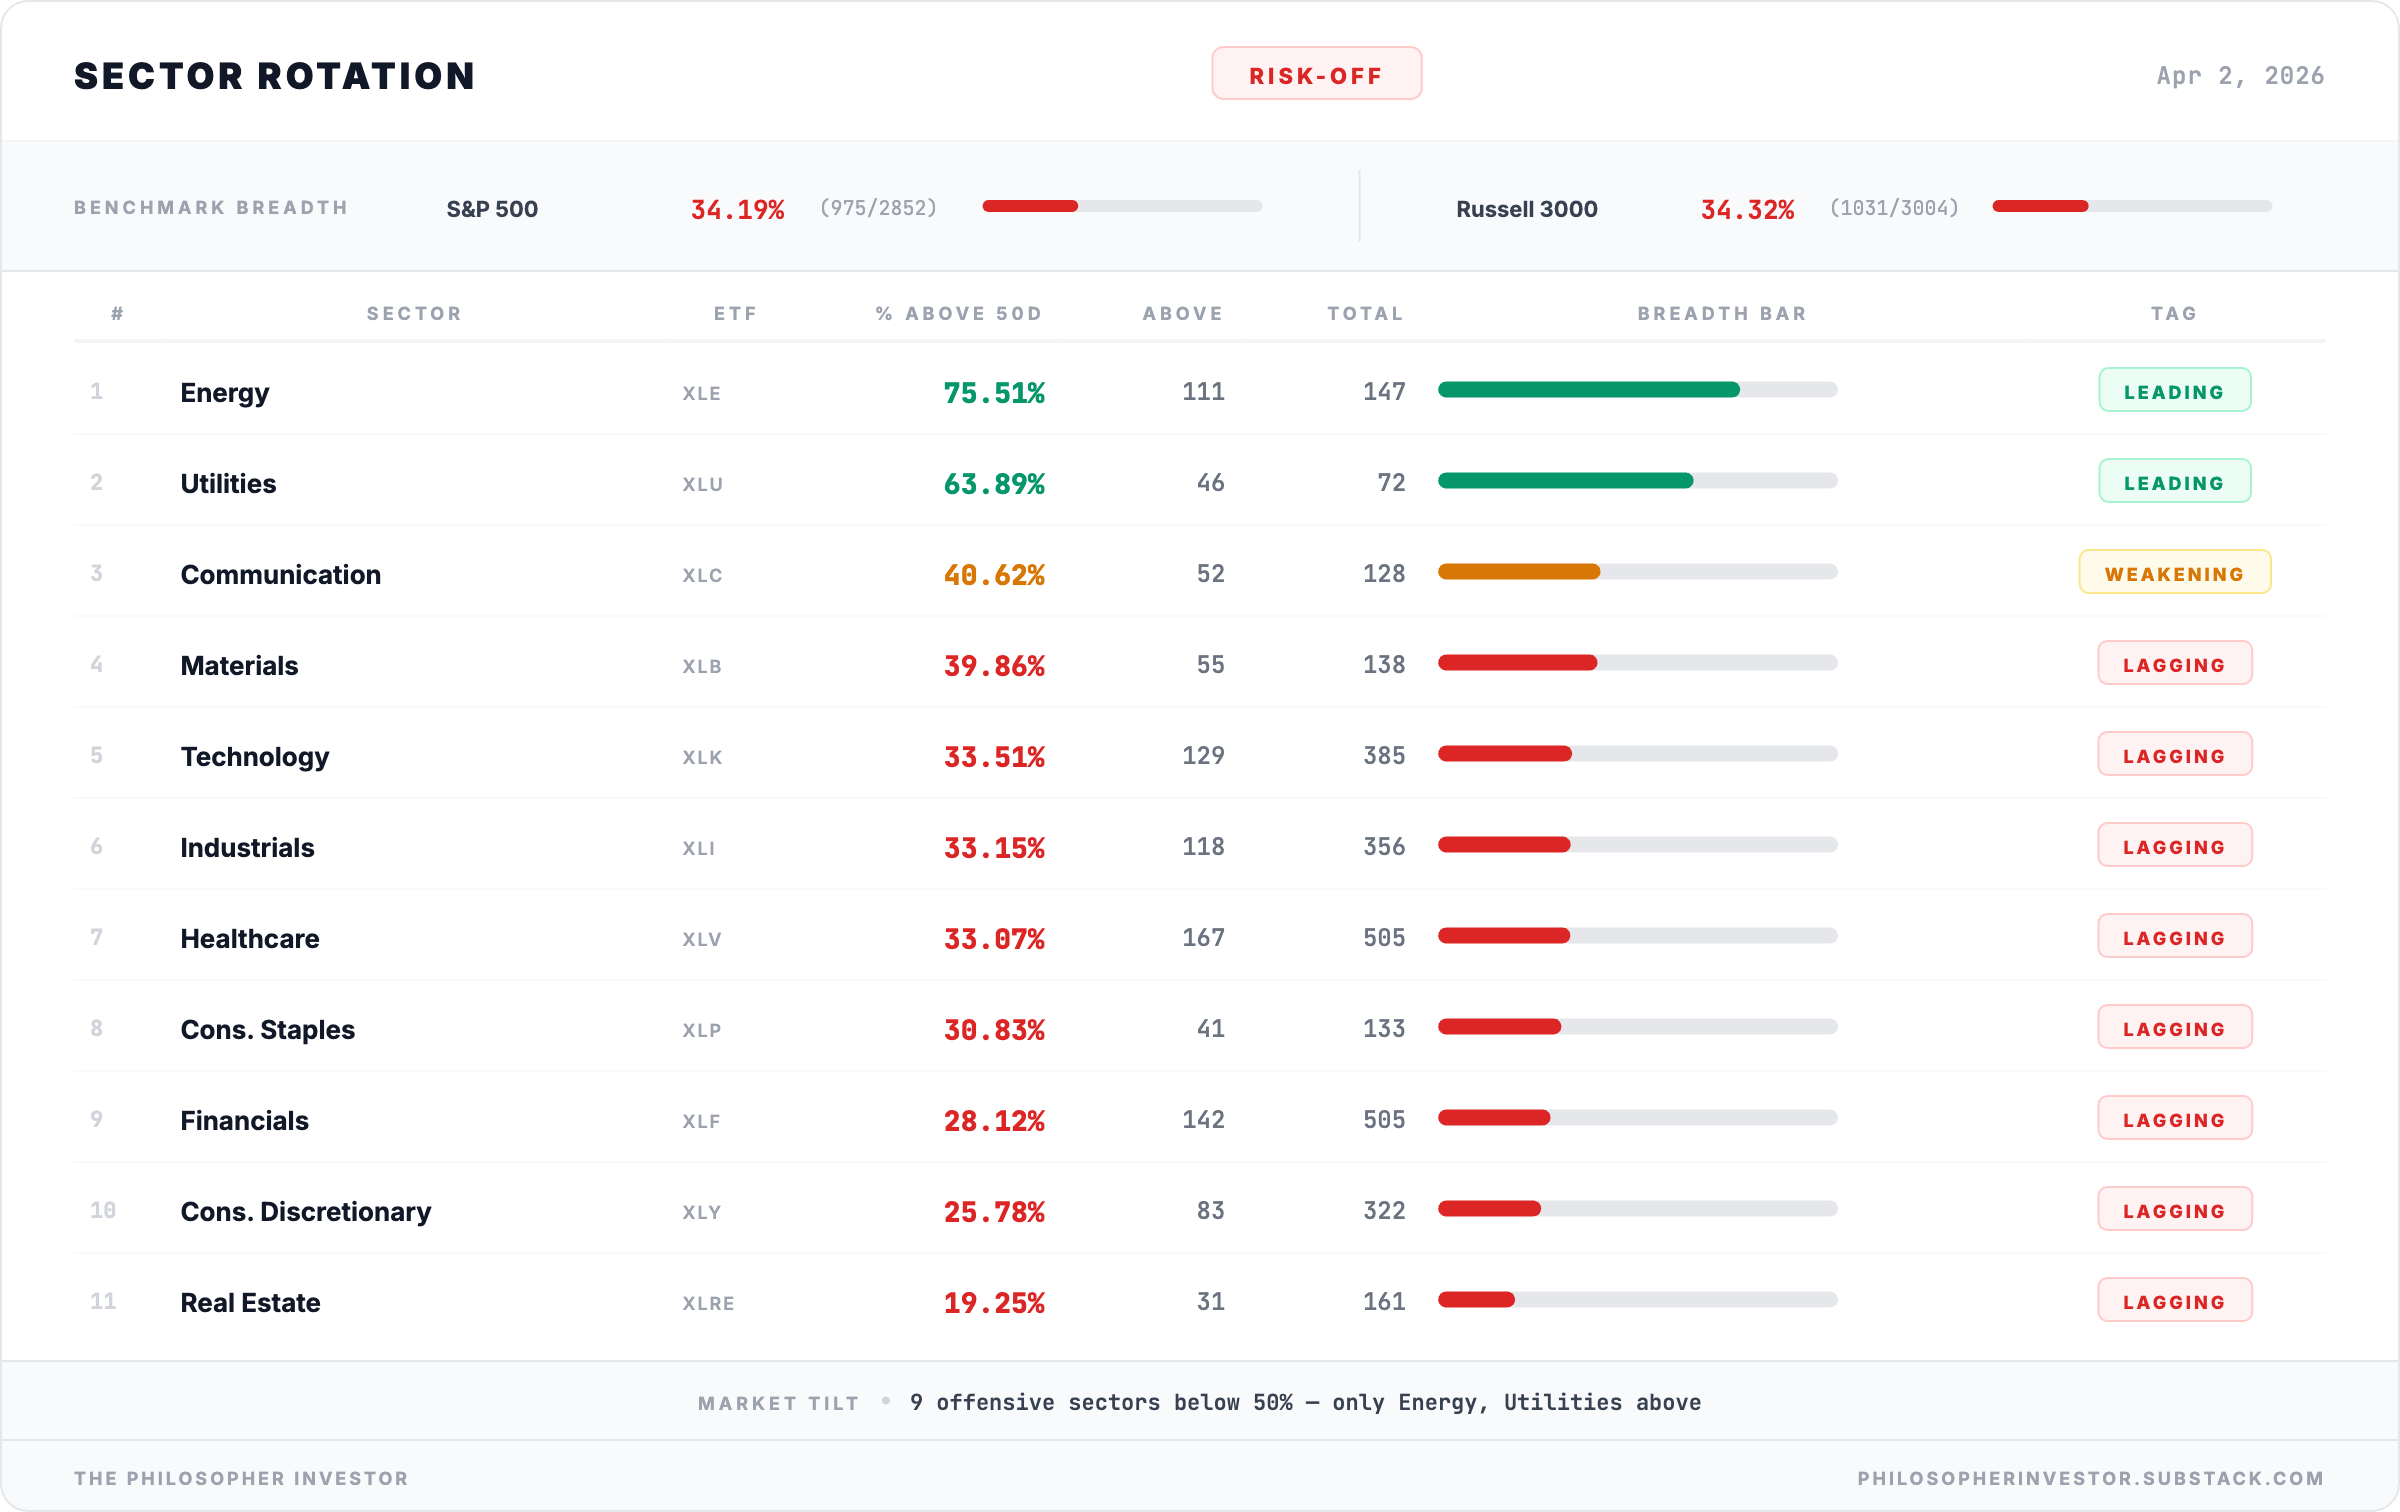
🚨 Sector Rotation: Two Survivors
What changed this week:
Energy (XLE) lost ground: 84% → 75.51%. Still the leader by a wide margin, still 111 out of 147 stocks in uptrend. But this is the first decline in five weeks. Last week I called Energy a “parallel universe.” This week the universe is starting to feel gravity. The reason it still leads: oil above $100 with the Strait of Hormuz contested and a 48-hour ultimatum expiring Monday. If Hormuz escalates, domestic producers are the biggest beneficiaries. They pump, refine, and sell on American soil while the rest of the world scrambles for supply.
Utilities (XLU) surged: 54% → 63.89%. Last week I called Utilities "the pretender" and said they could not hold their line. I was wrong. They did not just hold, they gained 10 points. Dividends, zero imports, and the AI datacenter power buildout are turning the classic defensive sector into something with a growth story. When utilities outperform in a selloff, the market is pricing recession.
Communication (XLC) bounced: 32% → 40.62%. Not a leader. Not dead either.
The casualties improved but are still broken:
Materials (XLB): 31.16% → 39.86% (+8.7). Transition zone.
Technology (XLK): 27.27% → 33.51% (+6.2). Supply chains still exposed.
Industrials (XLI): 26.12% → 33.15% (+7.0). Domestic contracts help, imported components hurt.
Healthcare (XLV): 29.05% → 33.07% (+4.0). Least tariff-exposed of the laggards.
Cons. Staples (XLP): 27.61% → 30.83% (+3.2). P&G warned of a $1B tariff hit.
Financials (XLF): 16.40% → 28.12% (+11.7). Biggest bounce. Most oversold names snapped back hardest.
Cons. Disc. (XLY): 22.60% → 25.78% (+3.2). Everything on shelves just got 10% more expensive.
Real Estate (XLRE): 14.29% → 19.25% (+5.0). Dead last. 31 out of 161 stocks holding up.
Every single sector improved. Financials had the biggest bounce (+11.7 points), which makes sense: the relief rally was broadest in the most oversold names. But every sector except Energy and Utilities is still below 40%. Improved, not recovered.
The mental model for the rest of 2026 has shifted. Forget "value versus growth" or "cyclicals versus defensives." The new sorting rule is domestic revenue versus import-dependent and real assets versus paper assets.
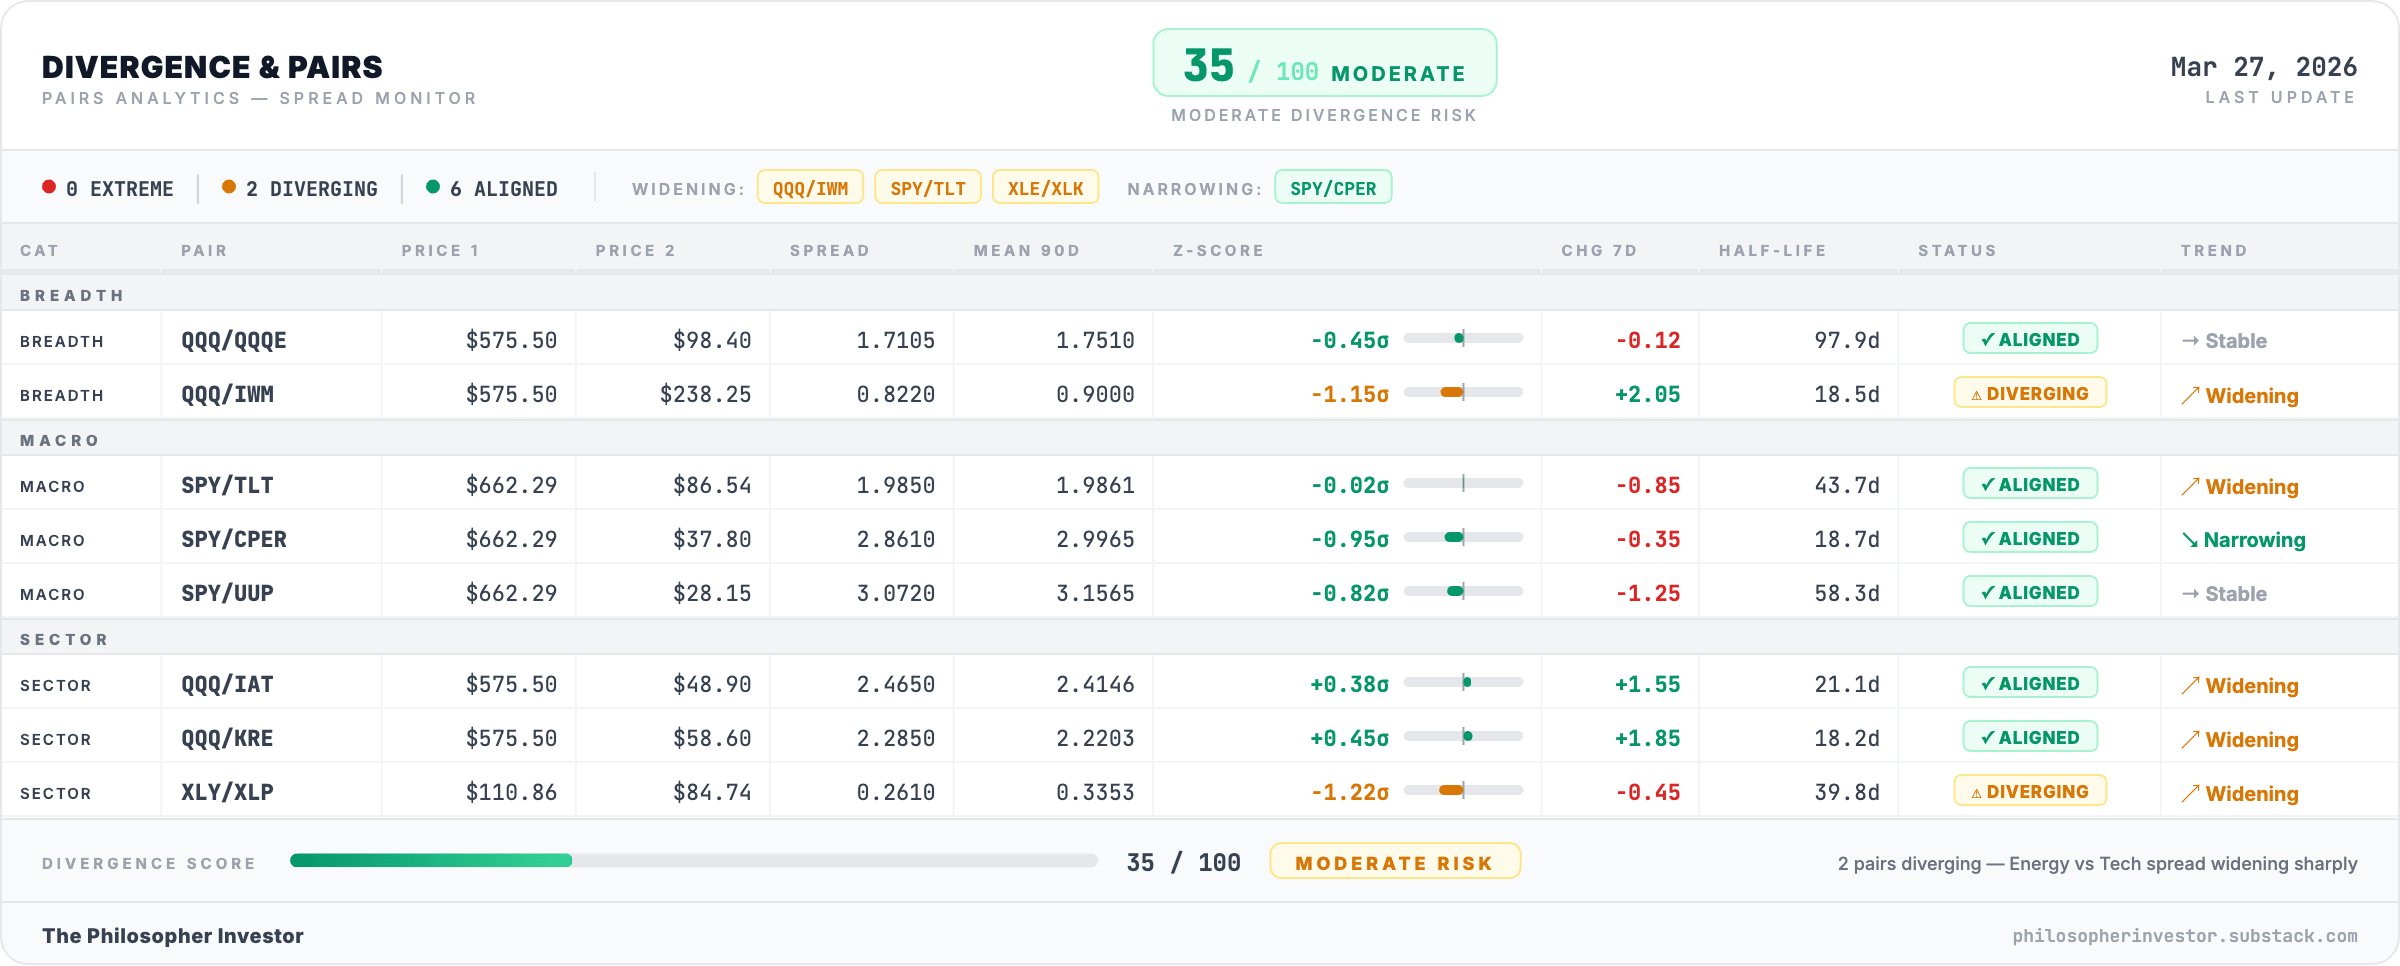
🔍 Divergence Score: 35/100 — MODERATE RISK
The two diverging pairs:
Large caps vs small caps (QQQ vs IWM). Z-score at -1.15σ, still diverging and widening. The Nasdaq 100 is underperforming small caps by more than one standard deviation from its 90-day average. Big tech is taking the heaviest hits from supply chain fears. Taiwan, Korea, Japan are where the components come from. The ongoing tariff regime makes this divergence worse, not better.
Discretionary vs staples (XLY vs XLP). Z-score at -1.22σ, widening. Consumers rotating from things they want to things they need. Classic recession-fear behavior. Flagged three weeks in a row now. The persistence of this signal matters: it is not a one-week blip, it is a trend.
The widening pairs that are not yet diverging:
Stocks vs bonds (SPY vs TLT) widening with a -0.85 weekly change. The bond market is pricing recession while equities hold up relatively well. Tech vs regional banks (QQQ vs IAT and QQQ vs KRE) widening at +1.55 and +1.85 respectively. Banks are underperforming tech at an accelerating rate.
One bright spot: equities vs copper (SPY vs CPER) is narrowing (-0.35 weekly change). Copper and equities converging during a selloff usually means the growth scare is real, not just a positioning event. But it also means the pair is moving toward alignment, which reduces systemic divergence risk.
📉 Volatility: VIX 23,87 – Down 23% Into a Tariff Shock
The fear gauge dropped 23% in a week. Institutions pre-positioned their hedge book all quarter. Monday will test whether it holds.
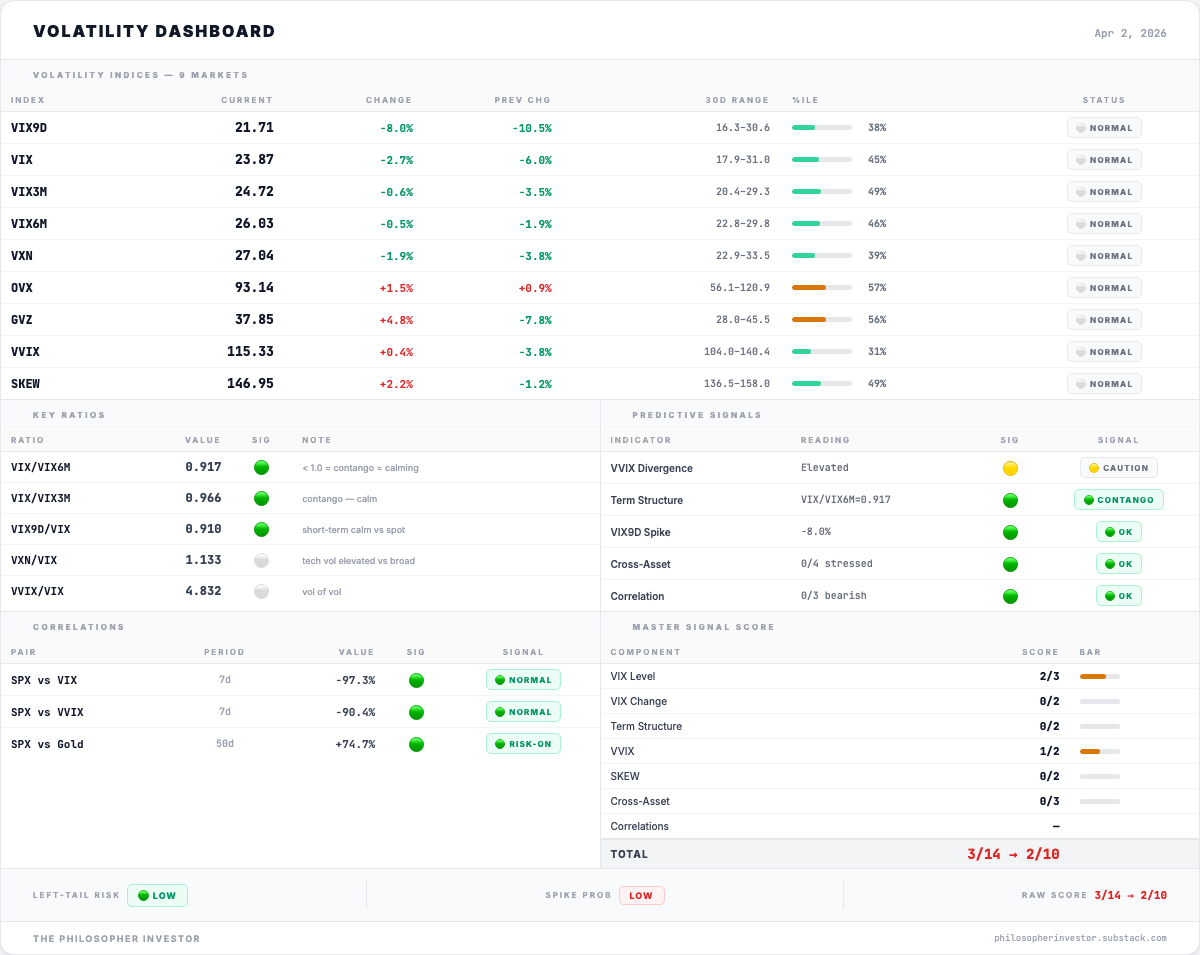
VIX closed at 23.87, down from ~30 last week. The volatility index fell -23% in the same week that the Hormuz crisis escalated to a 48-hour ultimatum. Last week I wrote that VIX near 30 was the highest sustained reading since the April 2025 tariff shock. One week later, it is back to 23.87.
The explanation is mechanical, not irrational. Institutions spent all of Q1 adding protective puts as geopolitical risk mounted. By the time the Iran deadline crystallized, the hedges were already in place. The risk was priced into the options market before it was priced into the stock market.
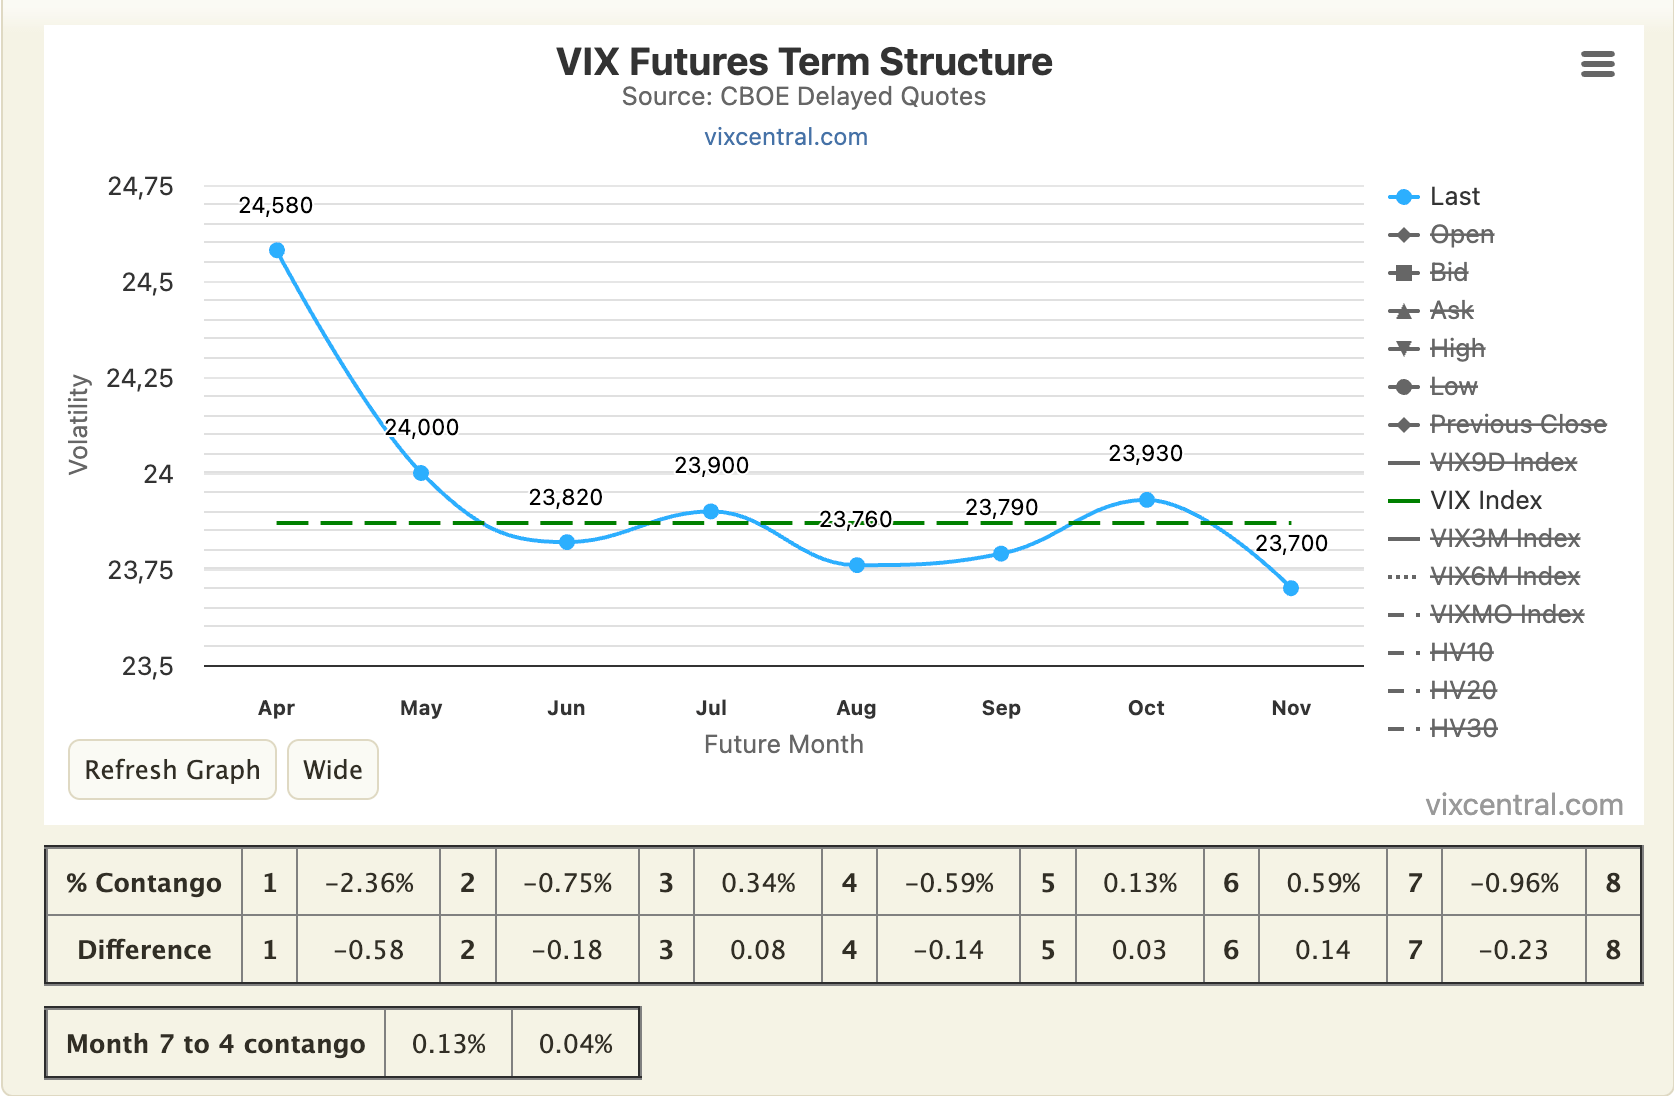
The term structure confirms this reading. VIX/VIX6M at 0.917, contango, calming. Short-term fear below long-term fear. If Monday were expected to be a crash, short-dated vol would exceed long-dated vol (backwardation). It does not. VIX9D at 21.71 is -8% lower than spot VIX, meaning the very near-term expectation is actually calmer than the 30-day view. VXN/VIX at 1.133 means Nasdaq implied volatility exceeds S&P implied volatility by 13%: the tech-heavy index is expected to move more violently.
VIX3M at 24.72 and VIX6M at 26.03 show the market expects elevated but not extreme volatility for the next six months. The upward-sloping term structure is the smart money’s way of saying: the damage is not done yet, but it will be orderly.
VVIX at 115.33 (31st percentile), the volatility of volatility, is unremarkable. SKEW at 146.95 (49th percentile) is near the 140 threshold where tail risk demand becomes notable. Institutions are paying up for deep out-of-the-money puts, but not panicking.
GVZ (gold volatility) at 37.85, down from last week’s extreme 45.07 but still elevated at the 56th percentile. Gold vol cooling while equity vol normalizes is consistent with a market that has processed the initial shock and is waiting for Monday’s price discovery. OVX (oil volatility) at 93.14, 57th percentile, stable. Oil vol has been absorbed. The energy complex is pricing the supply deficit as structural, not event-driven.
💱 FX Signal: Dollar Strengthening
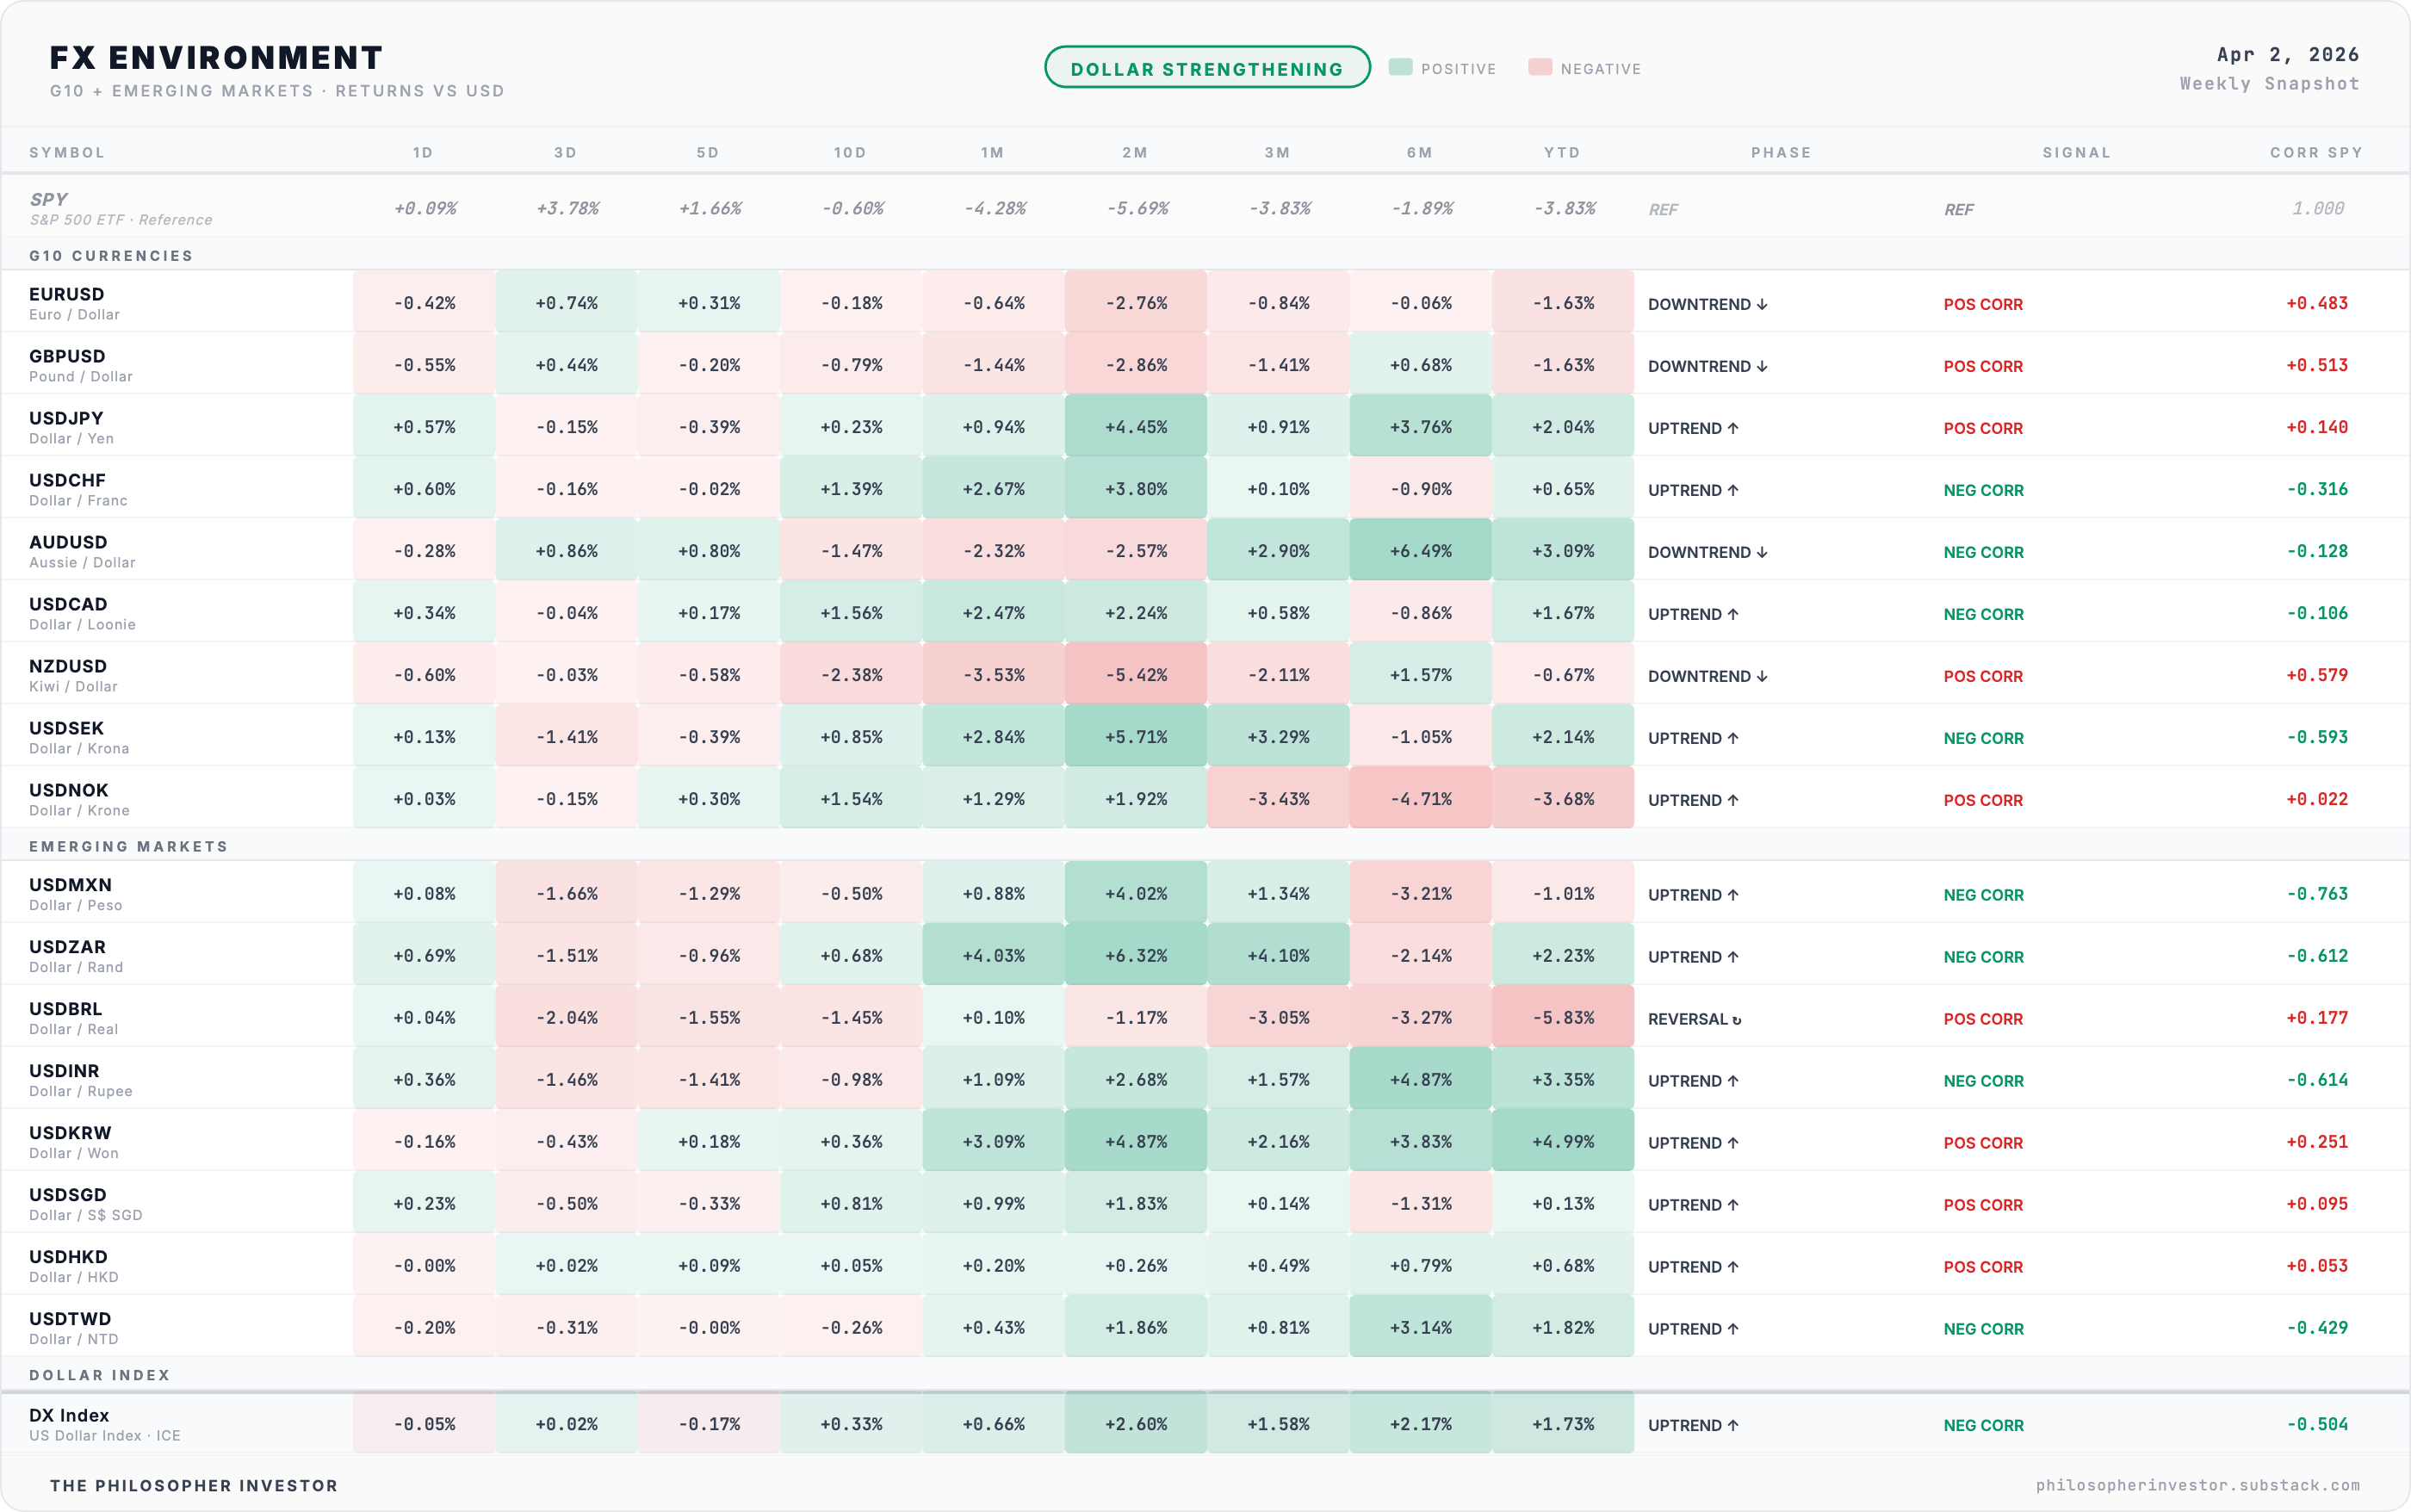
The dollar is strengthening because it is the world’s safe haven currency. When geopolitical risk spikes, global capital buys Treasuries, and to buy Treasuries you need dollars. The Hormuz crisis is accelerating this: 20% of global oil at risk means every country that imports energy needs more dollars to pay for it.
Europe is absorbing the Hormuz premium harder than anyone. Their energy dependence means every dollar higher on crude is a direct hit to their economy. Emerging markets are getting squeezed from both sides: oil costs more AND their dollar-denominated debt gets more expensive with every tick higher on the DX index.
One date to watch: Bank of Japan, April 27-28. If they signal tighter policy, the yen carry trade unwinds. In 2024, a surprise BoJ hike triggered chaos in early August: VIX jumped from 23 to above 65 intraday before closing at 38 in a single session, the Nikkei dropped -12% in one day, and every risk asset fell simultaneously. USD/JPY is the canary for that scenario.
🧠 My Take
Monday is the session where Hormuz risk gets priced. Trump’s formal deadline for Iran is Monday evening, after the close, but the market will trade all day with that countdown hanging over every bid and ask. The last trading day was Thursday April 2. Three days of geopolitical escalation are sitting in a queue, waiting for the bell at 9:30.
The VIX at 23.87 tells me the options market has absorbed the possibility of Monday’s events. Institutions pre-hedged all quarter. But there is a difference between a risk being absorbable and a risk being priced. Monday is the pricing event.
The April 2025 analog is powerful. Last April, the market fell over 10% in two sessions on tariff fears, then reversed +9.5% in a single session when the policy paused. That memory is going to keep momentum players who remember the reversal from selling Monday. And it is going to be right for some of them and wrong for others, because the Iran crisis adds a variable that did not exist last April. The V-shaped recovery playbook needs a longer incubation period. Last April, it took 5 trading days of selling before the single-session reversal arrived. With Iran in the mix, expect at least that much uncertainty before direction becomes clear.
The week has two key moments. Monday (Iran deadline) and Friday (CPI, April 10). Current inflation sits at 2.4%. If CPI shows tariff pass-through accelerating, rate cut hopes fade. If the print is benign, the relief rally has legs.
Four scenarios for April 6-10:
Relief rally (10%). Iran de-escalation Monday evening, CPI benign on Friday. SPY rallies +3-5% on the week. Full playbook resumes.
Controlled reaction (35%). SPY opens -1% to -2%, stabilizes by 10am, VIX stays below 25. Iran rhetoric cools before the Monday evening deadline.
Panic open, recovery by Wednesday (35%). SPY gaps -3% to -4% on Hormuz escalation, intraday capitulation. Best entries come from the panic flush. Wait for Wednesday stabilization to be sure.
Hot CPI compounds the damage (20%). CPI Friday April 10 shows inflation reaccelerating. Raise cash to 40% minimum.
Overlay risk (any scenario): BoJ. The Bank of Japan meets April 27-28. Markets price a 71% probability of a rate hike. If USD/JPY (currently near 160) drops sharply toward 145-150, the carry trade unwinds and VIX spikes above 35 regardless of which scenario is playing out.
🔎 Options Flow — Smart Money Positioning
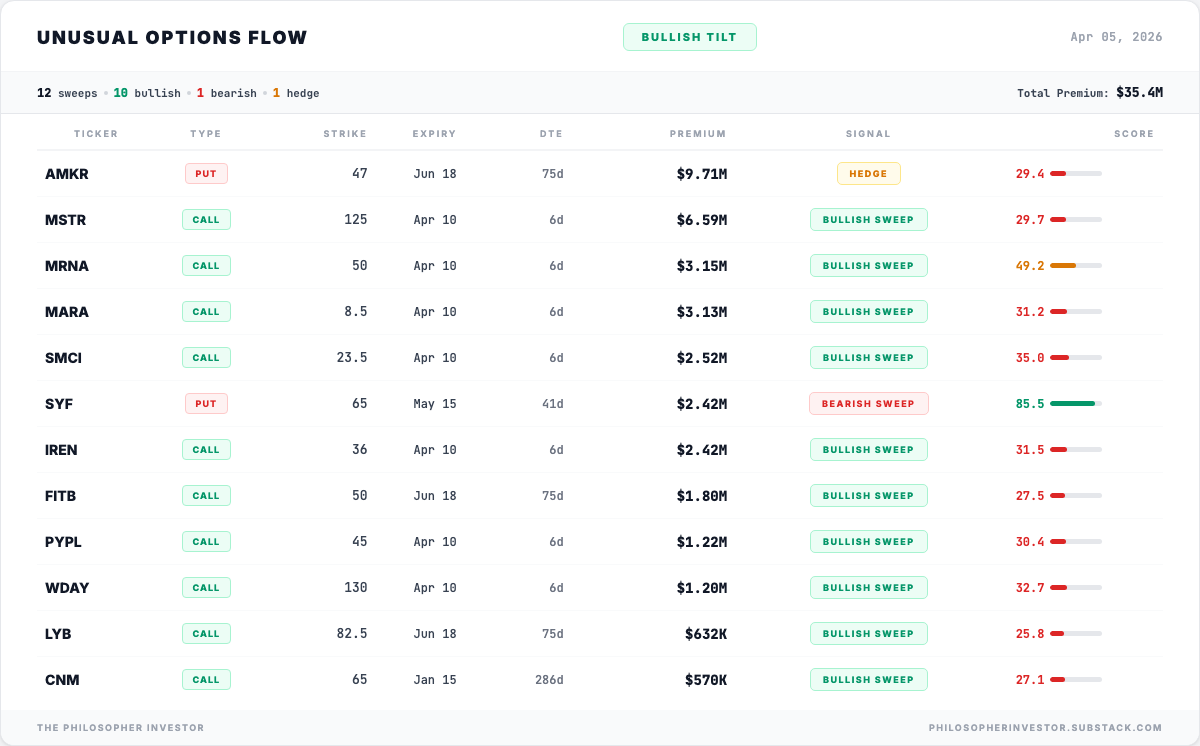
The conviction play: INSM (Insmed). $106K in calls at the $210 strike, 29% out of the money. Volume 15.2x normal open interest. The stock has been climbing while the broader market sold off. Nobody buys $210 calls on a $162 stock at the open unless they expect a specific catalyst. On my watchlist at $160-165 if Monday stabilizes.
The oversold bounce bet: EL (Estee Lauder). $765K call sweep at RSI near 20. RSI that low on a mega-cap is extraordinarily rare. Someone is betting $765K on a +6.3% bounce to the $73.50 strike within 13 days. Bold, but the RSI says the selling is exhausted at this level.
The consumer stress bet: SYF (Synchrony Financial). $1.2M in puts at $60, May expiry. Consumer credit bear bet. When oil rises and confidence falls, subprime credit is where the pressure shows first.
The catalyst play: MRNA (Moderna). $1.47M in calls at $53, expiring Friday April 10. Five trading days. Pure event bet.
INSM is the clearest institutional conviction signal. EL needs Monday’s reaction before acting. SYF puts confirm the consumer weakness showing up in the sector breadth data.
🔥 Trade of the Week: BUR (Burford Capital)
At $4.14, you are buying the world leader in litigation finance below the value of its assets. The YPF judgment is a free option on top.
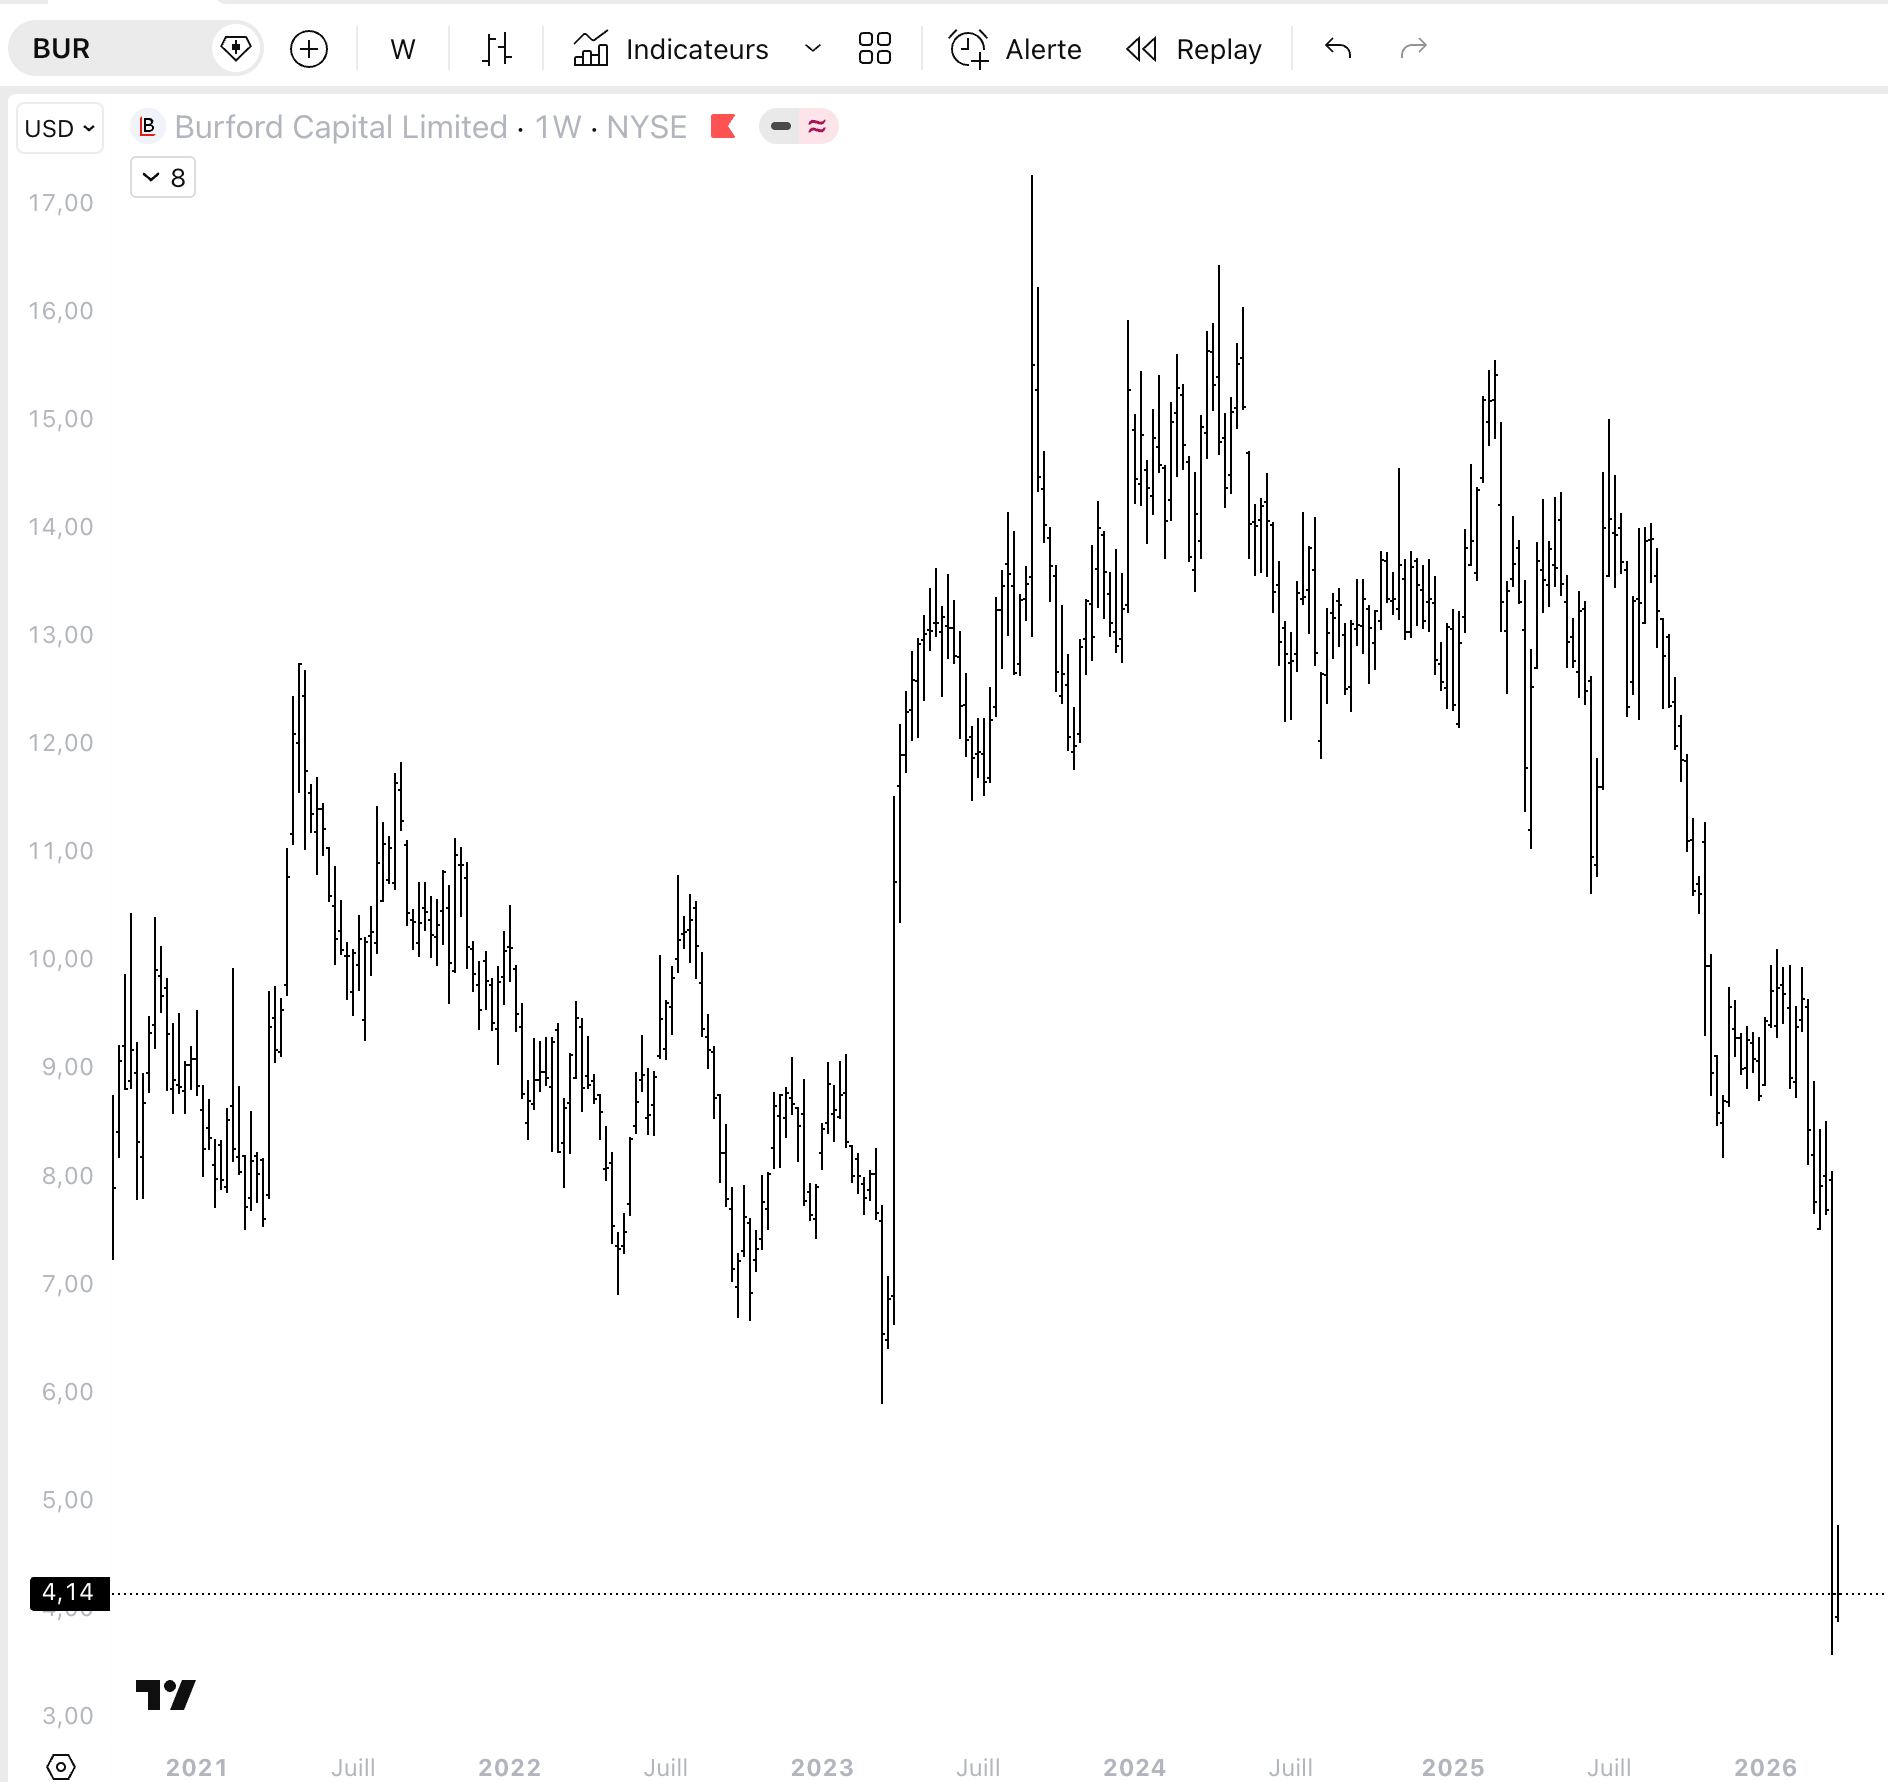
On March 27, a U.S. appeals court voided Burford’s $16.1 billion YPF judgment against Argentina. The stock crashed -47% in a single session, from $7.83 to $4.14. Analysts slashed targets. The headlines screamed bankruptcy risk.
Here is what makes this the trade of the week: the crash was driven by forced selling from index funds and institutional holders with price-floor mandates, on top of a genuine legal setback. The YPF judgment is gone. But the business underneath is still there, and the market is pricing it as if it is not.
The math that matters. Burford generated $413 million in revenue last year without collecting a single dollar from YPF. The judgment was an unrealized gain on the balance sheet, never a revenue stream. At $4.14, Burford’s market cap (roughly $906M) sits below the book value of its tangible assets excluding YPF entirely. You are buying the core litigation finance business for less than its accounting value, and getting a free option on any eventual recovery of the Argentine judgment.
The pipeline tells the real story. Revenue declined -24% in 2025 and that number looks scary in a headline. But litigation finance is lumpy by nature. A case takes years to resolve. What matters is the pipeline, not the quarterly P&L. New business commitments grew +39% in 2025. The portfolio of modeled realizations increased $700 million to $5.2 billion at year end. Burford has never had more ammunition in reserve. That is a spring compressing before the earnings cycle catches up.
Why it fits this environment. Burford is largely insulated from supply chain costs and imported inflation because its inventory is made of legal rights, not physical goods. The majority of their major assets (antitrust, commercial litigation) are adjudicated in U.S. courts and paid in dollars. A lawsuit does not depend on the Fed, on consumer spending, or on what crosses a border. In a portfolio full of macro-exposed names, BUR is one of the most uncorrelated assets I can find.
The bottom-fishing system confirmed what the chart shows. TRIGGER signal at 85/100, the highest conviction score in the system this week. RSI at 18.5, deep in capitulation territory. Selling volume dried up after March 27.
Entry zone: $4.00-4.25 (current zone at last close)
Stop: $3.45 (below the crash low)
Target 1: $7.50 (+81%, B. Riley revised PT)
Target 2: $9.50 (+130%)
R:R: 5:1 on T1, 8:1 on T2
Sizing: Half position only. Max 1.5% of portfolio.
Risks and why they are already priced. The Supreme Court could refuse certiorari on the YPF appeal, removing the last hope for recovery. Further analyst downgrades could trigger more forced selling. A material write-down of the YPF asset could reduce Burford’s balance sheet equity below levels required by their bond indentures. These are real risks and they are why the stock is at $4.
But the bear case ignores three things. First, Burford has over $700 million in cash, cash equivalents, and marketable securities on hand. Second, they have no debt maturities before 2028, with obligations carefully laddered through 2034. There is no near-term refinancing pressure. Third, management has stated explicitly that they will not use debt to repurchase shares and have a track record of monetizing their litigation portfolio through secondary sales rather than diluting shareholders. The market has priced a liquidity crisis that the balance sheet does not support. That asymmetry is the trade.
🎯 Portfolio Performance
I share entry levels, stops, and targets. Position sizes are yours to decide based on your own risk tolerance.
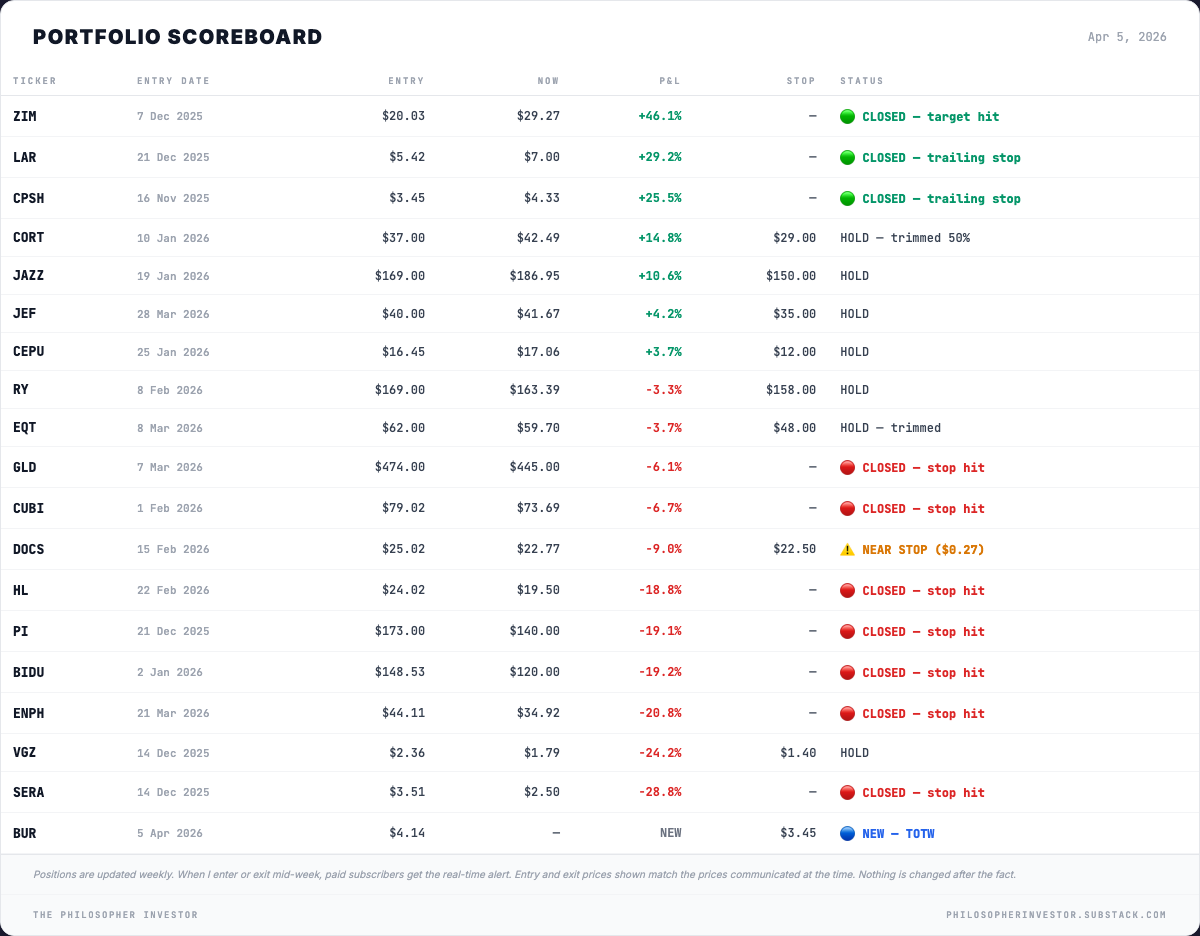
CORT was “quietly doing its job” at +1.6% last week. One week later: +14.8%. Not so quiet anymore. JAZZ was the bright side last week at +8.1% and keeps climbing at +10.6%. Healthcare, zero macro exposure. These two survive corrections.
JEF entered last week at $40 on the $39.85 support. Early green. CEPU recovered from -10% to +3.7%. Both holding.
RY was twenty-one cents from its stop last week. Recovered to $163.39 but financials breadth at 28.12% keeps it fragile. EQT trimmed near $67, holding reduced size. Hormuz premium supports the thesis.
DOCS at $0.27 from stop. Monday decides. VGZ at -24.2%, holding but not adding.
Closed this week: ENPH stopped out at $34.92. Last week I wrote “below $35, we are out. No negotiation.” It closed at $34.92. Loss -20.8%. Lesson: do not add rate-sensitive names when VIX is above 25.
New this week: BUR (Trade of the Week). Entry $4.00-4.25, stop $3.45, targets $7.50 / $9.50. Half position, max 1.5%. See above.
See you next week.

Disclaimer
This newsletter is for educational and informational purposes only. It is not financial advice.
The content reflects personal opinions shared publicly as a journal. Trading stocks, options, futures, or any financial instrument involves significant risk. You can lose your entire investment. There is no guarantee of profit.
The author is not a registered investment advisor, broker, or financial professional with any regulatory authority including the SEC or CFTC. Always consult a licensed financial advisor before making any investment decisions.
By reading this newsletter, you accept full responsibility for your own trading and investment choices. Past performance does not guarantee future results. Markets are unpredictable.
Screenshots are courtesy of TradingView, VixCentral, and other platforms with which the author has no affiliation. Information shared may contain errors or become outdated quickly.
This content is the intellectual property of the author. Copying or redistributing without permission is prohibited.
By continuing to read, you acknowledge and accept these terms.
Read the desk every week
Market analysis in plain English, plus the app that scans the whole US market for you.
Become a member Read the original on Substack ↗