Trump Saved the Bounce. Monday Belongs to the Bank of Japan.
Market Recap — June 14th 2026
2026-06-14 · 17 min read · Originally published on Substack ↗
TL;DR
Market health reads a healthy 77 out of 100. The number is real, but the way the market traded this week is not as strong as that score suggests. More stocks rose than fell, yet the heavy money moved on the down side. Strong on the surface, soft underneath.
Leadership is getting narrow. Only three sectors are truly leading, all of them tied to banks, housing, and consumer spending, while energy and materials sit at the bottom of the board. When a recovery is healthy, more sectors join in. This week fewer did.
The fear gauges are pricing almost nothing into Monday, when the Bank of Japan is widely expected to raise rates. A calm market walking into a known, binary event is the whole risk this week.

Hello my friends,
Last week the market dropped hard, four ugly sessions in a row, and your whole feed called the top. A fast drop like that always feels like the end of the world. It usually isn’t. The way to tell a real top from a passing shakeout has nothing to do with the price you see on the screen. It comes down to one question: how many stocks are actually falling with the index?
A real top is slow and quiet. The index keeps climbing for weeks while fewer and fewer stocks come along for the ride. The market rots from the inside while the headline number still looks fine, and only at the very end does it roll over. What we got last week was the other kind of move, the kind I call a flush. The index dropped fast and hard, but most stocks held up underneath it. That happens when big players cut risk all at once, dumping positions for reasons that have nothing to do with the health of any single company. It is forced selling, not a market breaking down. I told you at the time it looked like a flush, and that is what it turned out to be.
Then, in classic fashion, the save came from the top. As the selling pressed, President Donald J. Pump stepped in with a headline, this time a new deal with Iran.

The man has a gift for it. He says the market-friendly thing at the exact moment the tape needs it, and he did it again. Nobody knows yet how long it holds or what the real terms are, so take it for what it is. But the bulls got their spark, and the bounce was on.
So here we are, back near where we started, with the price recovered and the internals broadly agreeing that the worst is behind us. There is one thing still standing in the way, and it is not on any American chart. On Monday and Tuesday, the Bank of Japan meets, and that meeting can move every market on earth. We bounced. Now comes the test.
Below I walk through everything I look at, one screen at a time: the health of the market, where the money is rotating, the divergences between assets, the fear gauges, the currency picture, and the options flow. I keep it plain. The goal is that you finish this knowing exactly what I see and why it matters for your positioning.
To get the most out of these market recaps and understand the framework behind my observations, I encourage you to read about my methodology here.
📊 Market Health
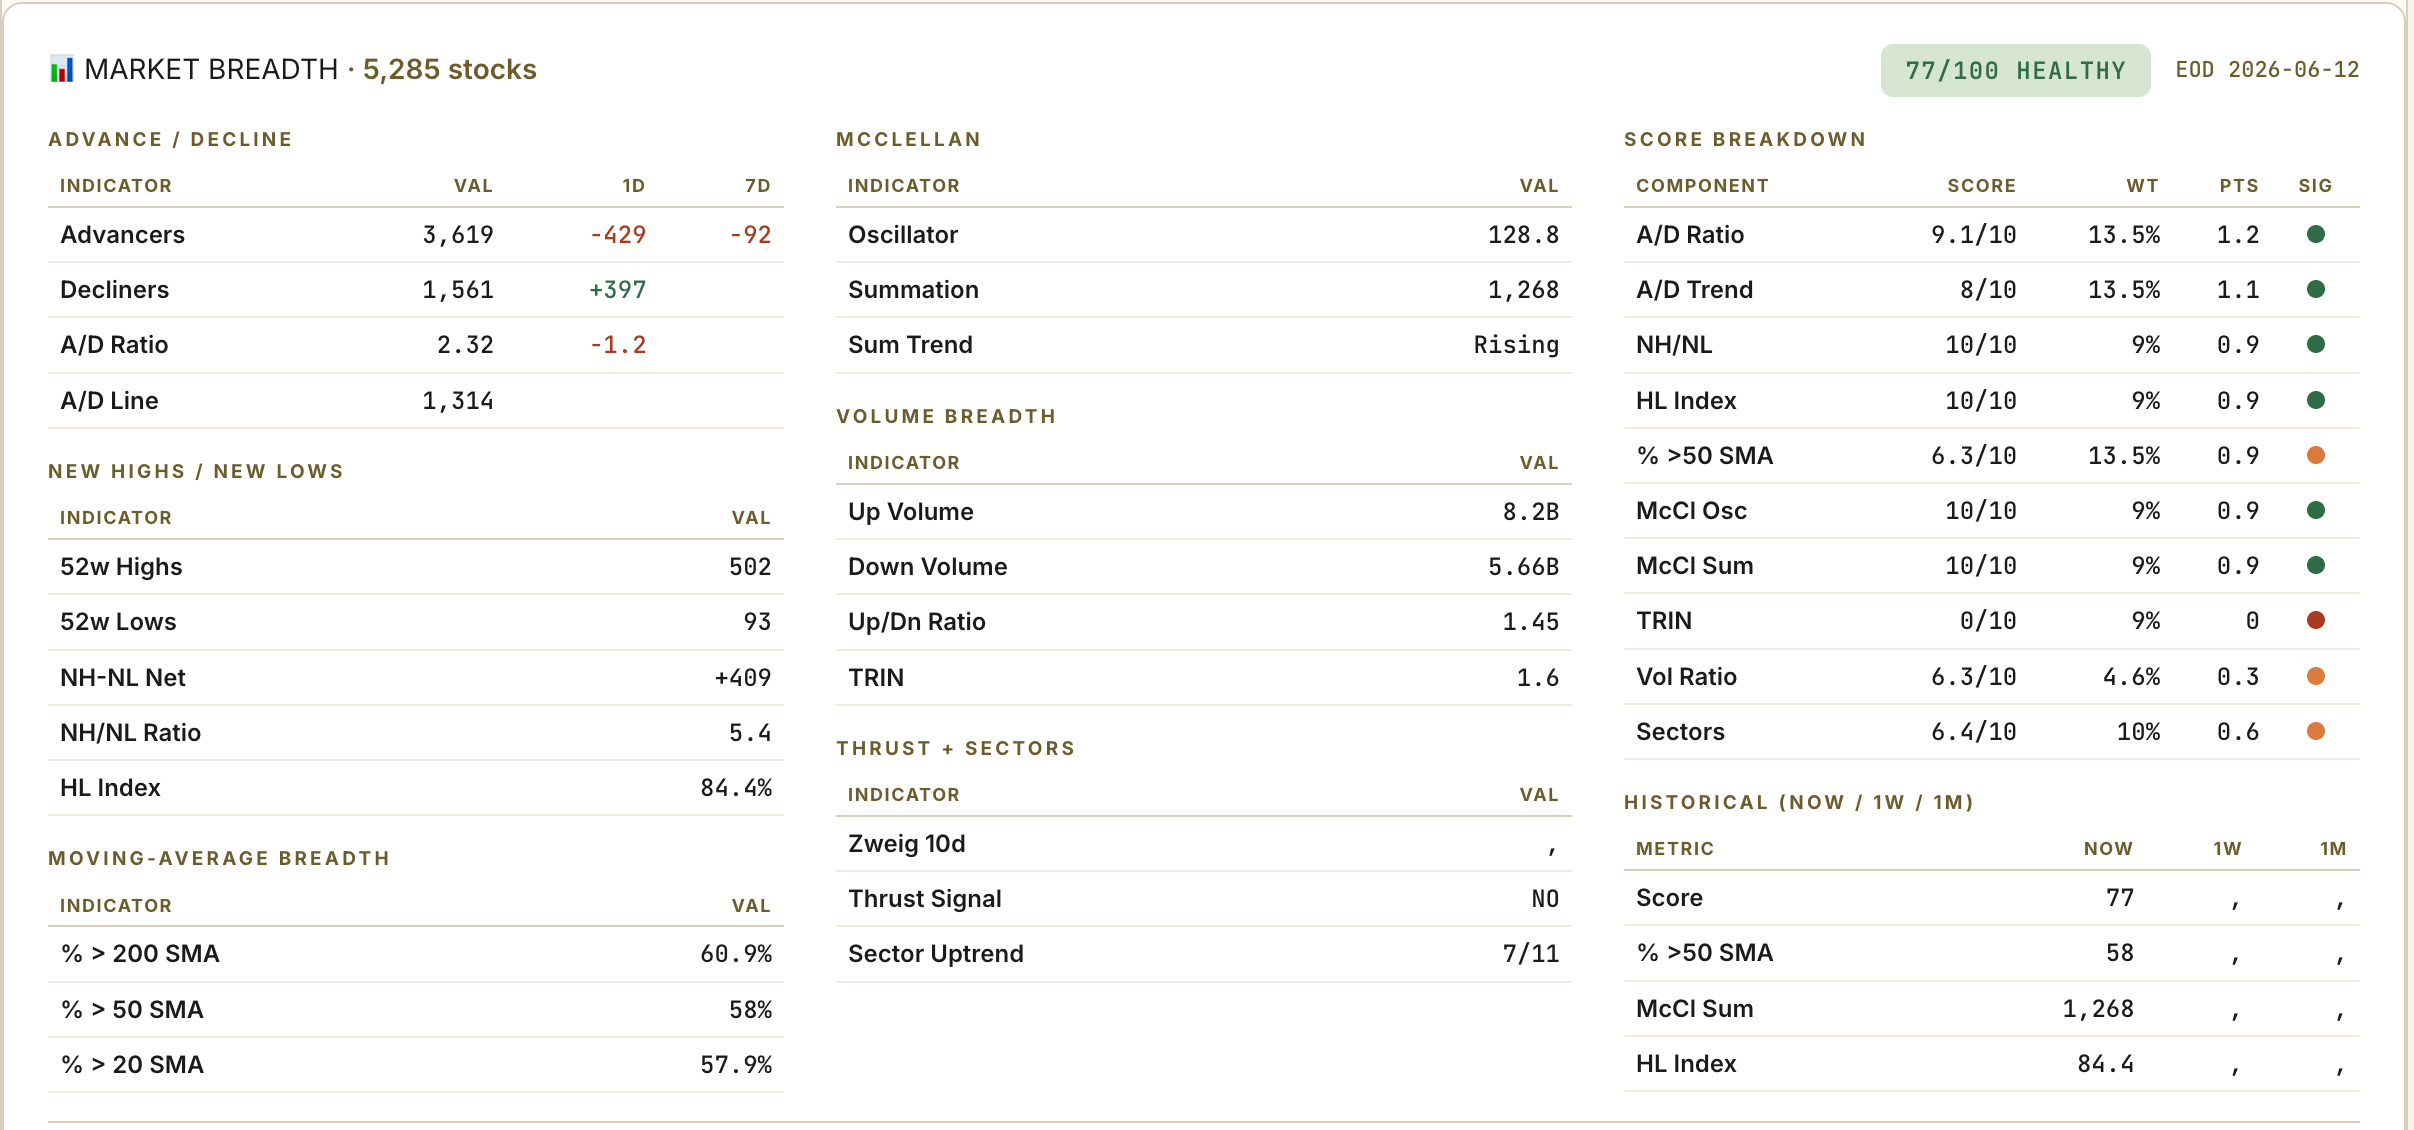
My market health score reads 77 out of 100, and that lands in healthy territory. Before you take that at face value, it helps to know what feeds the number, because the parts that built it this week are telling two different stories.
The first story is genuinely good, and it is about participation. More stocks went up than down by a wide margin, better than two to one. Even better, the number of stocks hitting fresh 52-week highs crushed the number hitting new lows, by more than five to one. That second figure matters more than people realize. New highs and new lows are the cleanest read on whether the average stock is actually healthy, because a stock cannot fake a 52-week high. When highs swamp lows by this much, it means the strength is broad, not just a handful of giant names dragging the index up while everything else quietly bleeds. The momentum measures I track, which smooth out the daily noise to show whether buying pressure is building or fading, are still climbing. On participation alone, this is a market in good shape.
The second story is the warning, and it lives in the volume. Here is the tension. More stocks rose than fell, but the heaviest trading happened on the stocks that fell. Put simply, the rally was wide but thin. A lot of stocks ticked higher, but the conviction behind them, the actual dollars changing hands, leaned to the cautious side. This is exactly the kind of bounce that institutions are willing to let happen without chasing it. They are not selling into it, but they are not backing up the truck either.
So how do I read the two stories together? The recovery is real and I am not fighting it. A solid majority of stocks are back above their longer trend, so nothing structural is broken, and the broad participation tells me the flush did not do lasting damage. But a bounce that the big volume will not confirm is one I keep on a short leash. I will believe the next leg higher when the volume shows up to back it. Until then, I treat this as a market that has stabilized rather than one that has taken off. That distinction is the difference between sizing up aggressively and staying measured, and this week it tells me to stay measured.
🚨 Sector Rotation
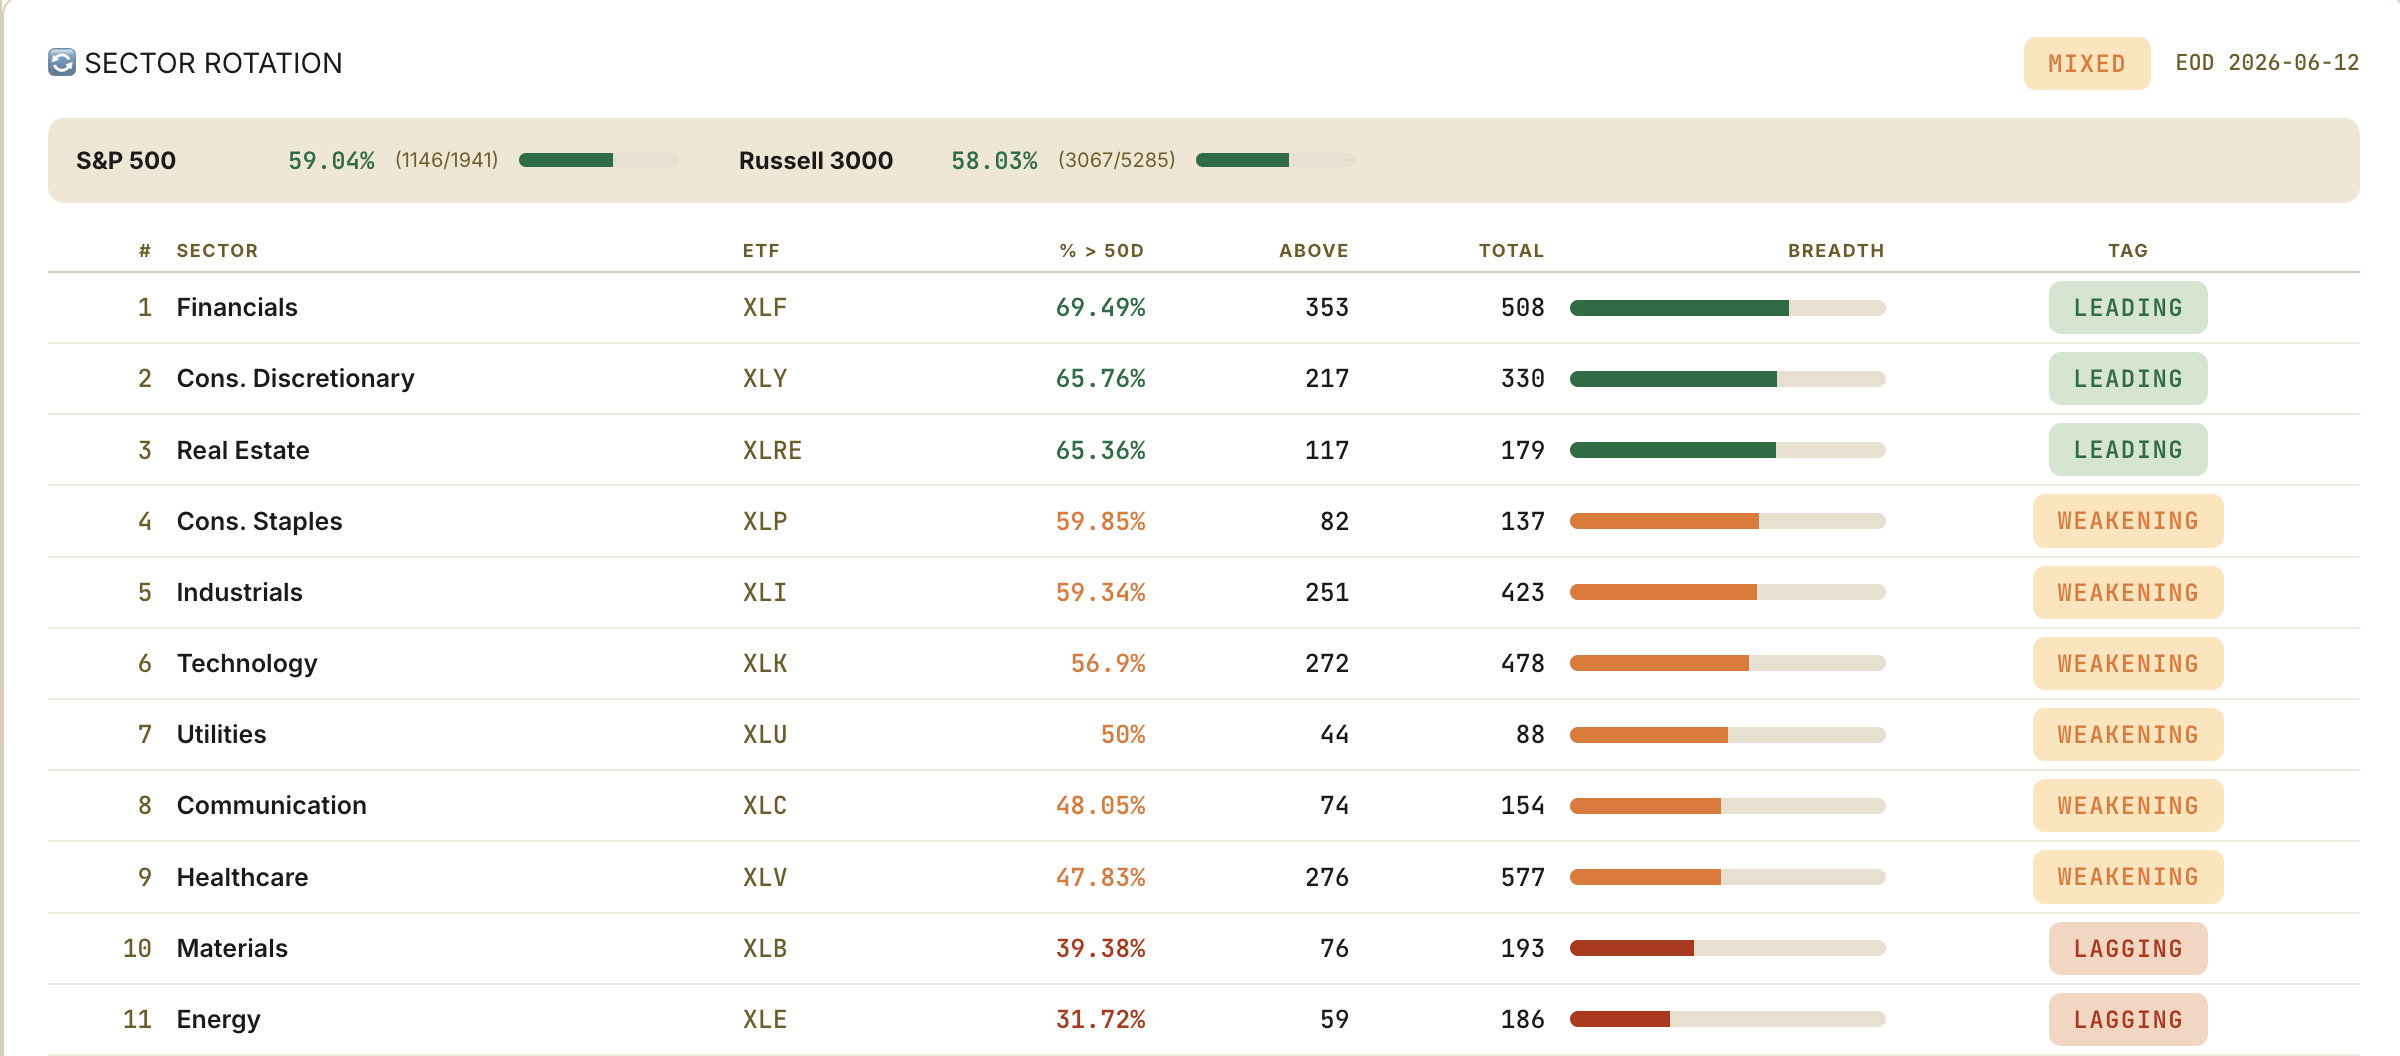
Three sectors stand clearly above the rest. Financials are out in front by a distance, with roughly seven in ten of their stocks in good shape. Consumer discretionary, the stuff people buy when they feel confident, sits right behind. Real estate rounds out the top three. Notice what these three have in common. Financials and real estate both live and die by interest rates, and discretionary lives off a confident consumer. That is a very specific bet the market is making: that rates behave and the economy holds up. It is a reasonable bet, but it is a concentrated one.
Below those three, almost everything else has slipped into the middle of the pack. A week ago, consumer staples were leading. This week they faded back, which is a small but telling shift, because staples are where money hides when it gets nervous. Technology improved a little but still is not leading, which matters given how much of the index those names represent. Industrials, utilities, communications, and healthcare are all drifting in that lukewarm middle zone, neither helping nor hurting.
At the very bottom, nothing has changed in a month. Materials and energy are dead last, and it is not close. Energy in particular has fewer than a third of its stocks in any kind of uptrend. This is the commodity side of the market, and it has been the persistent drag on the whole board.
Here is why the narrowing bothers me. Coming off a scare like last week, the healthiest thing a market can do is broaden out, with more and more sectors joining the recovery as confidence returns. That is the opposite of what is happening. The bid is crowding into a few favored corners while the rest fade. When a market gets choosier like this, it is a sign that buyers are still being selective rather than confident across the board. Off a low, that is something to respect, not to ignore. And there is a specific risk attached. The two leaders actually doing the work, financials and real estate, are the most sensitive to interest rates of any group in the market. If the Bank of Japan jolts global bond yields on Monday, which I will get to, those exact leaders are the ones most in the line of fire.
🔍 Pairs Alignment
The next thing I check is how different assets are moving relative to each other, because the relationships between markets often warn you before any single market does. Think of it as listening for one instrument playing out of tune in an orchestra. Most of the time everything moves together in a way that makes sense, and when one pair starts pulling apart, it is worth asking why.
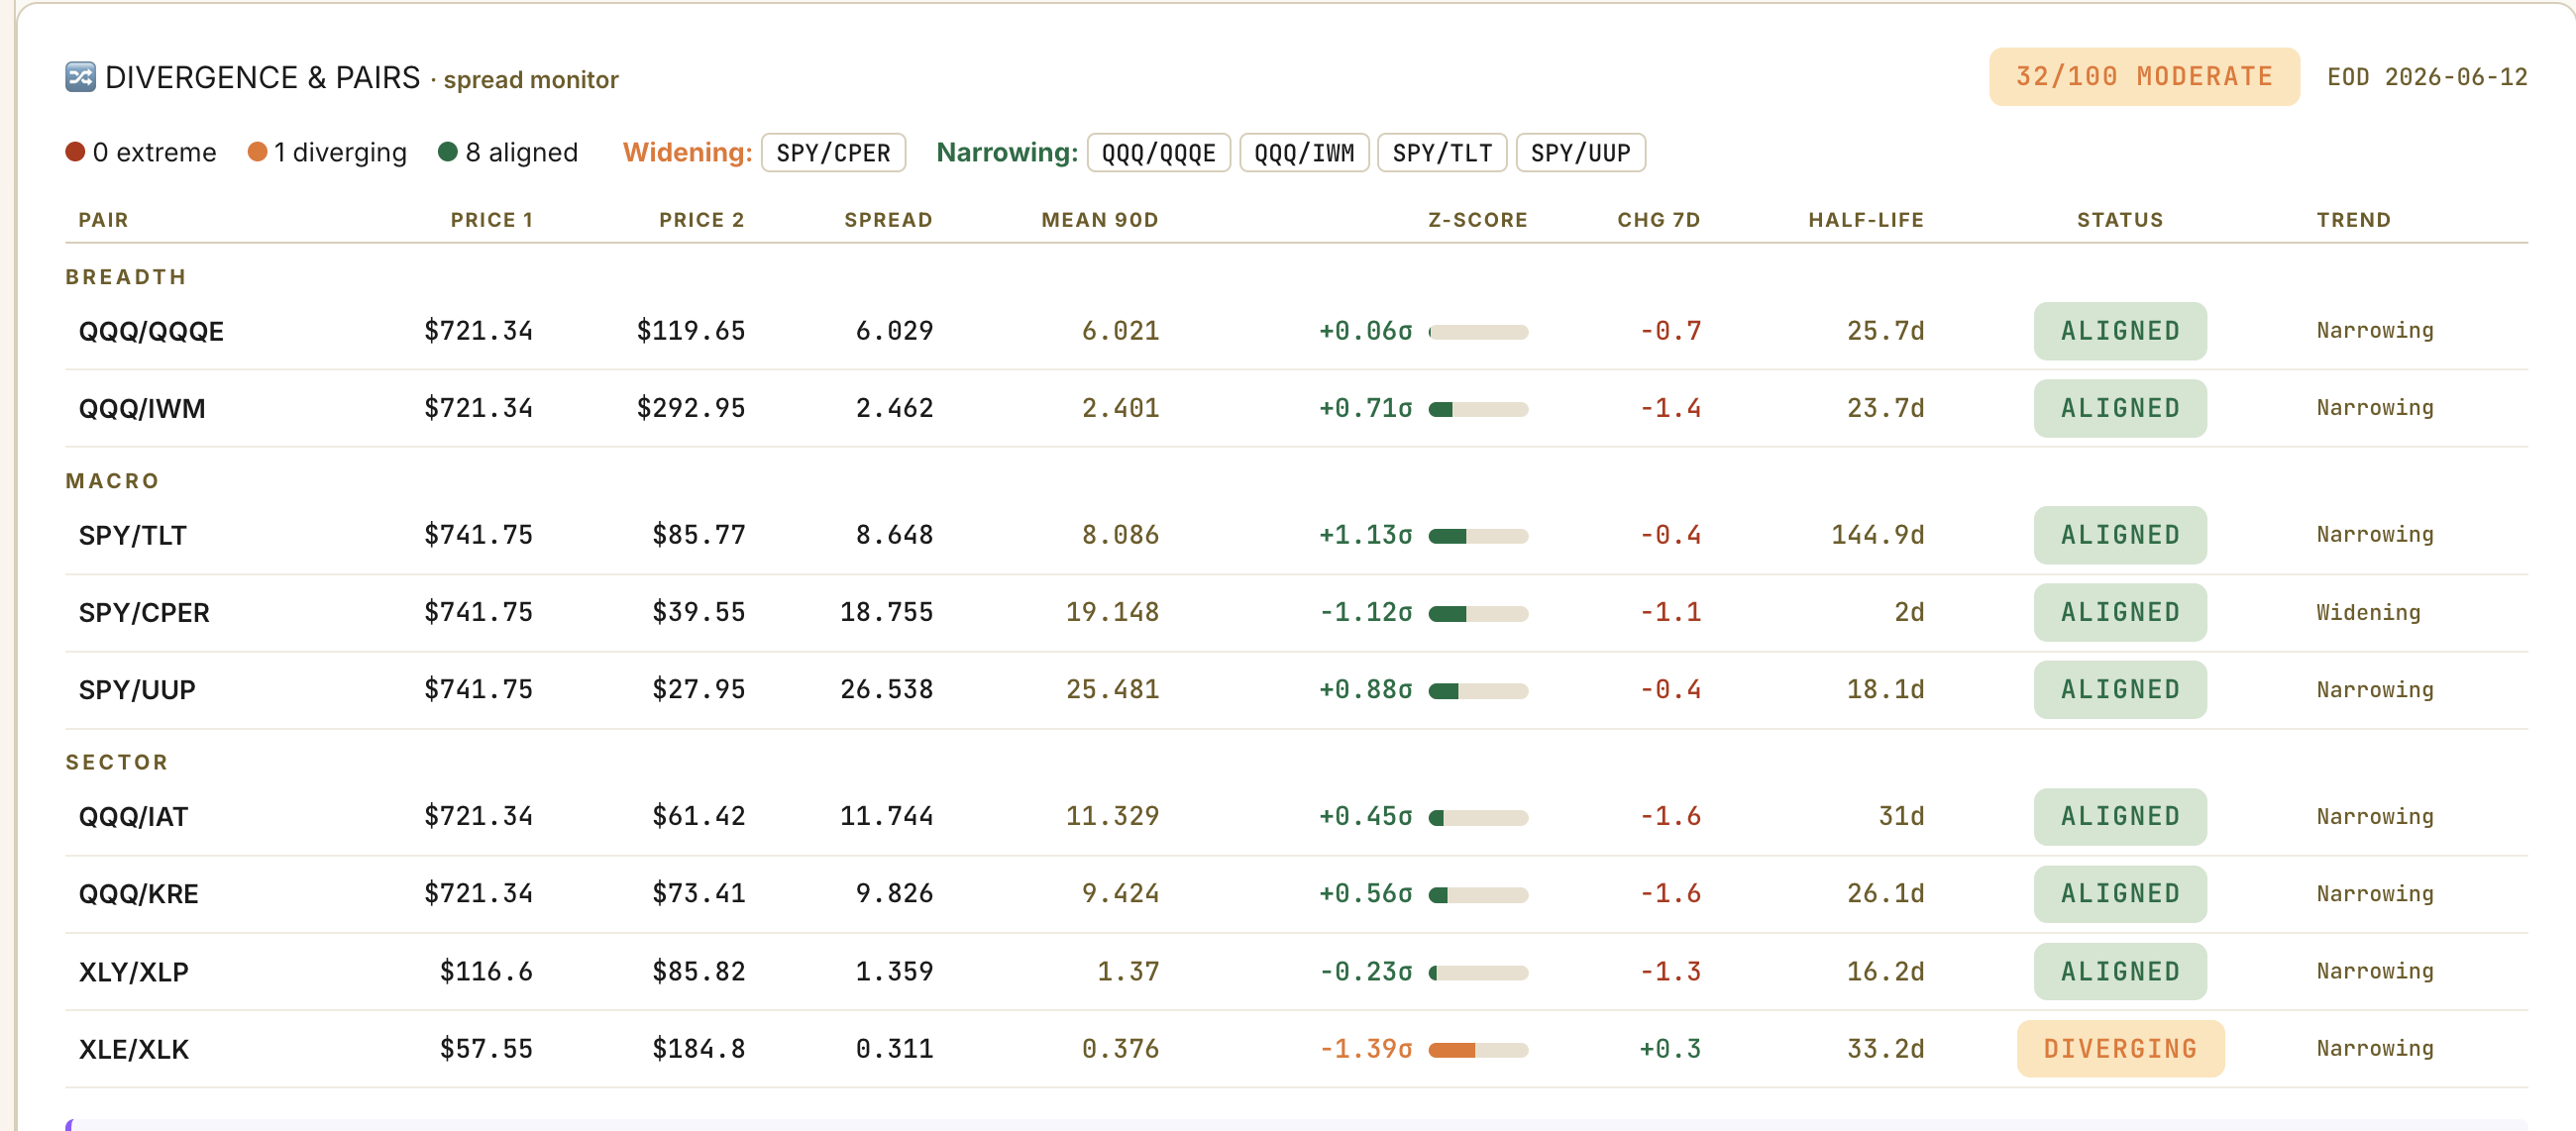
Right now the overall divergence reading is moderate, which is a step up from calm but nowhere near alarming. Most of the pairs I follow are behaving. Stocks against bonds, big tech against small companies, the dollar against its peers, all of these sit close to their normal range, and several are actually drifting back toward the middle, which reduces stress rather than adding it. That is a comforting backdrop. It means there is no hidden fracture building up across the financial system this week.
There is one exception, and it is the same one that keeps showing up. Energy is badly lagging technology, stretched further apart than any other pair on my board. This is not a new signal and it is not a mystery. It is the same weakness the sector screen flags, just measured a different way. Energy simply cannot keep pace, and when one major sector falls this far behind, it is worth keeping in view even if it is not flashing red.
The other relationship I am watching is stocks against copper. Copper is sometimes called the metal with a PhD in economics, because it goes into everything that gets built, so its price tends to track the real health of the global economy. Right now stocks are pulling away from copper, climbing while the metal lags. That gap can resolve two ways. Either the stock market is right that growth is fine, and copper catches up. Or copper is right that the real economy is softer than stocks believe, and equities are running ahead of the fundamentals. I do not have a strong view yet. For now I am simply watching it, and I would get more cautious if that gap kept widening while the leadership stayed narrow.
📉 Volatility
Volatility is just the market’s price for fear. When traders are scared, they pay up for protection and the fear gauges rise. When they are comfortable, those gauges drift lower. Reading them well is one of the most useful edges you can have, because the price of fear often tells you more than the price of stocks.
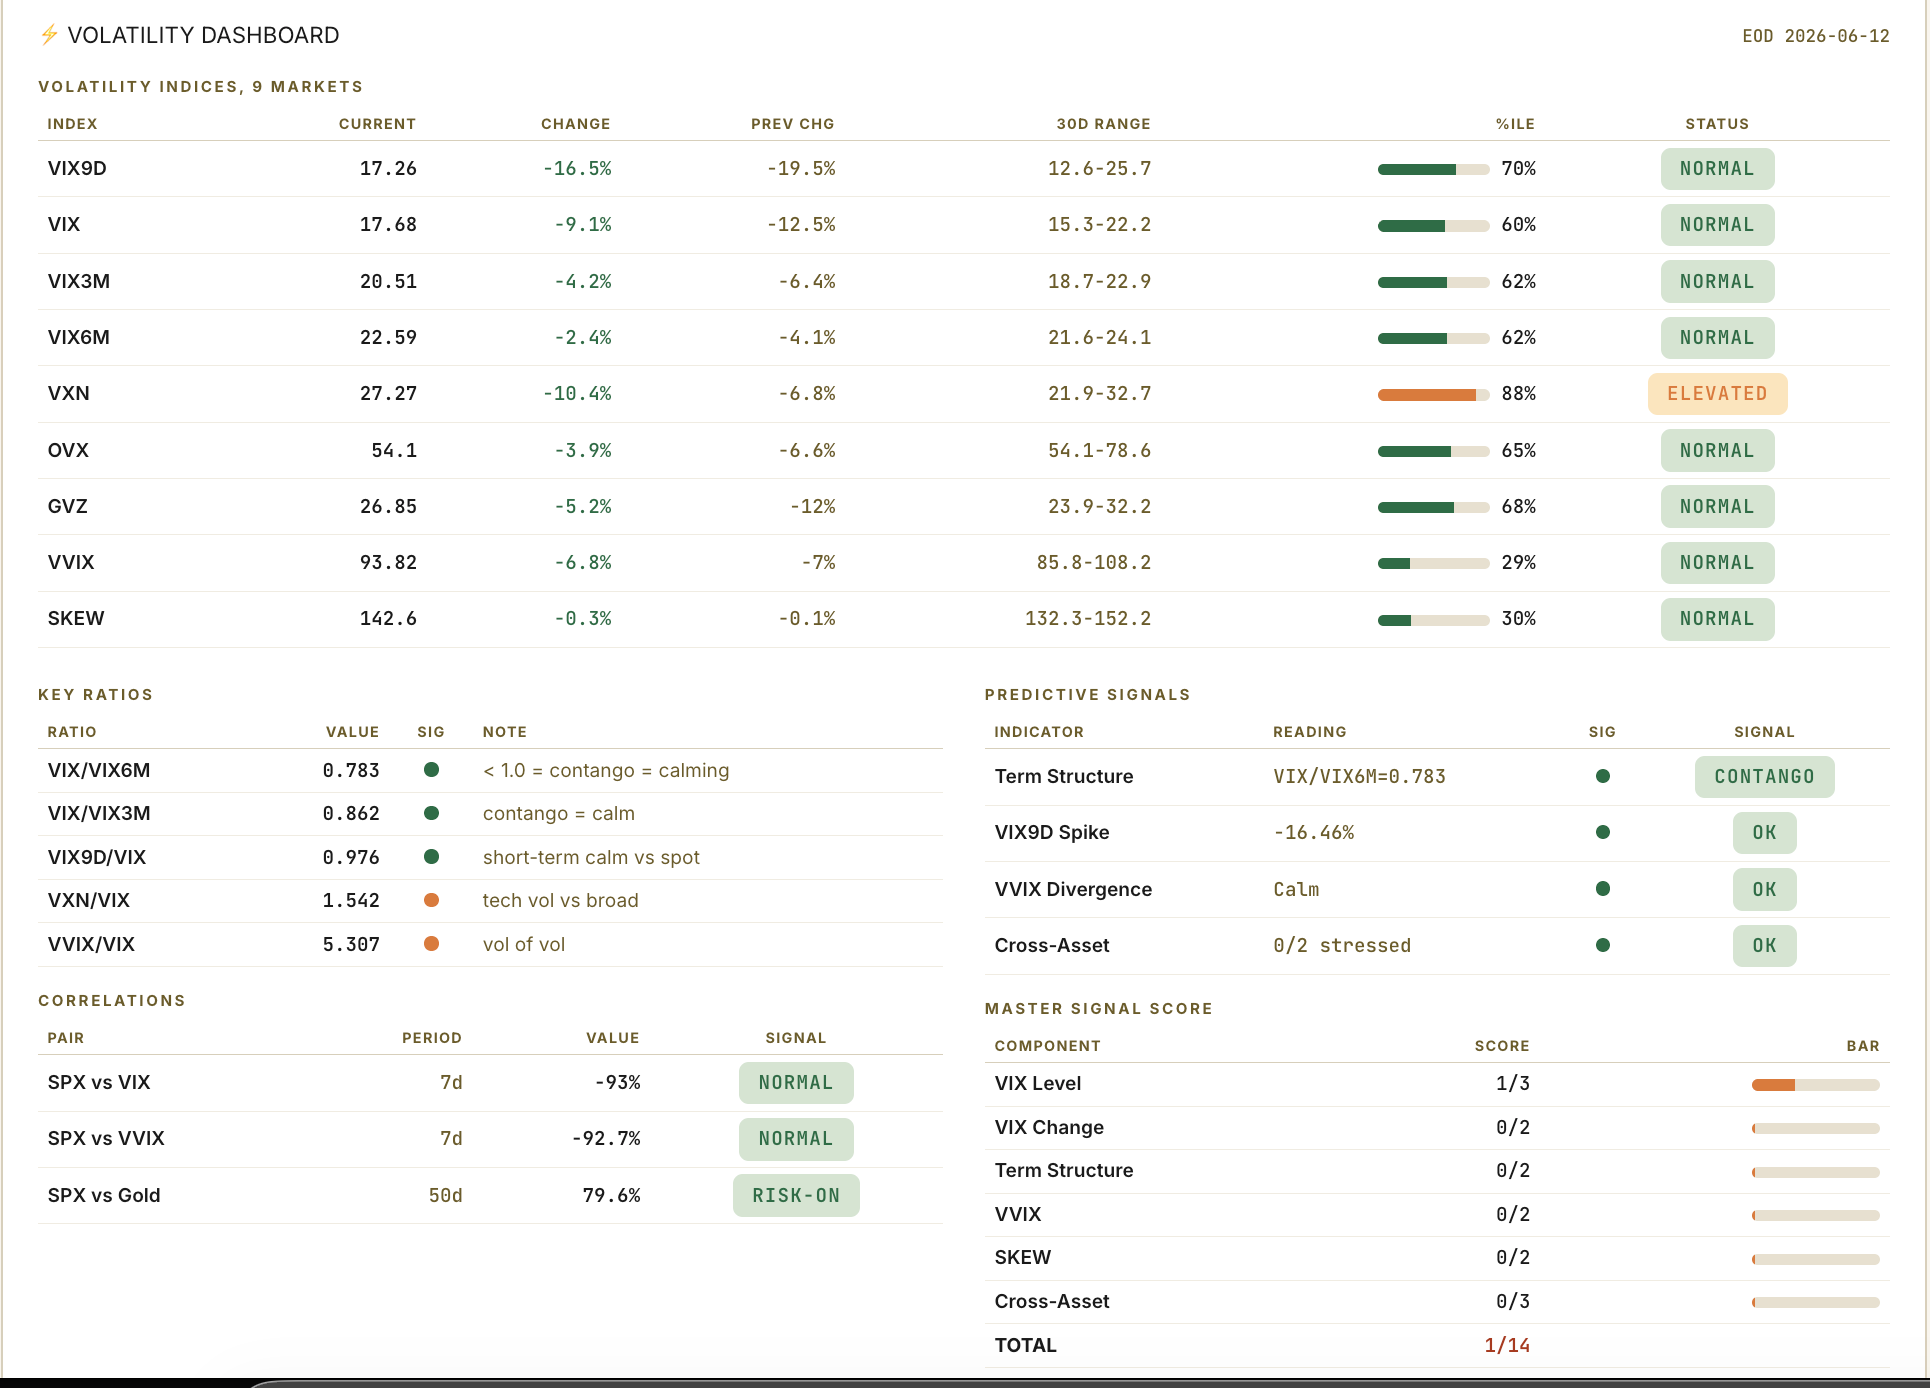
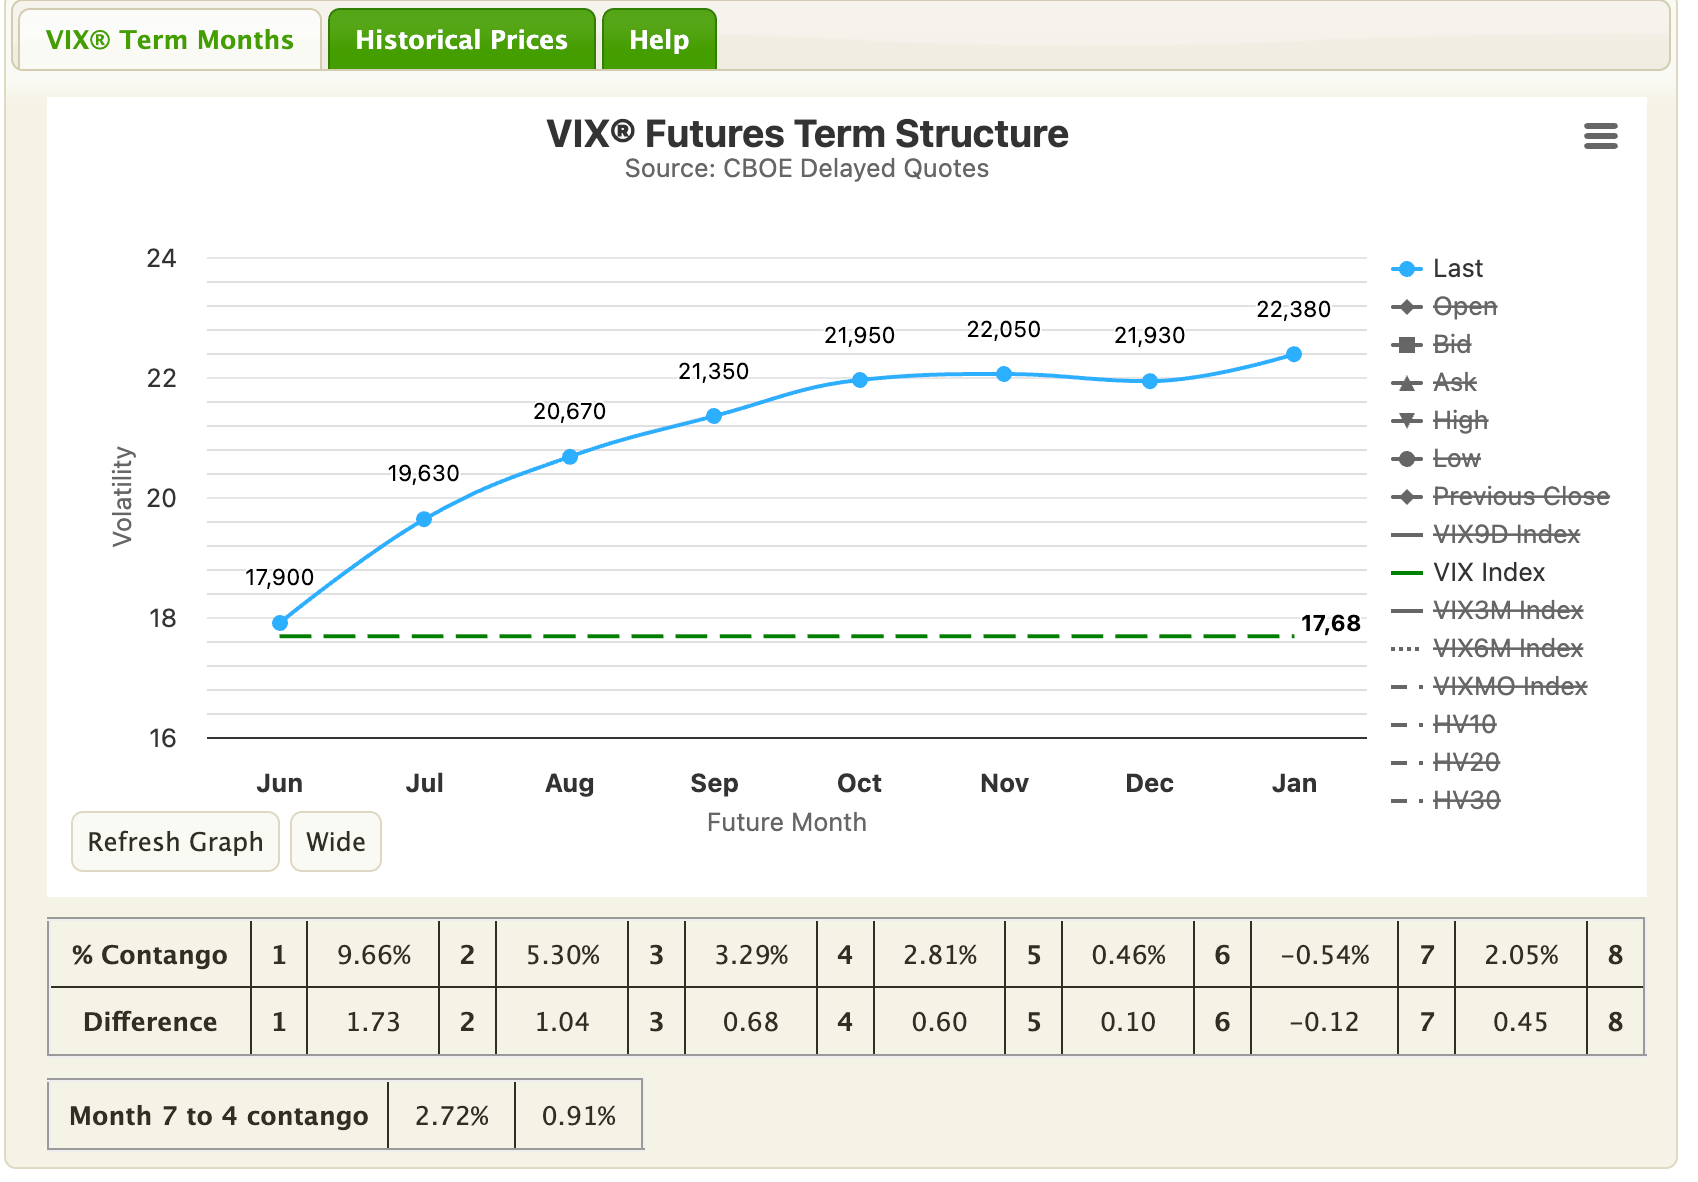
Right now, almost every gauge says calm. The main fear index sits in the middle of its normal range. The structure of fear over time, which compares what traders expect over the next month against the next six months, is in its normal upward slope. That slope matters. It means traders expect things to be calmer in the short run than further out, which is the shape you get when nobody sees trouble coming soon. The futures that track expected fear over the coming months reinforce this, sloping gently higher from here into year-end with no spike anywhere. My overall fear score, which adds all of this up, reads about as low as it gets. On the surface, the market could not be more relaxed.
There is one gauge that refuses to join the calm, and it is the one tied to big technology stocks. Fear priced into the Nasdaq names is running well above the fear priced into the broad market, sitting up near the high end of its own range while everything else naps. This is the only nervous reading on the entire screen, and it fits perfectly with what the breadth and sector screens already told us. The market is comfortable about stocks in general and twitchy specifically about big tech, the same group that is no longer leading. When three different screens all point at the same soft spot, I pay attention.
Now the part that actually matters for next week. All of this calm is being priced just three days before a central bank meeting that can move every market on earth. That is the danger in cheap insurance. When protection is this inexpensive ahead of a known, scheduled event with two very different possible outcomes, you are not being paid much to take the other side. The market is treating Monday as a non-event. History says scheduled central bank surprises are exactly where the quiet ends abruptly. If you have wanted to add some downside protection, this is the rare moment when it is genuinely cheap to do so.
💱 FX
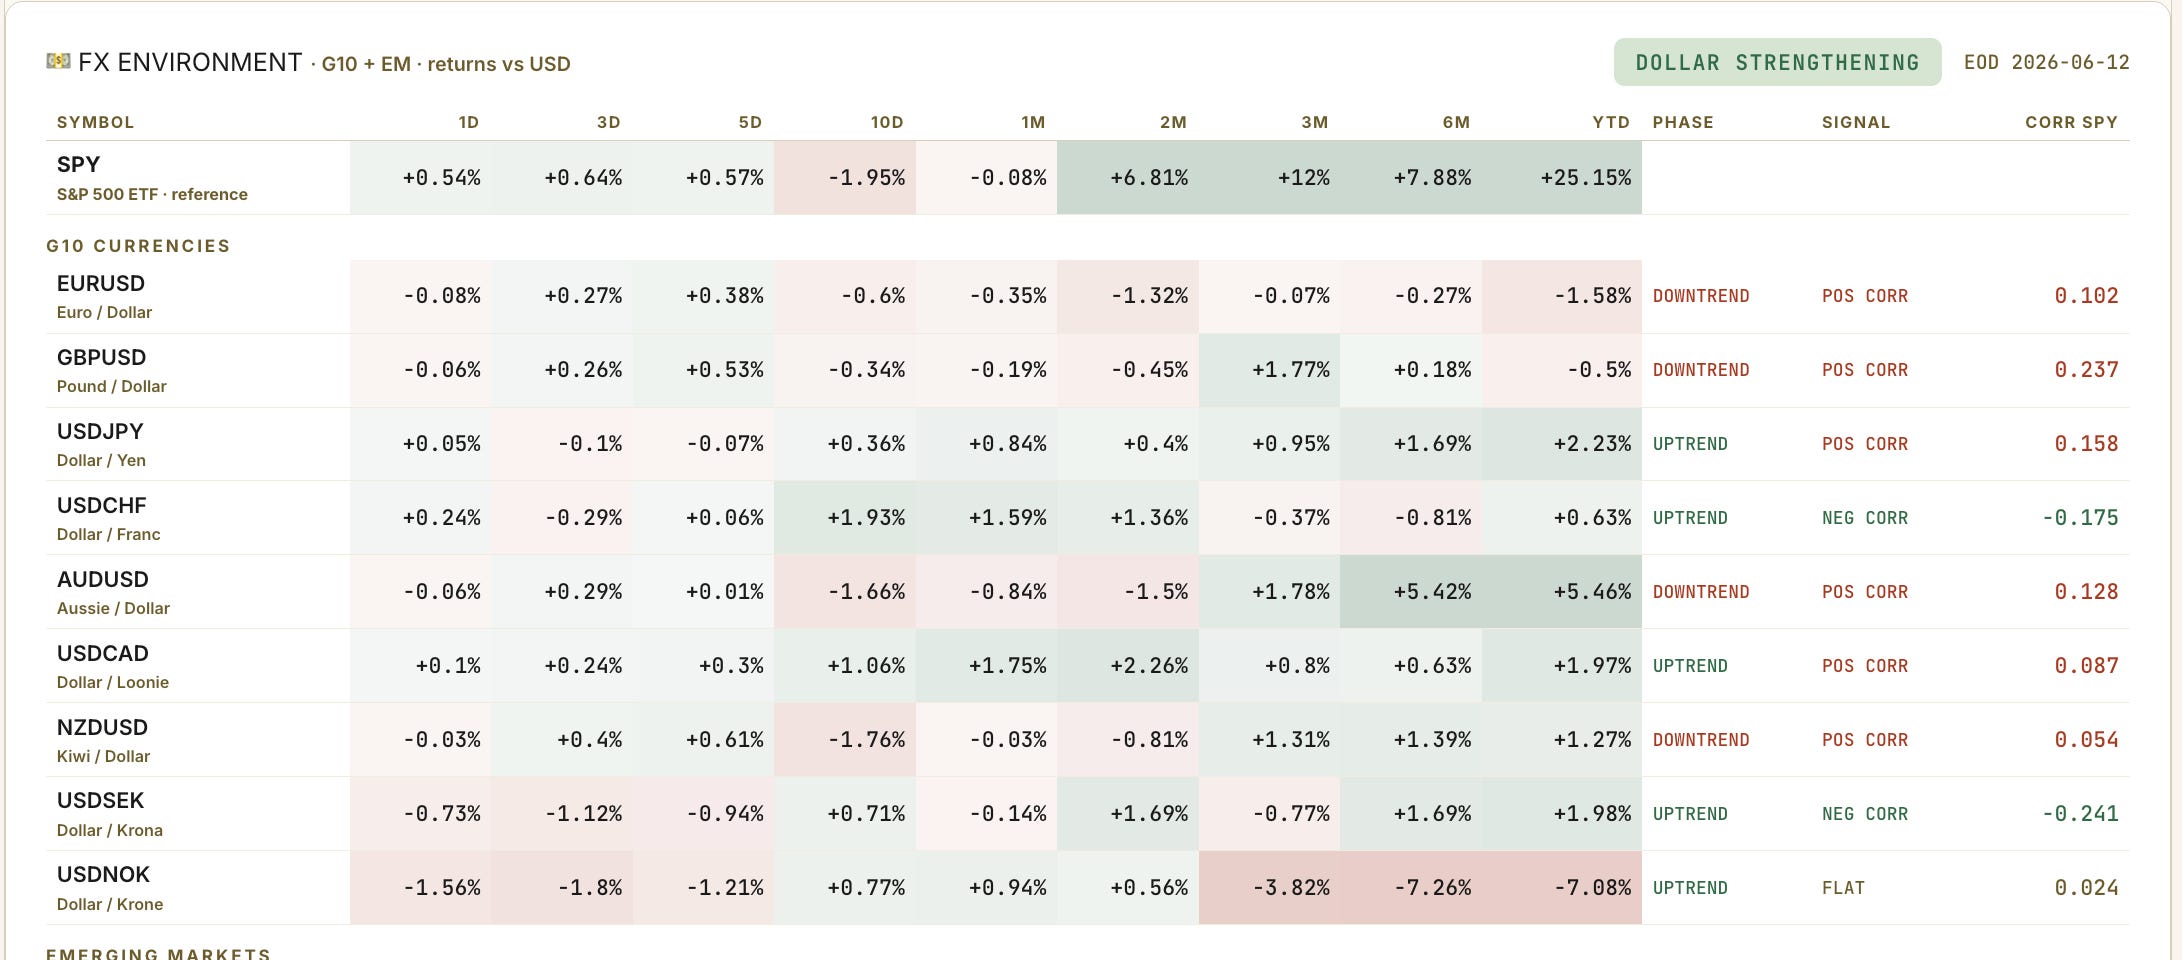
The dollar is firm against almost everything, grinding steadily higher. The currency that matters most right now is the Japanese yen, and it keeps drifting weaker, sitting near a line around 160 to the dollar. That line is not random. Earlier this spring, Japan’s own government spent an enormous amount of money, well over seventy billion dollars, buying yen to stop it from falling past that level. The market absorbed all of that intervention and pushed the yen right back to where it started. When a government spends that much to defend a line and the market erases it, that tells you how strong the underlying pressure is.
Here is why a sleepy currency is the biggest risk on the board. On Monday and Tuesday, the Bank of Japan meets, and almost everyone expects it to raise interest rates. Because that rate hike is so widely expected, the hike itself is not the danger. The danger is what they say about the future. For years, Japan kept interest rates near zero, which made the yen the cheapest money in the world to borrow. Big investors everywhere borrowed cheap yen and used it to buy higher-returning assets all over the globe, from American tech stocks to bonds in emerging markets. This is called the carry trade, and it is one of the largest hidden sources of fuel in global markets. It works beautifully as long as the yen stays weak and Japanese rates stay low.
The moment that changes, the trade runs in reverse. If the Bank of Japan signals that more hikes are coming faster than expected, the yen can snap sharply higher. Everyone who borrowed cheap yen suddenly has to buy yen back to repay those loans, all at once, and they have to sell whatever they bought to do it. That selling does not stay politely inside the currency market. It travels straight into stocks, because the assets being dumped are stocks. We saw exactly this in August 2024. A single modest hike and a few hawkish words from Tokyo set off a global unwind that took markets down sharply around the world in a matter of days. That was the dress rehearsal. This is the kind of event that can override every healthy reading in the rest of this letter in a single session, and as the volatility section just showed, the market is charging almost nothing to protect against it.
🧠 My Take
Let me put it all together. The bounce off last week’s flush is real, and the broad participation tells me the selling was a positioning shakeout, not the start of a bear market. That is the good news, and it is why I am not bearish. The caution comes from three places. The volume did not confirm the bounce. The leadership is narrow and concentrated in the most rate-sensitive corners. And a central bank meeting that can hit those exact corners is few days away with almost no fear priced in. I lean constructive, but I am carrying real respect for the Monday risk, and my positioning reflects both.
Here is how I see the week breaking down.
The orderly path, my base case at roughly 50 percent. The Bank of Japan raises rates as everyone expects and signals patience about what comes next. The yen stays calm through the meeting. With the event out of the way, the buyers who sat out this week’s thin bounce finally commit real money, the leadership broadens beyond those three sectors, and the market grinds higher from here. The strong participation we already see supports this outcome more than any other.
The carry shock, the real risk at roughly 35 percent. The Bank of Japan hikes and signals that more is coming, faster. The yen snaps higher, the carry trade starts to unwind, and a market that just bounced on light volume gives those gains back quickly. The rate-sensitive leaders, real estate and financials, get hit first and hardest, precisely because they led on the way up.
The stall, the leftover at roughly 15 percent. Nothing resolves cleanly. The volume stays missing, the narrow leadership cannot widen, and the market chops sideways below its recent highs while it waits for the next catalyst.
What this means for how I am positioned. I am staying in the market, tilted toward the three leaders and away from the commodity laggards that keep dragging. I am holding extra cash through Monday so I have room to act on whatever the meeting brings. Because protection is so cheap right now, I have a little downside insurance on, which costs me almost nothing if the orderly path plays out and saves me real pain if the carry shock hits. And I am ready to cut quickly if the yen forces the issue. The whole point of preparation is that you do not have to think when the moment arrives.
🔎 Options Flow — Smart Money Positioning
The last thing I check is the options flow, the large, unusual bets that show up in the market for stock options. These are useful because options are where informed money often moves first, since they offer leverage and a way to bet on a specific move by a specific date. When someone pays a large premium for a narrow bet, they usually believe something.
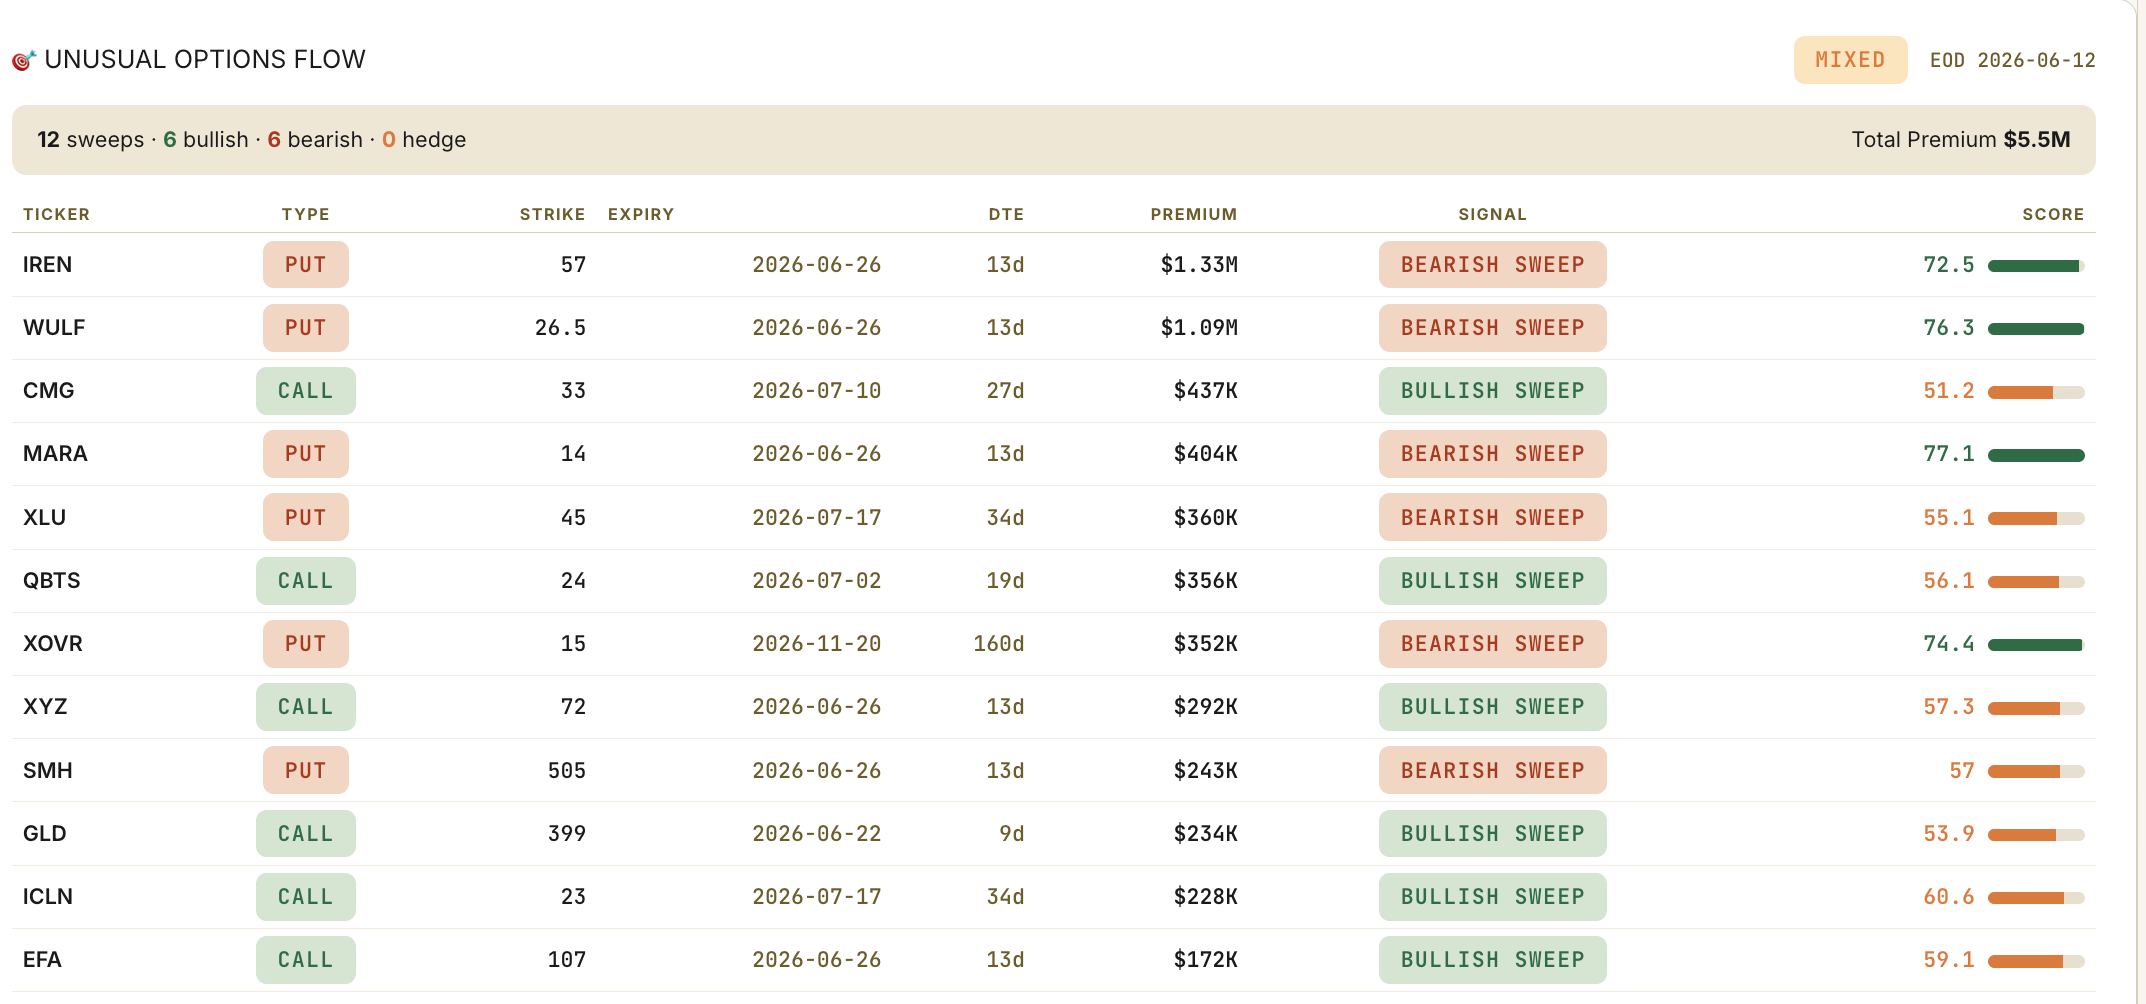
This week there were a dozen large unusual trades, and on a simple count they split evenly, half betting up and half betting down. The even count hides the real story, though, because the conviction was not even at all. The biggest, highest-confidence trades on the entire board were all bearish, and they piled into one place: the crypto and AI-power miners. Three of these names drew the largest premium of the week, all of it in puts, which are bets that the stocks fall. When the most aggressive money on the board concentrates in one small group like this, betting it rolls over within two weeks, that is a cluster worth respecting.
The rest of the bearish bets pressed exactly where the rest of this letter is already soft. There were large put positions in the semiconductor group and in utilities, the two corners that the breadth, sector, and volatility screens have all flagged as weak. When the flow lines up with the internals like that, it strengthens the read rather than muddying it.
The bullish bets are interesting for where they reached, which was almost entirely outside of big US technology. Money bought upside in gold, in clean energy, in international developed markets, and in a major consumer name. Nobody was paying up for the index leaders or for the big tech names everyone talks about. Step back and the picture is consistent. Under a calm-looking tape, the money that moves with real intent is leaning defensive and reaching away from the crowded American tech trade.
🔥 Trade of the Week:
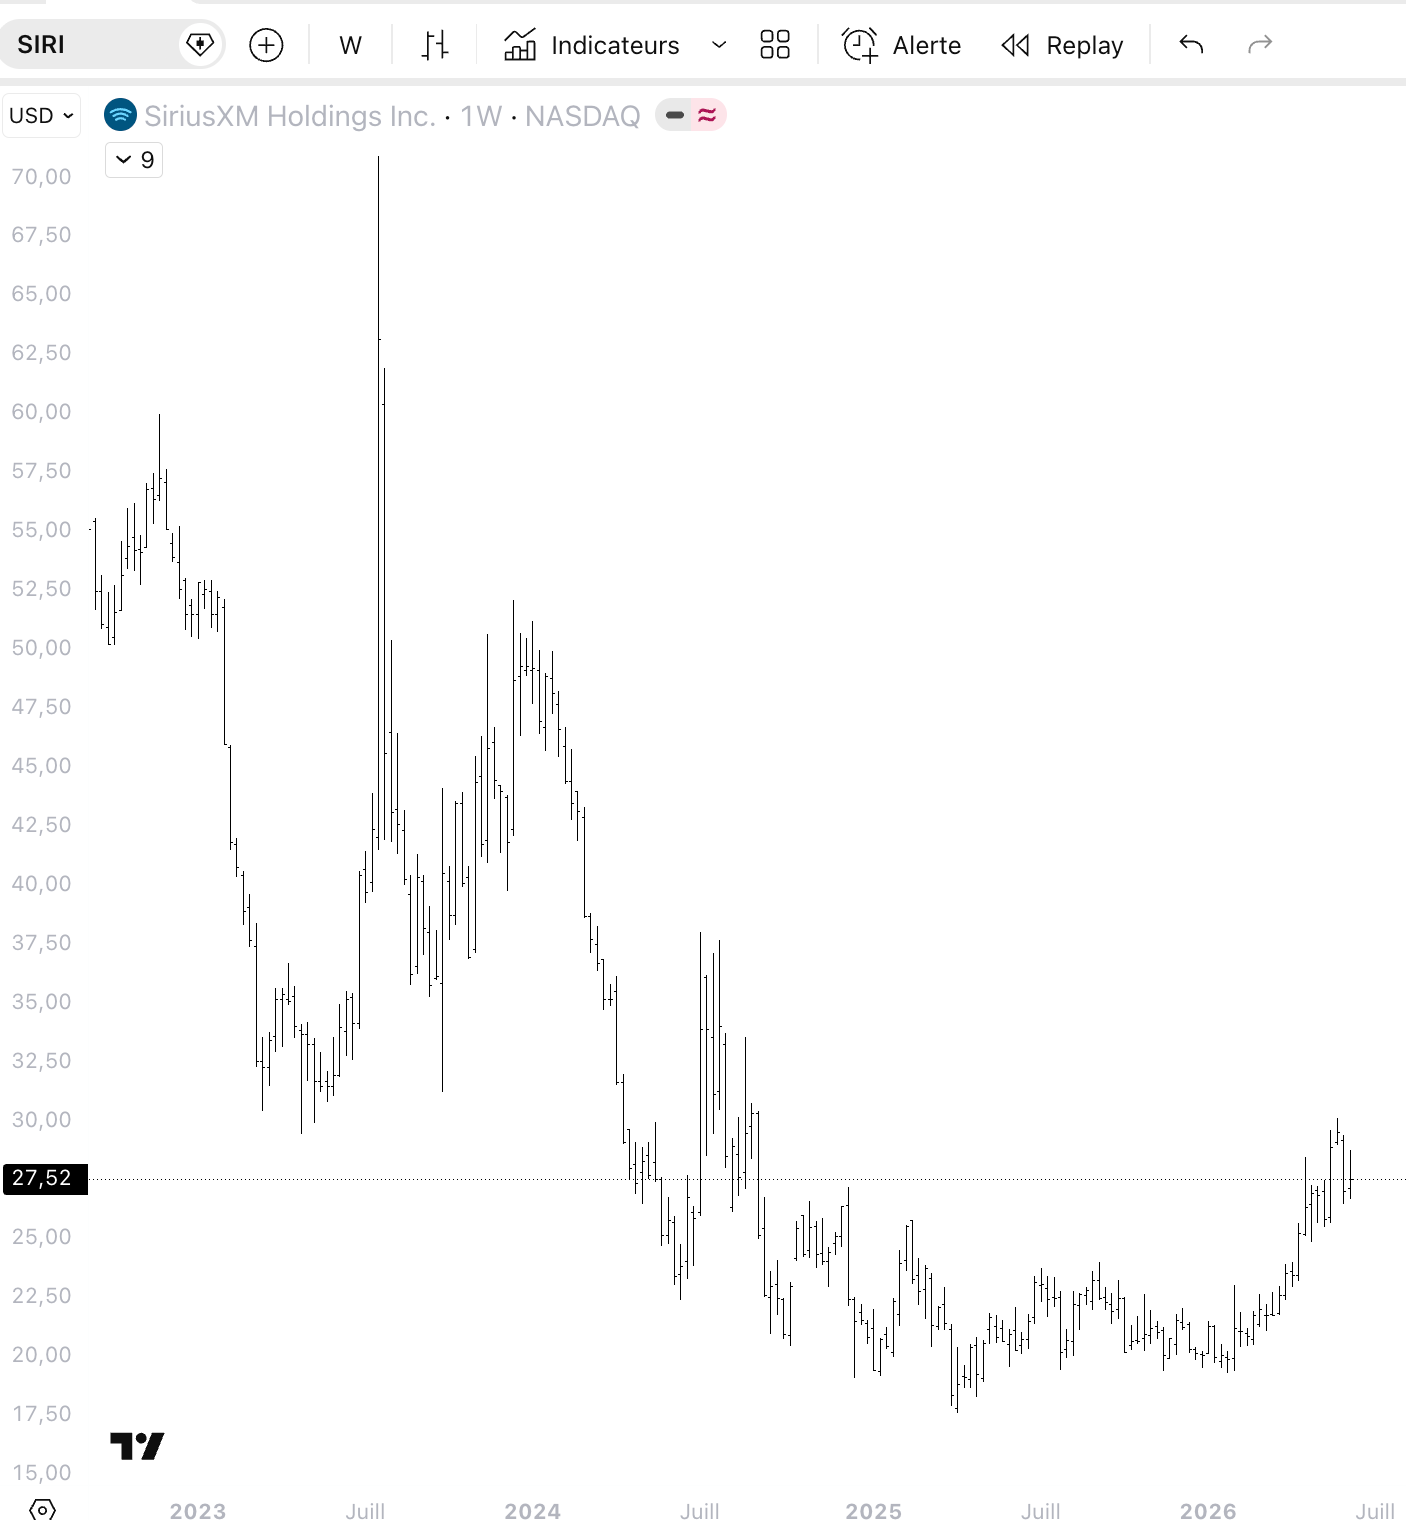
At about $27.50, you are buying the only satellite radio monopoly in America at a free cash flow yield near 14%, with Warren Buffett’s Berkshire Hathaway as a 37% owner that keeps buying the dips.
The market left this stock for dead, down roughly 50% over five years against Apple, Spotify, and YouTube. Then the story changed. Cost cuts landed, free cash flow jumped, and the stock has climbed about 35% in 2026. It ran to a high near $30, then pulled back about 8% without breaking trend. That pullback is the entry.
Here is the mispricing. Wall Street still prices SiriusXM like a dying business, with Sell ratings and targets as low as $18. But against a $9.3 billion market cap, management guides to $1.35 billion of free cash flow this year, a yield near 14%, on a stock trading around 11 times earnings. The first quarter beat across the board, free cash flow tripled from a year earlier, and churn just hit a record low. 2026 is set to be the first year revenue stops falling in three. The price assumes the business keeps shrinking, so leveling off alone re-rates it higher.
It also fits the week. While the whole letter worries about Tokyo and the carry trade, SiriusXM sits outside all of it, a subscription paid in dollars by Americans in their cars. One honest note: it lives in Communication Services, a weaker group on my own screen, not a leader. I am fine with that. I am not buying it for its sector, and a name this uncorrelated does not need a strong one behind it. My pullback screener flagged it, and part of the recent buying is mechanical, since it just joined the S&P MidCap 400 on June 11.
Entry zone: $26.50 to $27.50
Stop: $25.48
Target 1: $30
Target 2: $32
Value target: high $30s to $45 (re-rating case, Street’s high target)
Sizing: small, scale in
The real risk is the debt, with enterprise value near twice the market cap. But that same free cash flow covers the dividend and the interest with room to spare, and Warren Buffett, who owns 37%, keeps buying near a $32 average, above today’s price. When the most patient money on earth is sitting on a loss on purpose and still adding, that is the asymmetry. I keep it small, respect the debt, and let the stop do its work.
To get the most out of these market recaps and understand the framework behind my observations, I encourage you to read about my methodology here.
See you next week,
Daniel
Disclaimer
This newsletter is for educational and informational purposes only. It is not financial advice.
The content reflects personal opinions shared publicly as a journal. Trading stocks, options, futures, or any financial instrument involves significant risk. You can lose your entire investment. There is no guarantee of profit.
The author is not a registered investment advisor, broker, or financial professional with any regulatory authority including the SEC or CFTC. Always consult a licensed financial advisor before making any investment decisions.
By reading this newsletter, you accept full responsibility for your own trading and investment choices. Past performance does not guarantee future results. Markets are unpredictable.
Screenshots are courtesy of TradingView, VixCentral, and other platforms with which the author has no affiliation. Information shared may contain errors or become outdated quickly.
This content is the intellectual property of the author. Copying or redistributing without permission is prohibited.
By continuing to read, you acknowledge and accept these terms.
Read the desk every week
Market analysis in plain English, plus the app that scans the whole US market for you.
Become a member Read the original on Substack ↗