The Nasdaq Lost 4%. Almost Nothing Else Broke.
Market Recap — July 18th 2026 · The Philosopher Investor
2026-07-18 · 11 min read · Originally published on Substack ↗


Hello my friends,
On Tuesday the biggest banks in America opened earnings season with a blowout. Goldman printed well north of what the Street modeled, JPMorgan and Morgan Stanley followed, and financials finished the week on top of my leadership board at 76.4% internal strength, stronger than where they started. And the index fell anyway. The S&P gave back about 1.5% on the week. Set those two facts side by side, because together they are the story: the market’s strongest sector reported from strength, and the tape sold off regardless.
It sold off in one place. The Nasdaq 100 dropped 4.2% on the week while the equal-weight S&P lost 0.4% and small caps 0.7%. That gap is the whole point. This was not a broad decline. It was a top-heavy one. The money came out of the corner that has carried this market all year, mega-cap technology, and the average stock hardly moved.
Four weeks running I have told you the risk lived in the tech corner, and that if you hedge anything, you hedge the tech corner and leave the index alone. This week the tech corner is where it broke, on a fresh scare over how much these companies are about to spend, and the rest of the market watched from a safe distance.
To get the most out of these market recaps and understand the framework behind my observations, I encourage you to read about my methodology here.
📊 Market Health
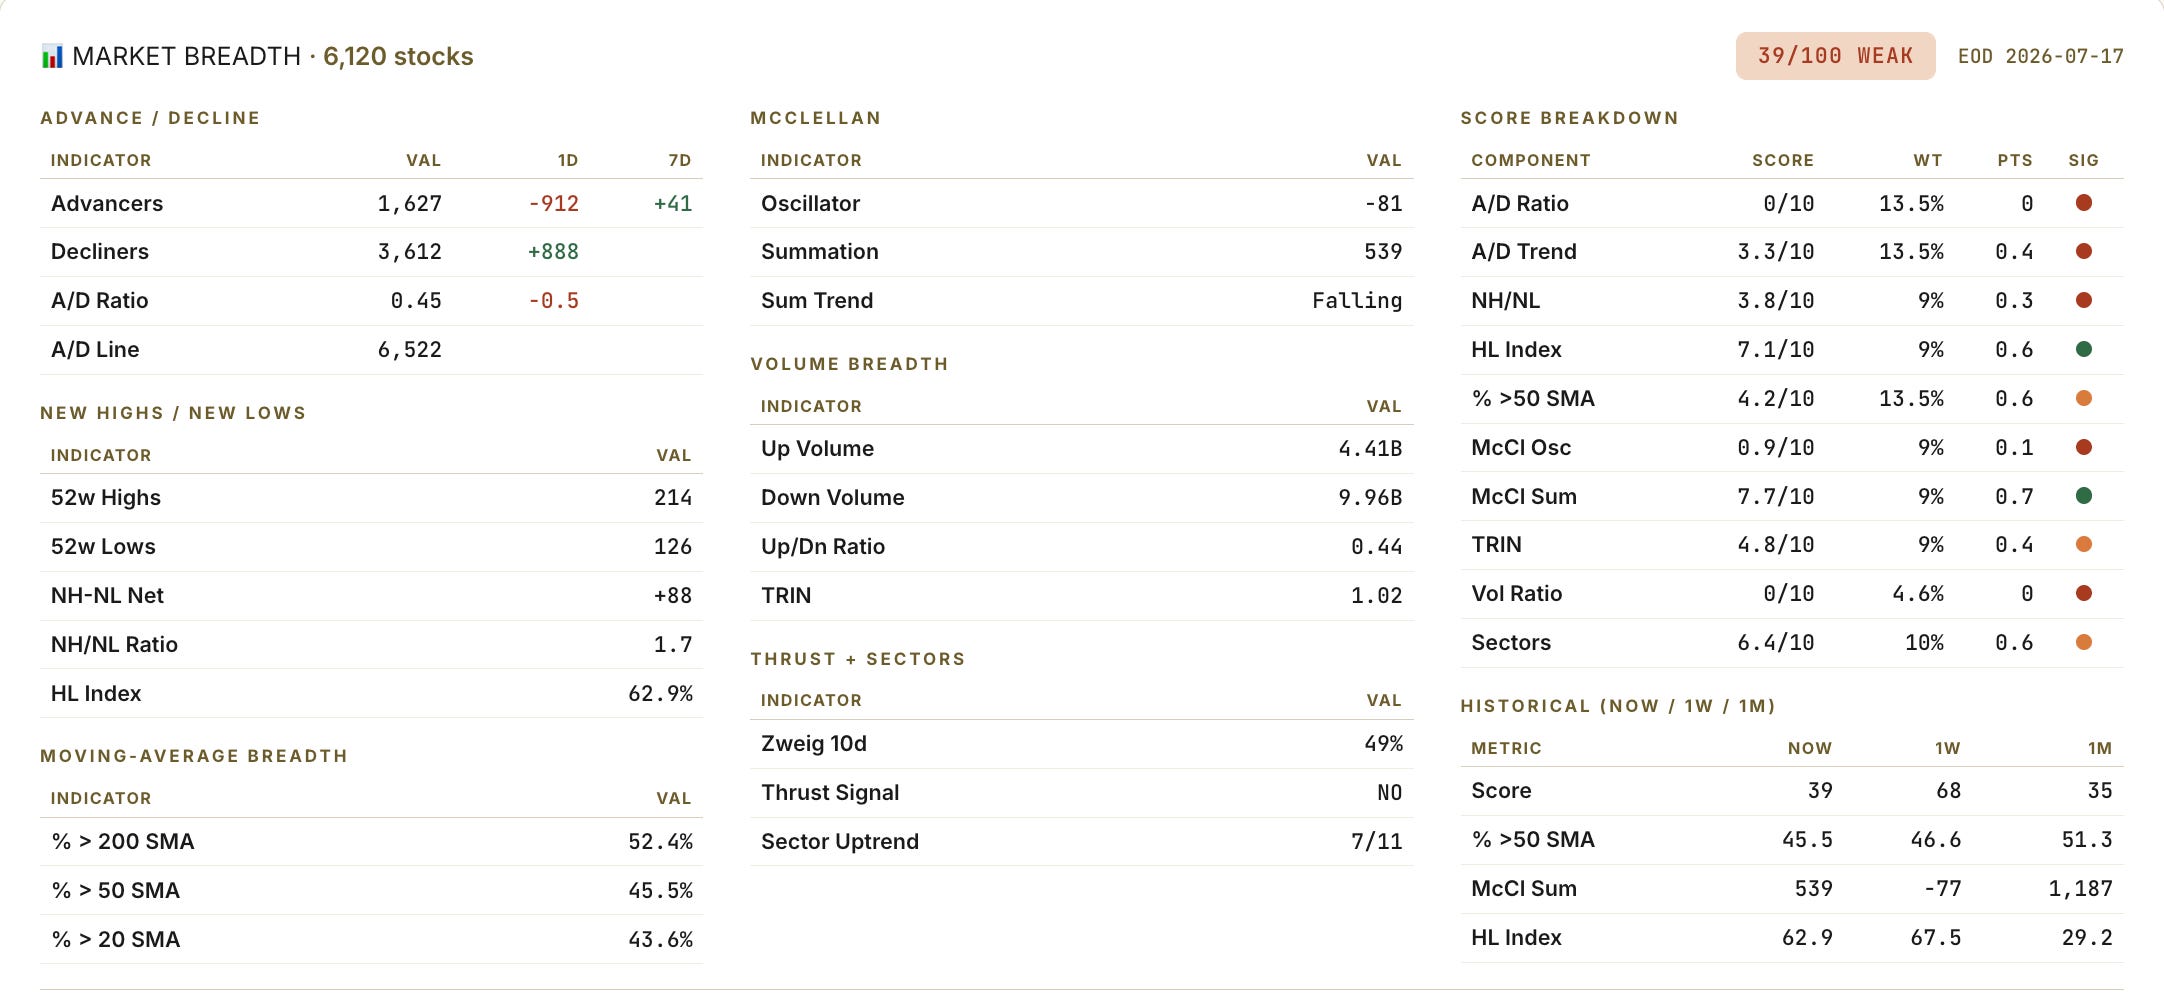
The composite health score fell to 39 from 68, a defensive reading, and this is the week to look past the number to the parts. Almost the entire drop came from one session and one thing: Friday’s selling. Decliners beat advancers by better than two to one, down-volume ran nearly 10 billion shares against 4.4 billion up, and the McClellan oscillator sank to -81. Those are the momentum gauges, and on Friday they cratered.
Now look at what did not move. The share of stocks above their 50-day line sits at 45.5%, down from 46.6% a week ago, a rounding error. Above the 200-day, 52%, still a majority. The median stock carries an RSI of 54, the reading of a market that is holding together. New highs still outnumber new lows. Participation barely eroded on the week. What broke was the pressure, the speed of the selling in a single heavy session. When a score falls on pressure while the levels hold, the tape is telling you sellers showed up in force for one day. Now you watch whether they come back.
🚨 Sector Rotation
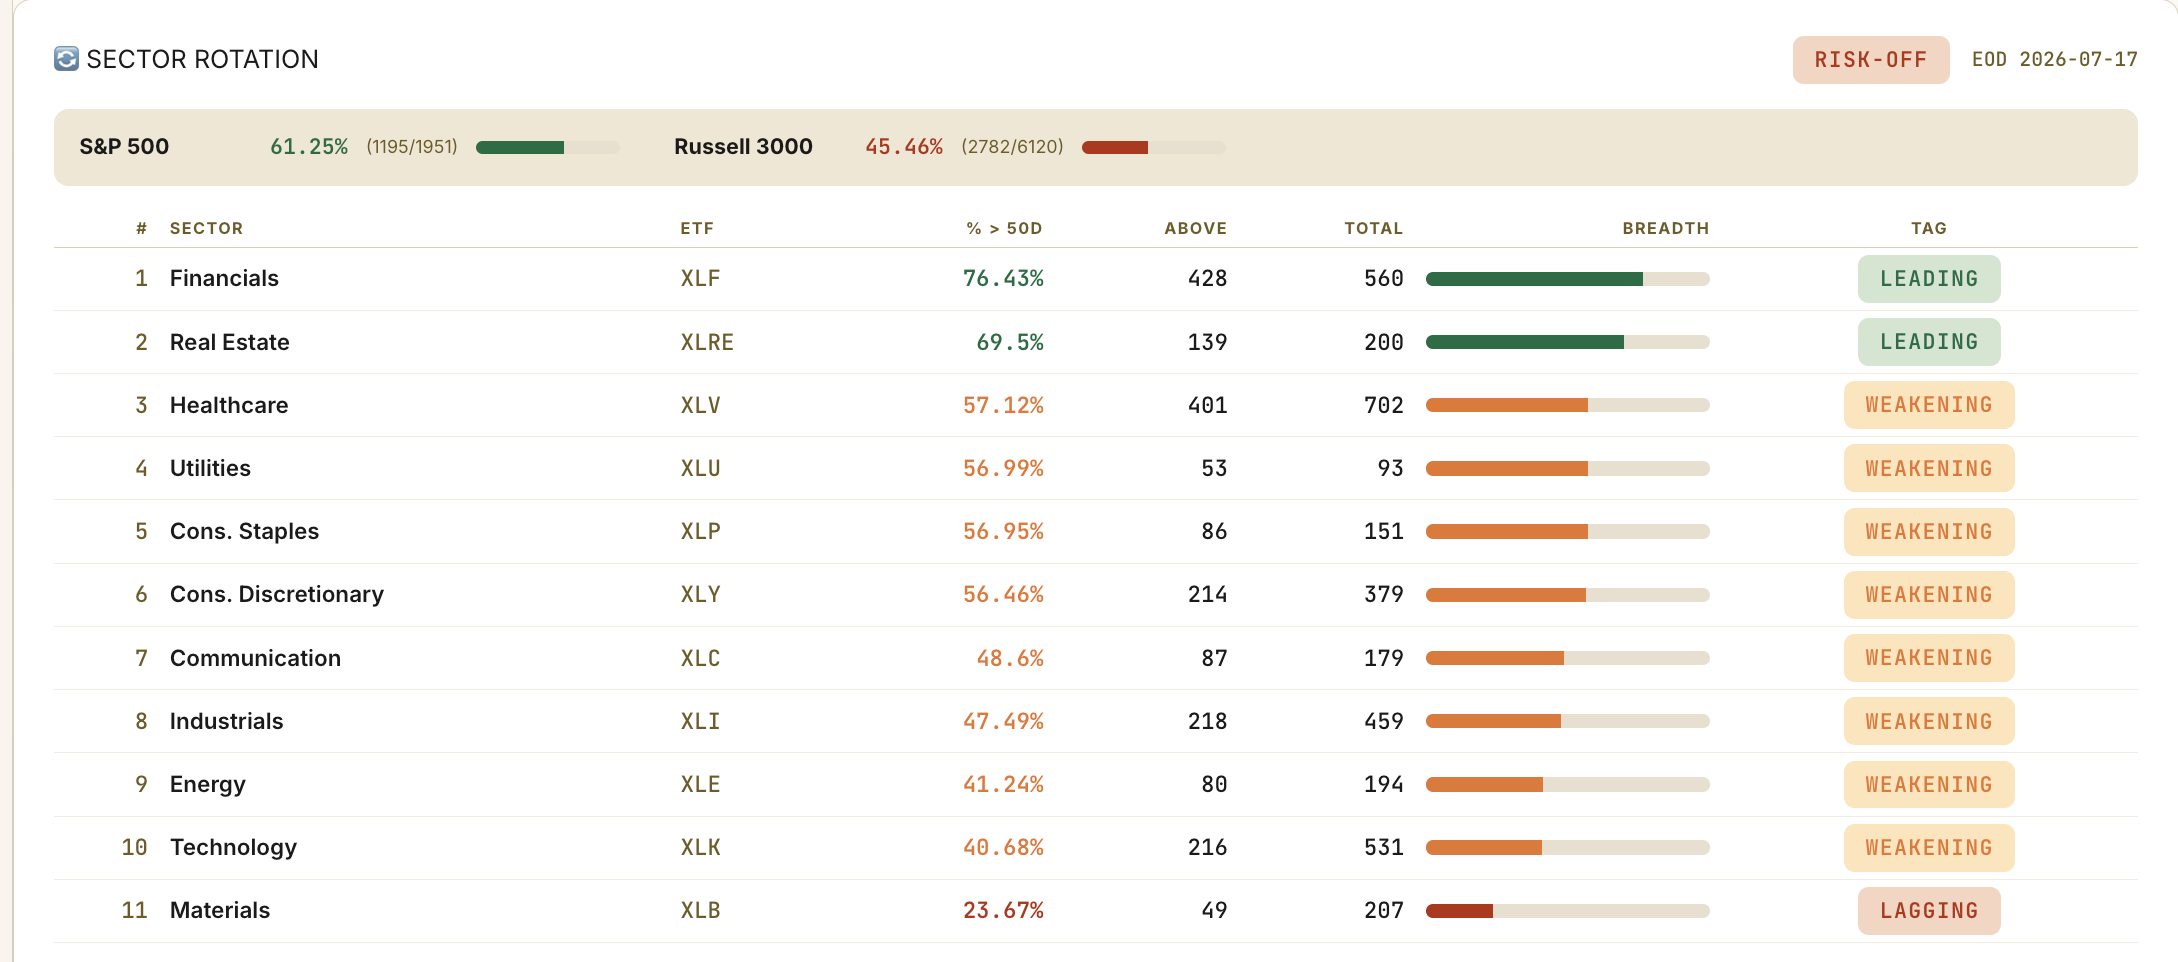
The leadership board barely moved. In a week that gashed the index, a leadership board that holds steady tells you plenty. Financials still own the top at 76.4% internal strength, up from 74.6%, and they climbed the same week they reported. Real estate jumped to 69.5% from 61.5%. Those two are the only sectors my board tags as leading, and both strengthened while the index fell. At the bottom, technology slid to 40.7% and materials sits alone in the basement at 23.7%. Six of eleven sectors still keep a majority of their stocks above the 50-day, down from seven last week.
So the money that left technology did not leave the market. It rotated into the financial-quality spine this rally has stood on since June, the same names that just backed their charts with blowout earnings. That is the difference between a market that is topping and one that is rotating. In a top, the money goes to cash and every sector bleeds together. This week it moved from the crowded corner to the leadership corner and stayed invested. Healthcare is the one crack in that story. It gave back its June firmness, slipped to 57% internal strength, and lost second place to real estate. One soft leader inside a rotation is a different animal than broad distribution, but I am watching it.
🔍 Pairs Alignment
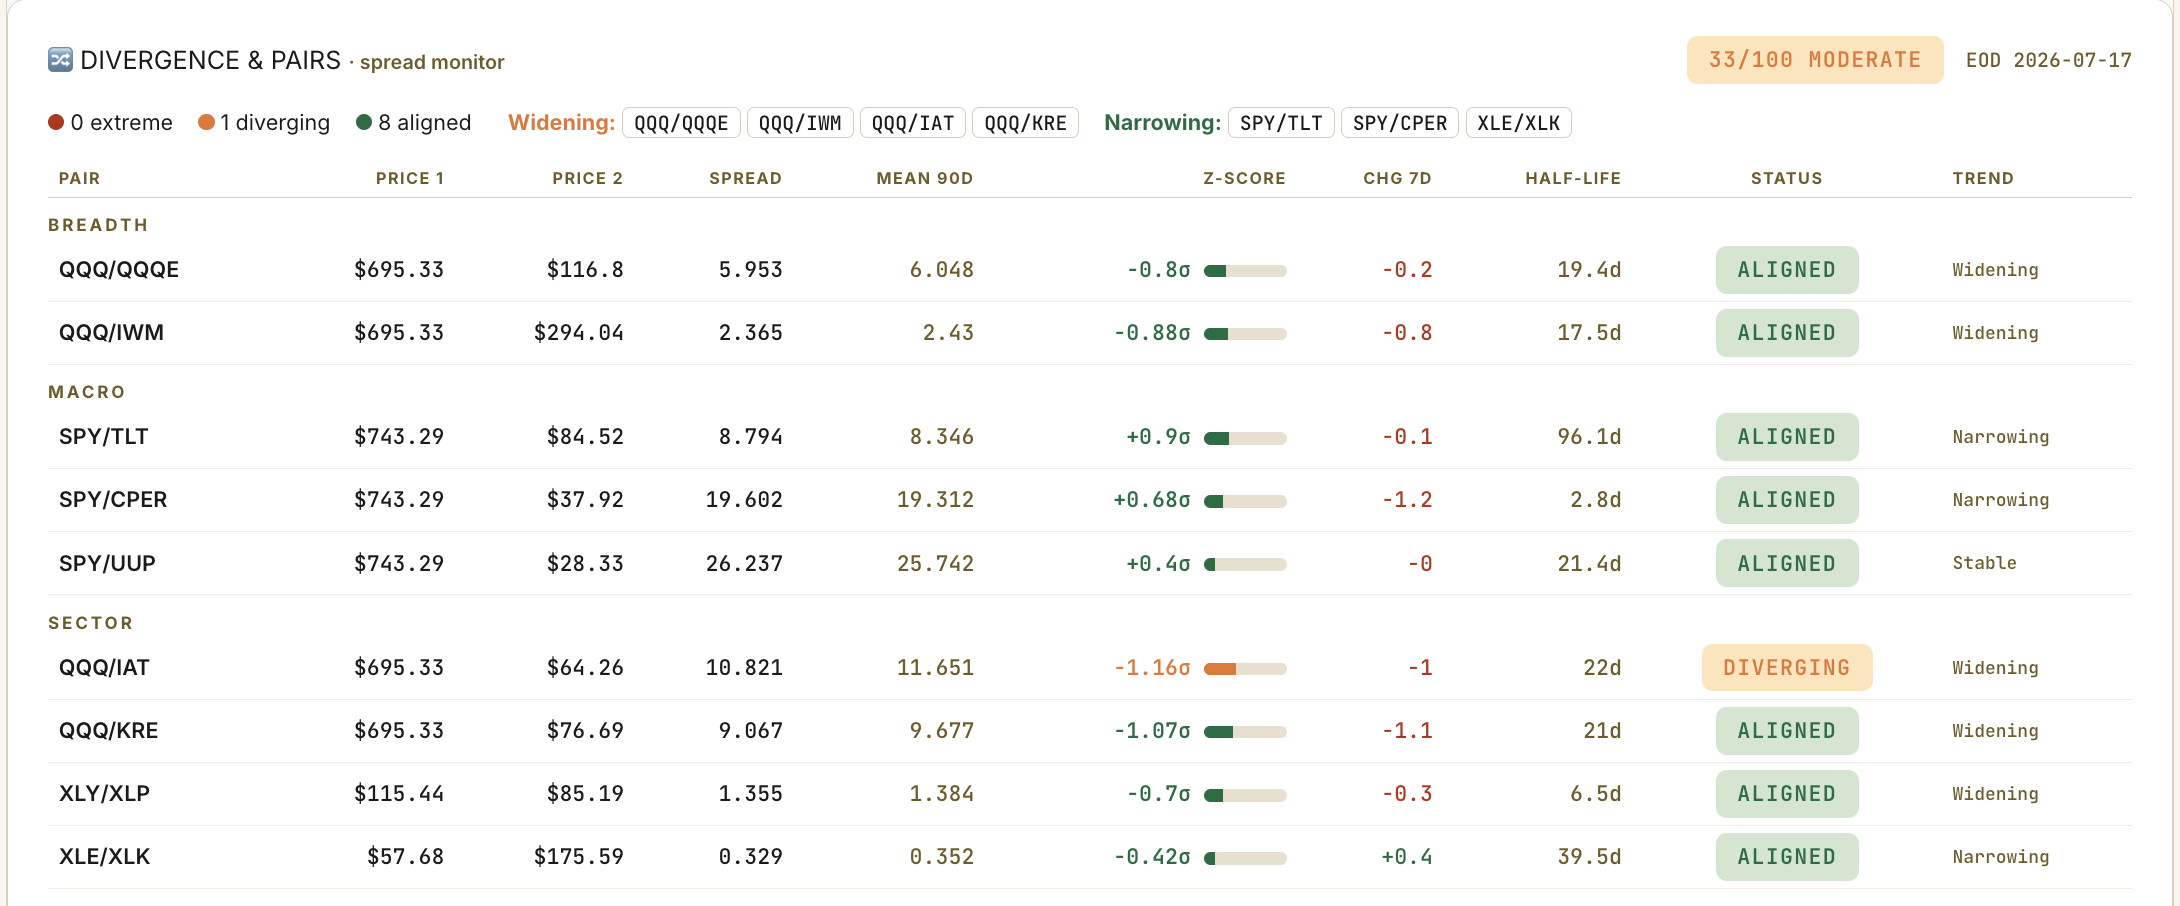
Eight of nine pairs on my board sit aligned, nothing at an extreme, and the one that broke ranks tells you what kind of week this was. Large-cap tech against the regional banks now sits 1.16 standard deviations stretched and widening, the only pair my monitor flags as diverging. The market sold technology and bought the balance-sheet trade underneath it. Every other spread stayed in its channel, the market’s way of saying the stress stayed inside one relationship instead of spreading through the whole structure.
The pair earning my closer attention is stocks against long bonds, because it finally turned. For two weeks I flagged that Treasuries refused to act as a haven, falling through a weak jobs report and then through live missiles. This week they caught a bid. The spread between the S&P and long bonds is narrowing again, and it narrowed because bonds rallied while equities wobbled, the first time in a month duration behaved like shelter. The haven I kept telling you was missing finally showed up. It came through in the bond market this time.
📉 Volatility
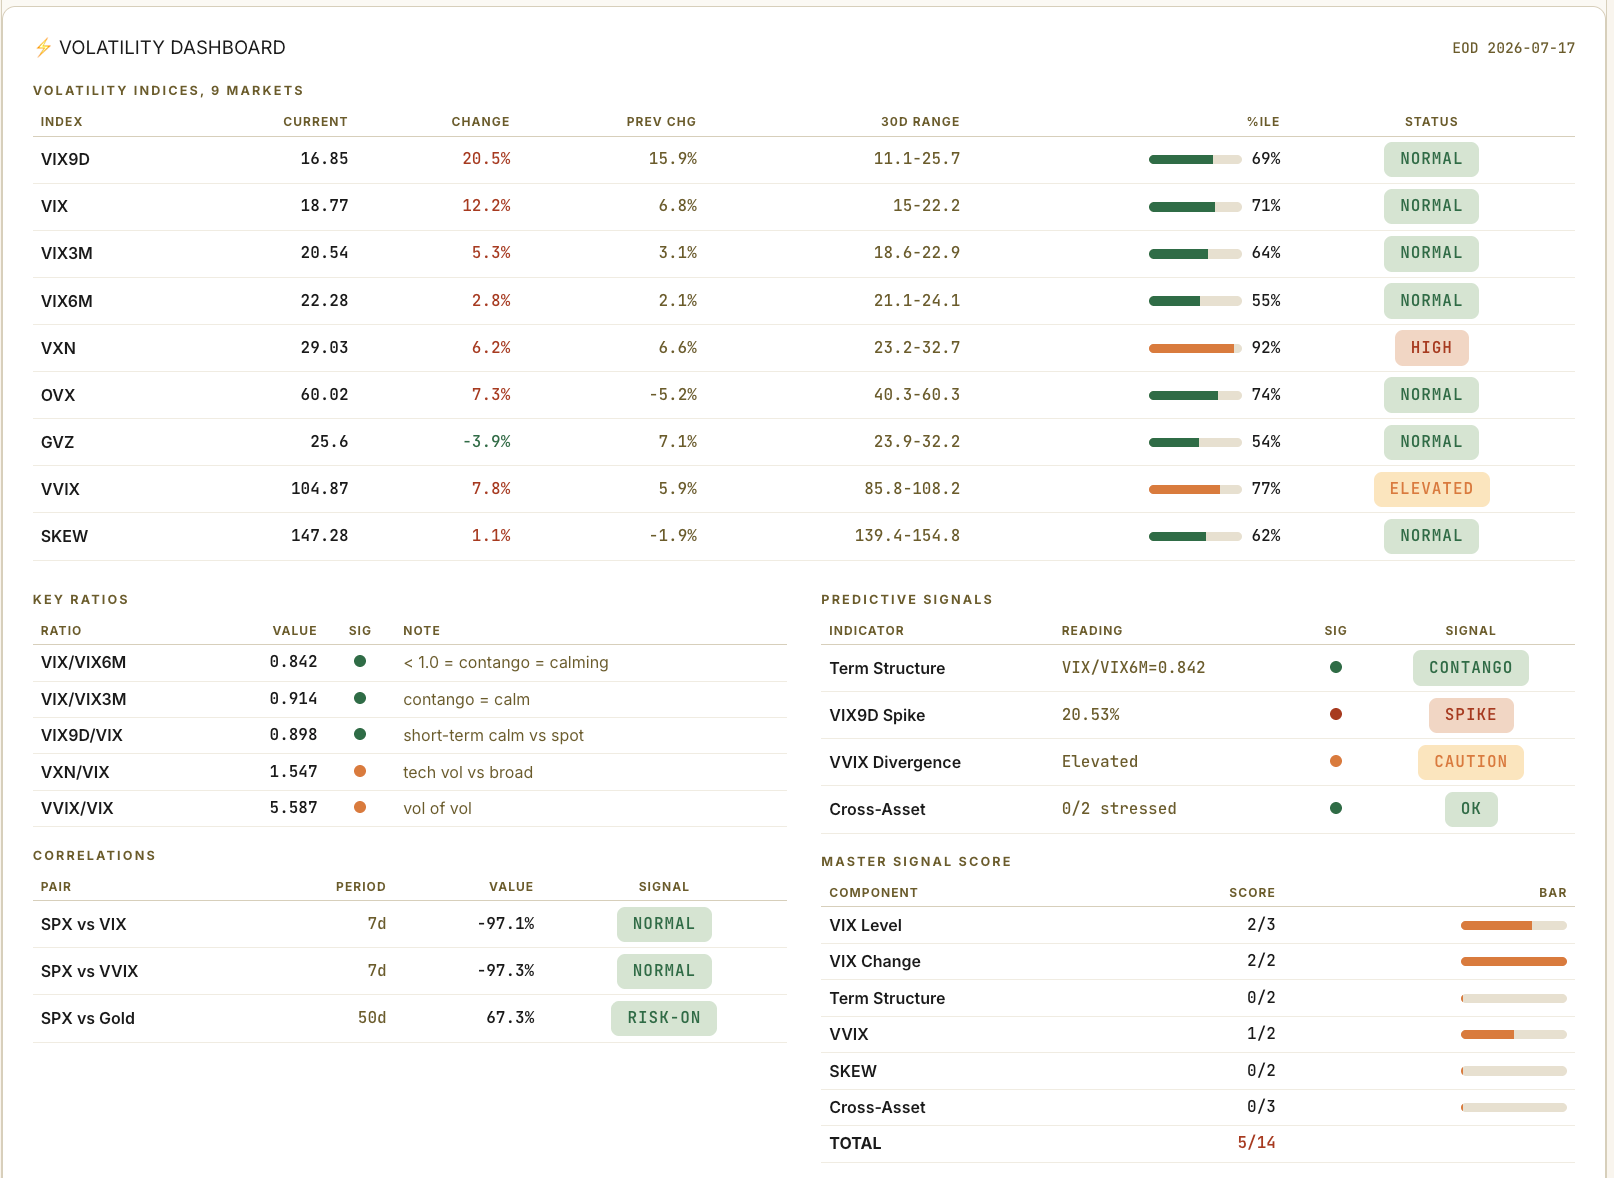
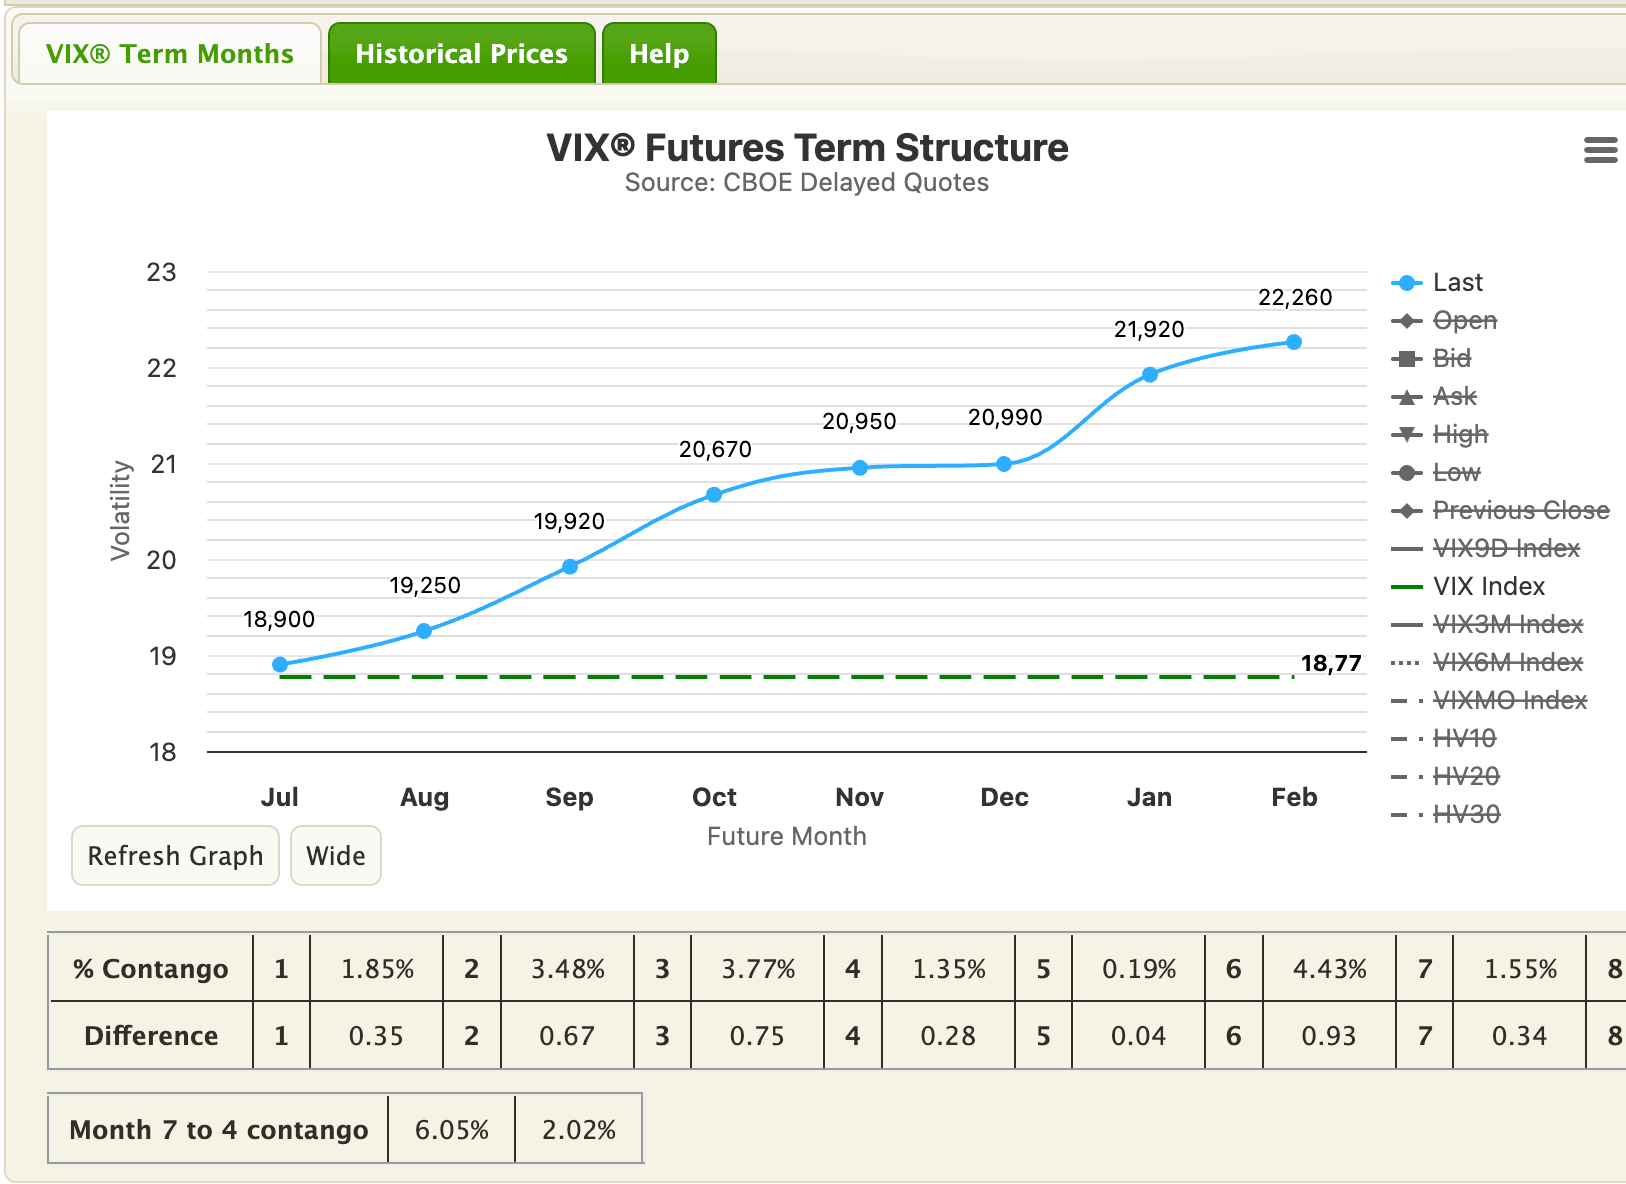
For a month I have told you the same thing off this dashboard: the risk is not in the broad index, it is in the tech corner, and that is the only place worth paying to hedge. This week the market proved it. Nasdaq volatility sits at 29, the expensive corner of the entire surface for a month running, and this week it climbed to the 92nd percentile of its year as the thing it was pricing finally happened. Meanwhile the broad VIX could not hold 19. It finished at 18.8, the curve never left contango, and my composite stress score reads 5 out of 14 with left-tail risk on low. A 4% tech decline, and the index vol complex treated it as a corner event and nothing more.
Two other corners still trade with a pulse. Oil volatility holds the 74th percentile at 60, the one place the second Iran flare and the port blockade are still being paid for. And the nine-day gauge jumped 20% on Friday to 16.9, a single session of nerves heading into next week’s tech earnings. My rule on spikes has not changed: a stress reading has to hold for three days before it means anything, and this one is a day old. Broad index hedges remain a waste of premium. If you hedge, you hedge the tech corner, which spent this week showing you why one more time.
💱 FX
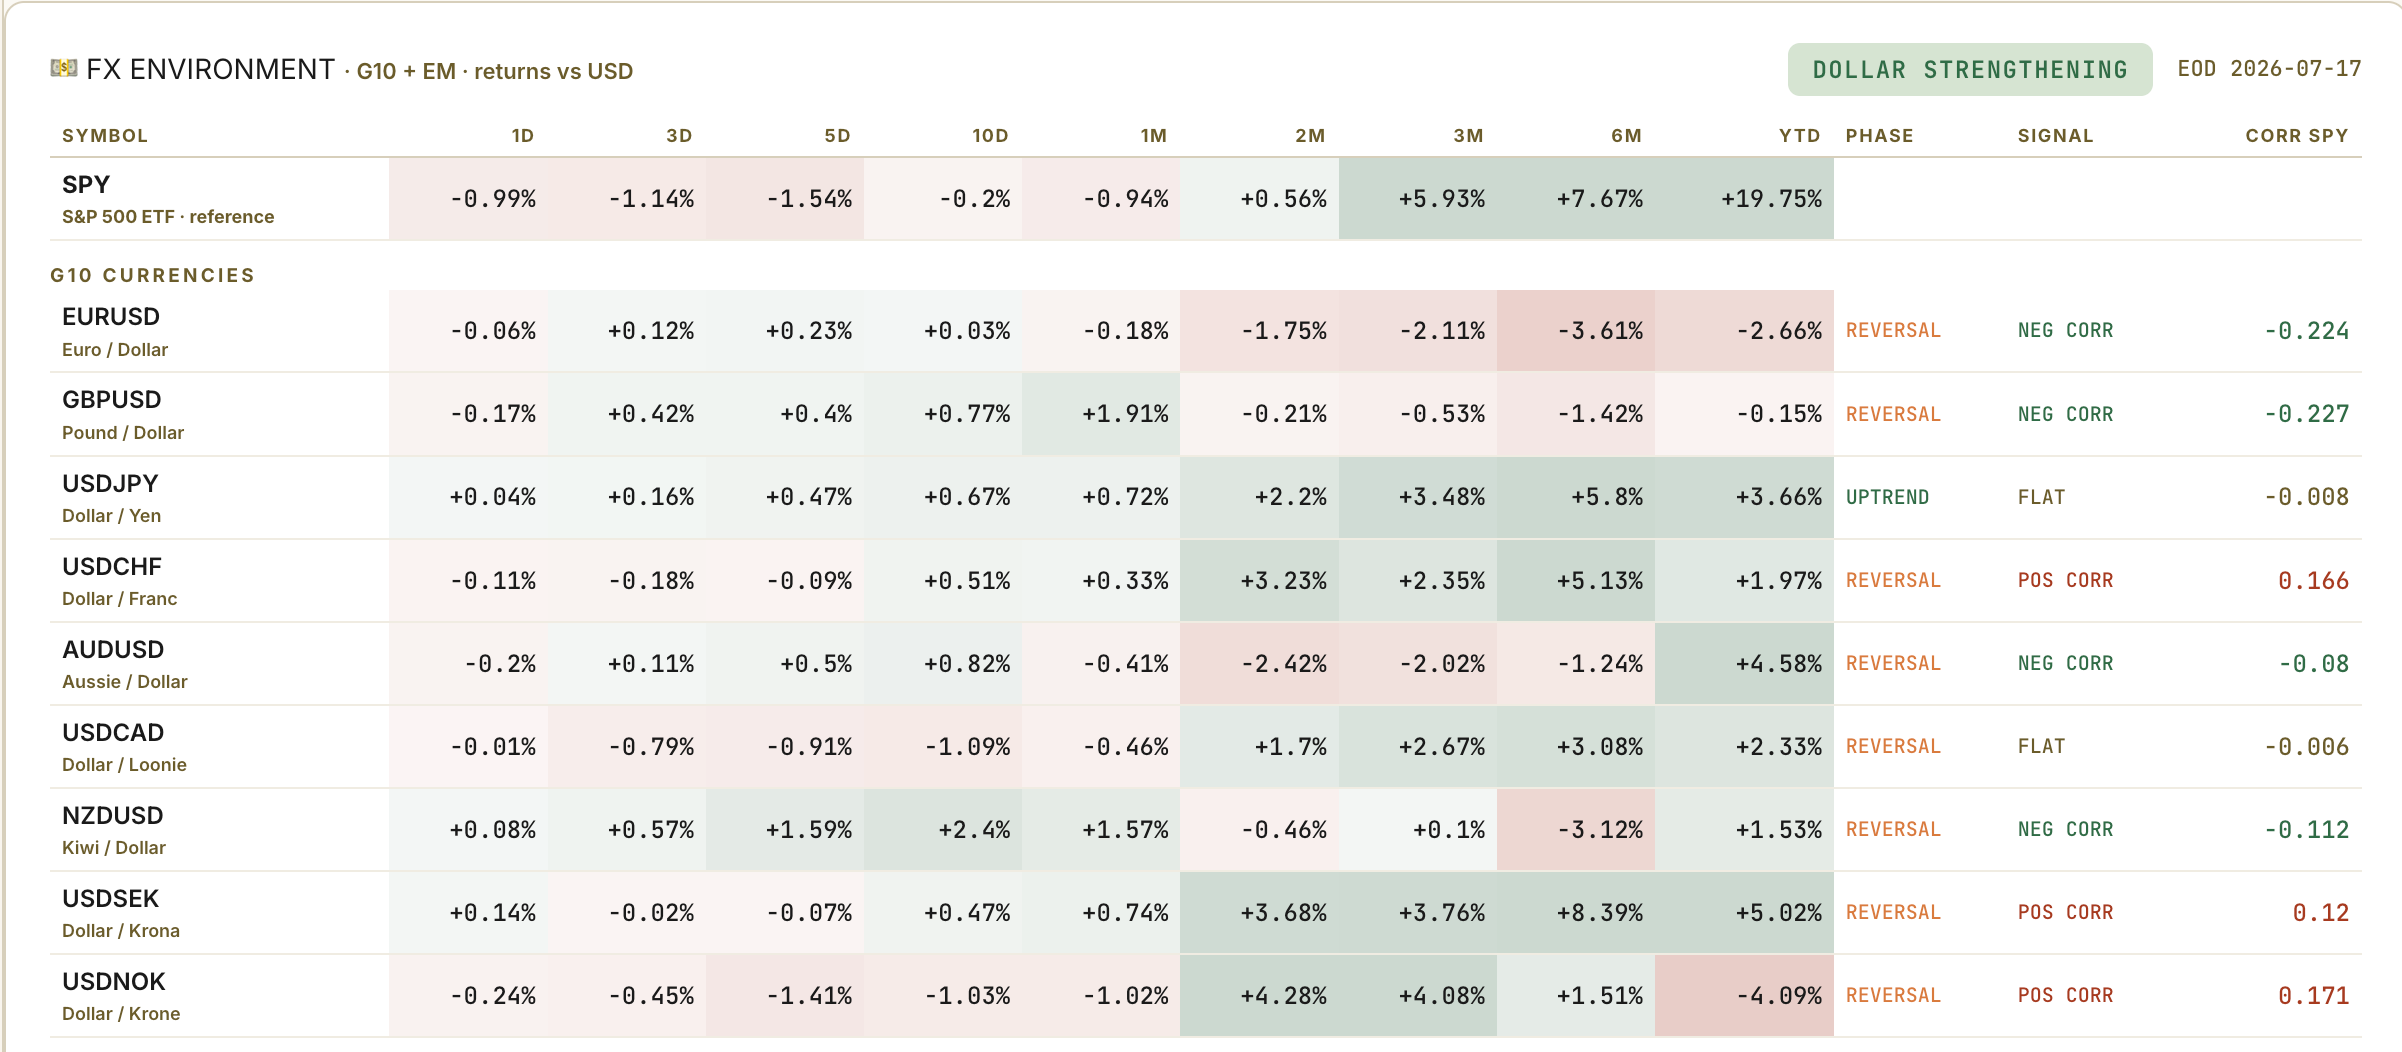
The currency board gave the cleanest read of the week, and for the third week running it said the same word: no fear. The dollar is strengthening across nearly the whole board. The franc, the first place money runs when the shooting starts, sits weak against it. The yen is in a clean downtrend, the currency market telling you the carry trade is on and funding is loose, the opposite of a haven scramble. Gold is moving with stocks, a risk-on posture on my fifty-day read. In a real scare it runs the other way.
Put it beside the bond move and the picture completes itself. The only haven that caught a bid this week was US duration. The franc stayed soft, the yen kept sliding, and gold tracked the tape higher instead of running from it. When equities sell and the one shelter that works is Treasury bonds, while the dollar grinds higher and the carry trade hums, you are watching an orderly rotation out of an expensive corner. Real fear looks different. The recipe I gave you weeks ago, the franc rising while stocks fall and vol spikes together, printed none of its ingredients.
🧠 My Take
The framework pointed at the right corner. For a month my volatility board flagged technology as the expensive, fragile part of this tape, and technology is exactly where the week broke. The read was right. The mistake was the weighting. I filed the tech-corner risk as a side scenario and made broadening my base case, when the board on my own screen was telling me the crowded corner was the story.
So the stance sharpens; it does not turn. Still long, still anchored in the financial-quality leadership, which held every bit of this week’s fire and backed it with earnings. What I will not do is chase the expensive end of technology, the megacaps still parked near their highs, until the spending scare is priced. Buying the wreckage that scare created is a different bet, and it is the one I take below. The worry list is two items. First, Friday’s selling pressure. One heavy session is noise, but if the sellers come back next week, the breadth levels that held this time start following the pressure down, and then it is a real problem. Second, the whole tape now hinges on a single evening. Alphabet and Tesla report Wednesday after the close, straight into the capital-spending fear that started this selloff, and Alphabet’s guidance on how much it plans to spend is the number the entire AI trade is waiting on.
Technology steadies and the top-heavy dip resolves higher, 40%. This is my base case for one reason: the damage never reached the average stock. Equal-weight fell less than half a percent, the median RSI is a healthy 54, and the leadership got stronger.
The tech leg extends and drags the tape, 35%. Alphabet guides its spending aggressively, confirms the fear the chip names flagged, and the mega-cap complex legs lower a second week. This time the weight of those names pulls the index far enough that the breadth levels finally give, and Friday’s pressure turns out to have been the first domino rather than a one-day event.
A broad risk-off, 25%. A tech miss lands on top of another oil escalation, the nine-day vol gauge that jumped Friday keeps climbing, the term structure inverts, and the orderly rotation turns disorderly, finally reaching the names that held. My board has a clean trigger for this one: I flip defensive across the whole book the day the nine-day VIX closes above spot VIX and the curve backwardates. It has not, yet.
🔥 Trade of the Week:
This is the wreckage I mentioned. All week the market dumped anything tied to the AI build-out, terrified those spending budgets are about to get cut. Caterpillar sells the engines and the power those data centers run on, so it got thrown out with the chips, down 20% in three weeks. That is the entire trade. Same catalyst as the whole tape: Alphabet, Wednesday night. If its guidance holds, the names the scare knocked down are the ones that snap back hardest.
The setup
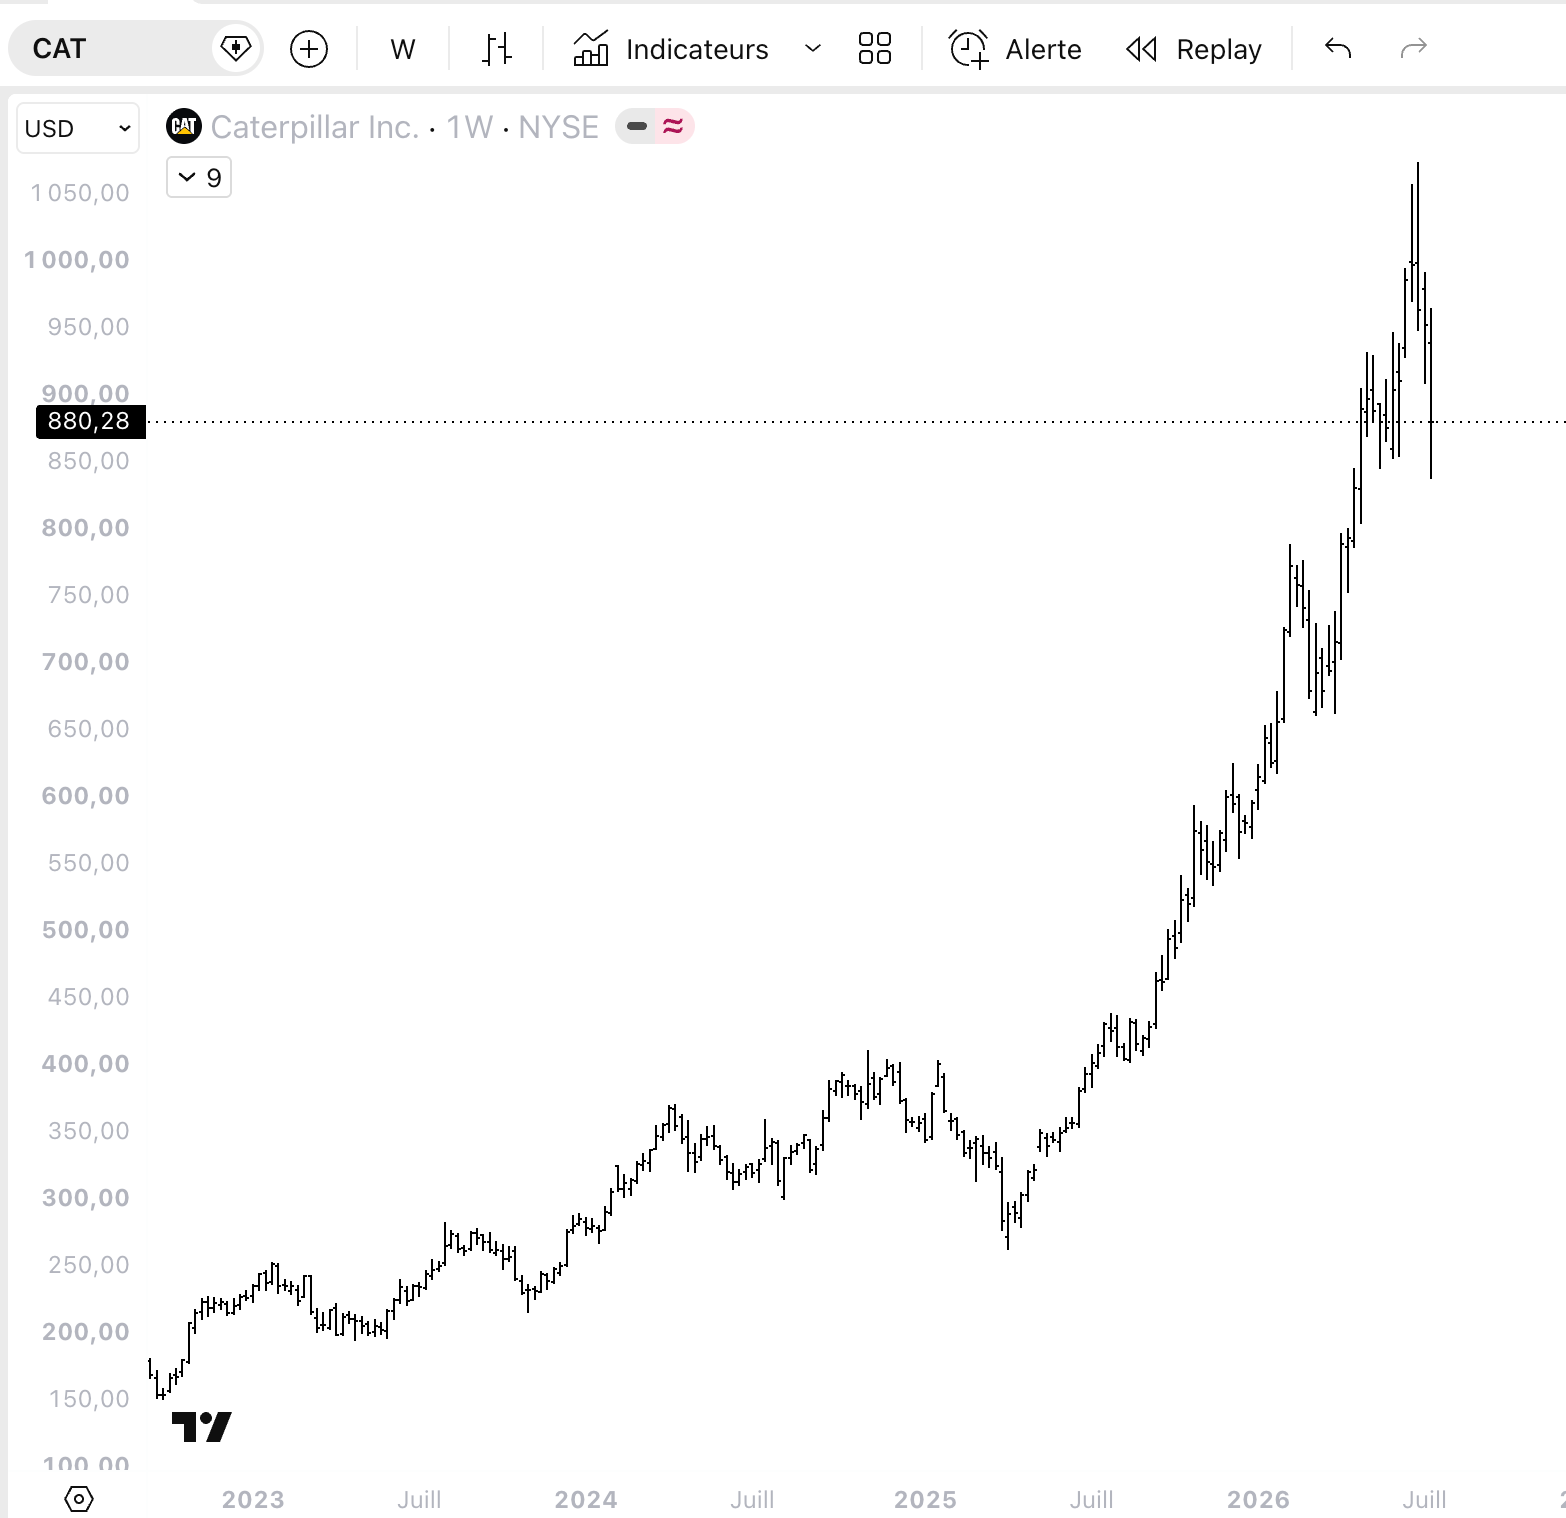
Caterpillar spent 2024 building a base in the low $300s, then ran almost without a pause to $1,065, one of the great trends in the industrials, powered by the data-center and grid spending that needs its engines and turbines. Over the last three weeks that trend took its first real hit. The stock fell from above $1,040 to an intraday low of $838 on Friday, a drop of roughly 20%, and it did it while the equal-weight market barely moved.
Here is what turned it from a falling stock into a trade. On Friday, the ugliest tape of the week, Caterpillar dropped to $838 and then reversed hard, closing the session at $880, forty dollars off its low and in the upper third of the day’s range. A stock that stops going down and closes strong on the worst day of the week is telling you the sellers are exhausting. That reversal off a washed-out low, in a real market leader, is exactly what the contrarian book fishes for.
The honest part
Start with the chart, because it cuts both ways and you should see it plainly. This is a parabola. The move from the low $300s to $1,065 went nearly vertical, and vertical moves do not correct politely. A 17% pullback here can be the dip that gets bought, or it can be the first leg of a much deeper give-back toward the 200-day average down near $720. I am playing for the bounce off Friday’s reversal, and the stop is where I admit the parabola won.
This is also a pullback buy in a defensive tape, with the stock still under its 50-day, so I am buying into weakness and betting it turns. If Friday’s low gives way, there is real air beneath it.
And the whole thesis leans on the data-center spending story holding. The same capital-spending fear that hammered the chips this week can turn on the companies that sell the picks and shovels, and Caterpillar is the pick-and-shovel trade.
The levels
Entry: around $878, Friday’s reversal close, or better toward $855 to $865 on a quiet retest. Do not chase above $895.
Stop: a close below $830, under Friday’s $838 low. Lose that and the reversal failed and the deeper mean-reversion is on. That is roughly a 5% risk from entry, which is exactly why this stays a starter.
Target 1: $955, the shelf the stock broke down from two weeks ago, about 1.6 times the risk.
Target 2: $1,000, the round number and the last support on the way down, about 2.5 times.
Stretch: $1,065, the high, if the leader fully repairs. That is a 21% move from here, and it is why a beaten leader gives you more room than a fresh breakout at its high.
Sizing: a parabola, in a pullback, inside a defensive regime is three reasons to keep it light. Add on a reclaim of the 50-day near $929, once the bounce proves it has legs.
See you next week,
Daniel
P.S. I opened the APP recently. It’s the daily version of what you just read, the same boards and screeners I run every morning before I trade.
The founding price, 50% off the first year, holds until tomorrow, then it goes back to full.

Disclaimer
This newsletter is for educational and informational purposes only. It is not financial advice.
The content reflects personal opinions shared publicly as a journal. Trading stocks, options, futures, or any financial instrument involves significant risk. You can lose your entire investment. There is no guarantee of profit.
The author is not a registered investment advisor, broker, or financial professional with any regulatory authority including the SEC or CFTC. Always consult a licensed financial advisor before making any investment decisions.
By reading this newsletter, you accept full responsibility for your own trading and investment choices. Past performance does not guarantee future results. Markets are unpredictable.
Screenshots are courtesy of TradingView, VixCentral, and other platforms with which the author has no affiliation. Information shared may contain errors or become outdated quickly.
This content is the intellectual property of the author. Copying or redistributing without permission is prohibited.
By continuing to read, you acknowledge and accept these terms.
Read the desk every week
Market analysis in plain English, plus the app that scans the whole US market for you.
Become a member Read the original on Substack ↗